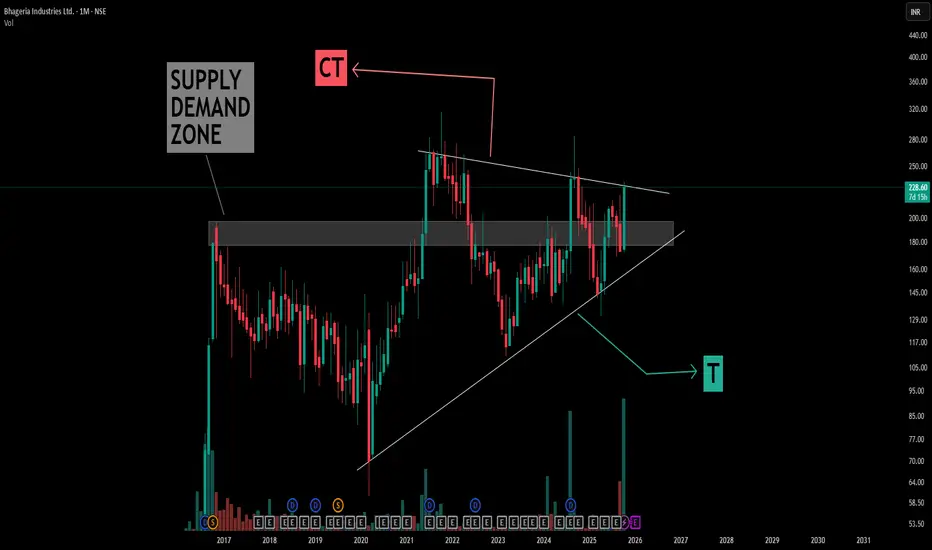
Mastering MTFA Charts : Symmetrical & Descending PatternsObserve the synergy of multiple time frames with this detailed analysis of Bhageria Industries Ltd.
Target Points -
1) The right panel displays a monthly chart, highlighting a broad symmetrical triangle formation within a prominent supply-demand zone—notice how the structure showcases the interplay of lower highs and higher lows, reflecting a period of equilibrium and market compression.
2) The left panel brings the focus to the weekly time frame, where a descending triangle pattern unfold
Symmetrical Triangle
Understanding Symmetrical Triangle Patterns in depthThis chart illustrates a classic example of a symmetrical triangle pattern formed over several years, with simple compression trendline (CT) and trigger (T) lines drawn in white for clarity.
Key learning points from the structure:
- Symmetrical Triangle Formation: The pattern is defined by converging trendlines representing successive lower highs and higher lows, indicating a period of price consolidation and market indecision
- Supply Converts to Demand: The boxed area initially acted as suppl
Bharat Forge (BHARATFORG)Pattern: Symmetrical Triangle
Breakout Zone: Above ₹1,272
Structure: Higher-low formation inside triangle; RSI > 55, MACD crossover supportive
Volume: Expansion seen near breakout candle
Plan:
Buy Trigger: Close above ₹1,272
Stoploss: ATR-based (~₹1,230)
Targets: ₹1,380 → ₹1,450
View: Momentum-supported breakout; auto-ancillary sector showing rotation strength.
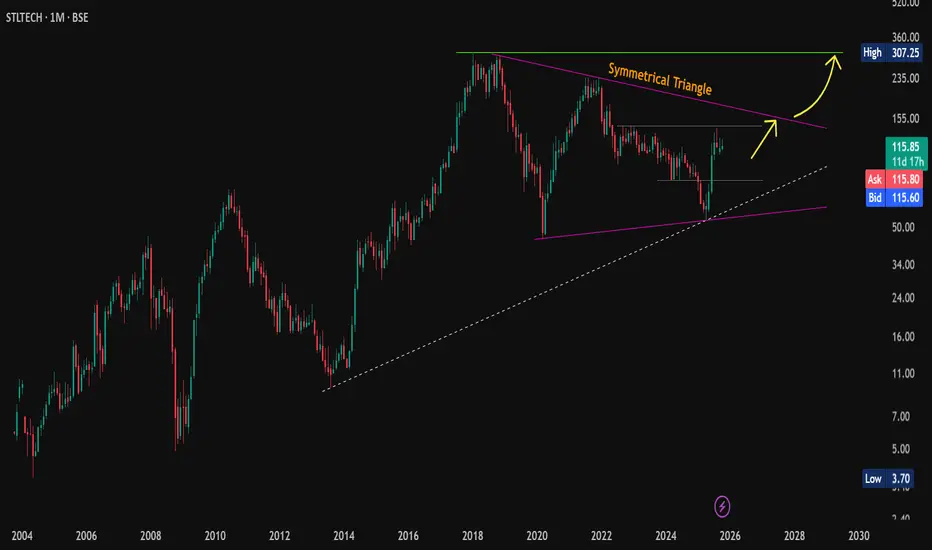
#STLTECH: Sleeping Giant in Fibre Space?✨ #MuhuratPick 🪔
CMP: 115.85
📐 Pattern: Symmetrical Triangle on Monthly Chart
🔼 Immediate Resistance: 143 (breakout zone)
🔽 Support Levels: 105 / 95 | Strong support: 82
❌ Pattern Invalidation: 61.80 (MCB)
🎯 Pattern Target:
Triangle height ≈ 251 points from trendline → Potential target = ATH 307+
🚀 Can Go Big in the Long-Term
#DiwaliPick | #STLTECH | #SterliteTech | #DataCentreTheme | #OpticalFibre | #ChartSetup | #LongTerm | #SymmetricalTriangle | #ChartPatterns | #TurnAro
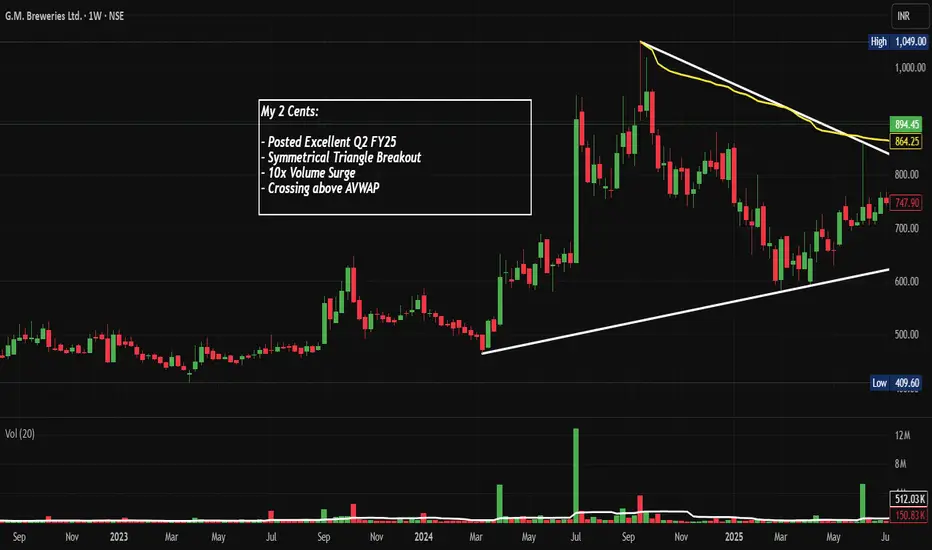
GMBREW: Broke Out Post Q2 FY26 with 10x Vol, Chart of the WeekA Small-Cap Brewery Stock NSE:GMBREW Broke Out With 10x Volume and Posted 61% Profit Growth in Q2 FY26. Let's Analyse in the "Chart of the Week"
As per the Latest SEBI Mandate, this isn't a Trading/Investment RECOMMENDATION nor for Educational Purposes; it is just for Informational purposes only. The chart data used is 3 Months old, as Showing Live Chart Data is not allowed according to the New SEBI Mandate.
Disclaimer: "I am not a SEBI REGISTERED RESEARCH ANALYST AND INVESTMENT ADVISER."
T
ETH Retest Confirmed – Bullish Momentum Intact!CMP: $3,968
Ethereum is holding strong above the symmetrical triangle breakout zone after a textbook breakout + retest . Despite the recent consolidation, the structure remains bullish , and the bigger pattern is still in play.
🔶 Technical Highlights:
✅ Symmetrical Triangle Breakout: ETH successfully broke out and retested the upper trendline (see red circle). This retest confirms the breakout validity.
✅ Consolidation Above Resistance: ETH is consolidating in a tight range above
Symmetrical Triangle & Parallel Channel CoexistenceThis weekly chart of Tara Chand Infralogistic Solutions Ltd. serves as a case study in identifying and analyzing overlapping price action structures in 3 Main Points -
1) The chart highlights a well-defined symmetrical triangle pattern, with one white line representing the counter-trendline (CT) and another as the primary trendline (T), illustrating the process of volatility contraction.
2) Overlaid within the triangle, a clearly marked parallel channel (in pink) frames the intermediate price
#Nifty | Will Nifty Break Free? Triangle Says Soon!#Nifty Daily Outlook:
CMP: 25,285
Pattern: Symmetrical Triangle ▶️
A Symmetrical Triangle pattern is forming on the daily timeframe , following a strong uptrend , a classic bullish continuation setup .
🟣 Breakout Level: A daily close above the falling trendline from the all-time high (ATH) ( marked in purple ) will confirm the breakout.
🎯 Pattern Target: 26,700
🔒 Pattern Invalidation: Close below 24,337 DCB
Price action is compressing tightly within the triangle, ind
Symmetrical Triangle Breakout Watch | Sequent Scientific-Red line marks a key counter trendline (resistance) from previous swing highs, acting as a short-term ceiling.
-Green line indicates the primary trendline (support) from recent swing lows, showing steady price strength.
-Hidden dashed lines reveal underlying resistance zones, adding complexity to potential breakout levels.
-The overall chart displays a large symmetrical triangle pattern—a classic consolidation setup, Simple .
- Disclaimer: Trading involves significant risk and is not suita
Triangle Breakout Alert: Aluminium Bulls Waking Up?CMP: $2743
Aluminium is breaking out of a symmetrical triangle on weekly timeframe after months of consolidation.
📍 Breakout Zone: $2736 – $2799
📉 Support Levels: $2633 / $2543 – $2481
📈 Resistance Zones: $3170 – $3229, then $3388
🎯 Symmetrical Triangle Pattern Target: ~$3378 (+23% from CMP), which aligns closely with the major resistance zone between $3229 – $3388 .
A weekly close above $2736 – $2799 could support further upside momentum.
If price pulls back within the tr
Sagility cmp 43.47 by Daily Chart view since listedSagility cmp 43.47 by Daily Chart view since listed
- Support Zone 40.75 to 42.75 Price Band
- Resistance Zone 45.50 to 47.50 Price Band
- Price traversing inside Symmetrical Triangle pattern
- Support Zone repeatedly tested rested since month of July 2025
- Price trending in Darvas Box range 41.50 to 47.50 and awaiting Breakout
- Price rejection seen by frequent selling pressure at Resistance Zone upper band
- Fresh Breakout possible basis supportive Volumes based closure above 47.50 price l
BEL (Bharat Electronics Ltd) – Technical SetupPattern: Symmetrical Triangle breakout visible on the daily chart.
Breakout Confirmation: Price has moved above the triangle resistance trendline with rising volume.
Targets (Fibonacci-based):
1st Target: ₹435
2nd Target: ₹480
3rd Target: ₹512
Stoploss: ATR-based, below support zone (~₹395–₹400).
---
🔎 Multi-Timeframe Check
Daily: Strong breakout setup with RSI > 60, MACD crossover supportive.
Hourly: Needs sustained close above breakout for confirmation.
Weekly: Still consolidatin
Silver Bullish Breakout on Monthly & Weekly CharPattern Formed: Symmetrical Triangle (Long-Term Consolidation)
Breakout Type: Bullish Breakout on Monthly & Weekly Chart
Volume Confirmation: Strength in breakout with price expansion
Measured Move Target: ~$44 (based on triangle height projection)
Immediate Resistance Zone: $44.11 (Historical supply zone)
Support Levels Post-Breakout:
Immediate Support: $34.78
Strong Support: $33.28
5000 Days vs 500 Days of Data : Which is better ?Most traders jump straight into attractive chart patterns and impulsively take trades, ignoring the bigger picture. Here’s a powerful case study
Left Side: Full Monthly Chart with Hidden Resistance
On the left, the chart captures over a decade of price action, immediately drawing attention to a long-standing downward-sloping resistance stretching from all-time highs. This hidden resistance line is not visible on the usual zoomed-in view, yet it presents a formidable barrier that traders often
BANCOINDIA: BO after Consolidation, Chart of the WeekBanco Products Broke Out From a Consolidation, Continuing Its Massive Bull Run. Let's analyse in "Chart of the Week"
As per the Latest SEBI Mandate, this isn't a Trading/Investment RECOMMENDATION nor for Educational Purposes; it is just for Informational purposes only. The chart data used is 3 Months old, as Showing Live Chart Data is not allowed according to the New SEBI Mandate.
Disclaimer: "I am not a SEBI REGISTERED RESEARCH ANALYST AND INVESTMENT ADVISER."
This analysis is intended solel
Breakout - Looks Good On Chart - GRAPHITE📊 Script: GRAPHITE
📊 Industry: Industrial Products (Electrodes & Refractories)
Key highlights: 💡⚡
📈 Script is trading at upper band of BB.
📈 MACD is giving crossover .
📈 Crossover in Double Moving Averages.
📈 Right now RSI is around 63.
📈 One can go for Swing Trade.
📈 In Monthly Chart It Script is forming Symmetrical triangle and about to give breakout, we can see good rally in future.
⏱️ C.M.P 📑💰- 555
🟢 Target 🎯🏆 - 578 / 597
⚠️ Stoploss ☠️🚫 - 539
⚠️ Important: Always maintain your Risk
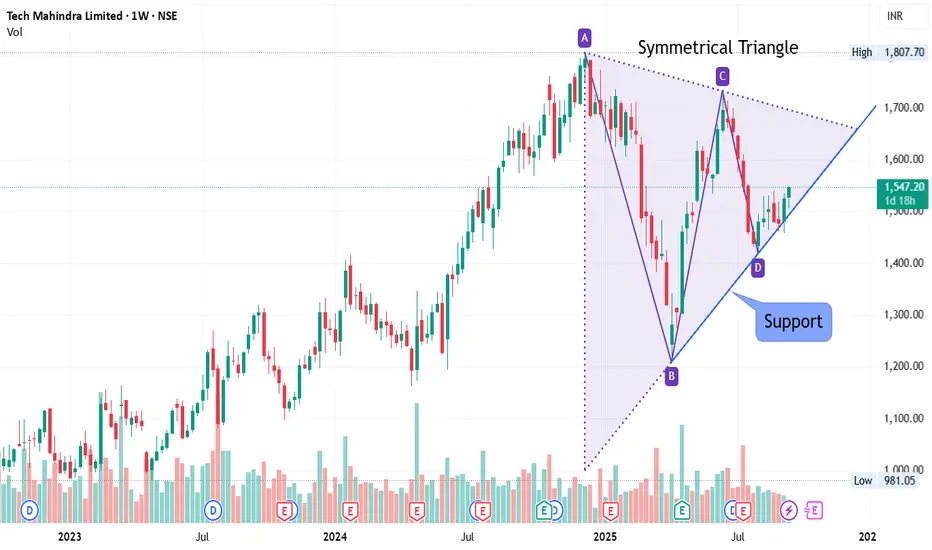
At Support - Weekly Chart - TECHM📊 Script: TECHM
📊 Industry: IT - Software (Computers - Software & Consulting)
Key highlights: 💡⚡
📈On Weekly Chart Script is forming symmetrical triangle and trading near support line.
📈 Script is trading at upper band of BB.
📈 MACD and Double Moving Averages are giving Crossover
📈 Right now RSI is around 58.
📈 One can go for Swing Trade.
⏱️ C.M.P 📑💰- 1547
🟢 Target 🎯🏆 - 1612 / 1655
⚠️ Stoploss ☠️🚫 - 1499
⚠️ Important: Always maintain your Risk & Reward Ratio.
✅Like and follow to never miss a
Eris Lifesciences Ltd: Symmetrical Triangle FormationEris Lifesciences Ltd . is currently exhibiting a Symmetrical Triangle Pattern on its daily chart. This pattern is characterized by converging trendlines formed by lower highs and higher lows, indicating a period of consolidation. While symmetrical triangles often serve as continuation patterns, they can also signal potential reversals, depending on the breakout direction.
The pattern's apex is approaching, suggesting that a breakout—either upward or downward—is imminent. It's crucial to moni
Breaking Out of Falling Wedge and Symmetrical TriangleNSE:SYRMA is breaking out of Falling Wedge and Symmetrical Triangle Breakout on Weekly TF. With 2nd Best Weekly Volumes.
NSE:SYRMA is a Chennai-based engineering and design company engaged in electronics manufacturing services (EMS). The company provides integrated services and solutions to original equipment manufacturers (OEMs) from the initial product concept stage to volume production through concept co-creation and product realization.
Recently it posted good Q2 FY 24-25 Results, post
LTIM: The Final Squeeze – Breakout or Breakdown?LTIMINDTREE: The Big Squeeze! ⚡ Which Way? 🐂🐻
Timeframe: Daily
Trade Type: Swing/Positional
Pure Price Action Setup: LTIMINDTREE is compressing into a textbook Symmetrical Triangle on the daily chart. This is a classic consolidation pattern where the market is building energy for a significant breakout. Volatility is collapsing into a tight apex!
Key Decision Levels:
Bullish Trigger: A decisive daily close above 5350 (the recent upper trendline resistance).
Bearish Trigger: A decisive daily
Havells breakout from symmetrical triangle patternHavells had Breakout from symmetrical triangle at the ₹1,570 descending resistance. RSI near 60, MACD recovering and moving up. Watch for volume-backed breakout.
Breakout above can fuel a move to ₹1,690–₹1,750.
Stop near ₹1,485.
🔌 Electrical sector needs confirmation for momentum entry."
Kaynes Technology is at a crucial breakout zone:
Setup: Price consolidating within a symmetrical triangle, now testing the upper trendline.
Indicators:
RSI ~58, just entering bullish zone, but not overbought.
MACD turning positive → momentum aligning with trend.
EMAs: 20 & 50 EMA aligned upward; price holding above 6,000.
Levels:
Targets: ₹6846 , ₹7,203, ₹7711
Stoploss: ₹6190
👉 Outlook: Break and sustain above ₹6,500 can trigger fresh momentum towards ₹7,000+. Support at ₹6190 is critical.
Poonawalla Fincorp showing a symmetrical triangle breakout:
Setup: Clear breakout above trendline resistance on daily chart.
Indicators:
RSI at 62 → momentum strong, near overbought but not overheated.
MACD bullish crossover with positive histogram.
EMAs: 20 & 50 EMA slope positive; price sustaining above both.
Levels:
Stoploss: ₹445
Targets: ₹509 immediate, then ₹535
👉 Outlook: Strong bullish bias. Sustaining above ₹473 opens path towards ₹500–506 zone. Support at ₹445.