SARDAEN: Triangle Breakout, Chart of the WeekWhy NSE:SARDAEN Triangle Breakout Could Signal the Next Big Move in it, let's analyze in "Chart of the Week" Post Strong Q1 FY26 Results
As per the Latest SEBI Mandate, this isn't a Trading/Investment RECOMMENDATION nor for Educational Purposes, it is just for Informational purposes only. The chart data used is 3 Months old, as Showing Live Chart Data is not allowed according to the New SEBI Mandate.
Disclaimer: "I am not a SEBI REGISTERED RESEARCH ANALYST AND INVESTMENT ADVISER."
This an
Symmetrical Triangle
BLUE STAR LTD - Technical Analysis | Triangle Pattern ________________________________________
📊 BLUE STAR LTD – Beginner-Friendly Technical & Fundamental Snapshot
Ticker: NSE:BLUESTARCO | Sector: Consumer Durables
CMP: ₹1,827.50 ▲ (+3.23%) (as of August 7, 2025)
Chart Pattern: Symmetrical Triangle
Technical View: ⭐⭐⭐⭐ Neutral-to-Positive (Educational Purpose Only)
________________________________________
🔍 What’s Happening on the Chart?
BLUE STAR has formed a Symmetrical Triangle – a pattern where price moves within narrowing highs and lows 📉📈
Thi
JSWENERGY | Symmetrical Triangle Breakout in Progress?Description:
JSW Energy is forming a symmetrical triangle on the daily chart after a downtrend — resembling a potential bearish pennant, but price structure, sloping EMAs, rising momentum, and positive EFI hint at bullish strength.
📌 Breakout Level: ₹534
📉 Stoploss: ₹519 (ATR-based)
🎯 Targets: ₹563 → ₹597 → ₹694 (as per Fib projections)
🧭 Macro Context:
- Infra & Energy sectors improving
- Govt push for renewables
- Dollar weakening, risk-on tone aiding sentiment
Structure, volume, and ma
Blackbuck = Zinka Logistics cmp 468.55 by Daily Chart view sinceBlackbuck = Zinka Logistics cmp 468.55 by Daily Chart view since listed
- Support Zone 429 to 450 Price Band
- Resistance Zone 480 to 500 Price Band
- Symmetrical Triangle Breakout been attempted
- Closely considerate VCP pattern formation seems done
- Volumes are in close sync with the average traded quantity
- Technical Indicators BB, EMA, MACD, RSI, SAR showing positive trend
ManOrg: Symmetrical Triangle Tightens – Big Move Ahead?🔎 #OnRadar
#ManOrg (Mangalam Organics Ltd.)
Symmetrical Triangle Tightens – Big Move Ahead?
CMP: 516.65
📈 Technical Outlook (Monthly Chart | For Educational Purpose Only):
#SymmetricalTriangle pattern appears to be forming on the monthly timeframe.
The price has faced repeated resistance near the falling trendline around 629 and is currently showing signs of a possible retracement towards the lower end of the triangle. The key support zone lies between 473–378 .
If this zon
Massive Symmetrical Triangle on Kakatiya Cement – Eyes on 599?🔎 #OnRadar
#Kakatcem (Kakatiya Cement Sugar & Industries Ltd.)
CMP: 166.40
📈 Technical Outlook (Monthly Chart | For Educational Purpose Only):
A #SymmetricalTriangle pattern appears to be forming on the monthly timeframe.
📌 Price took support near the rising trendline (~130) and is now showing signs of recovery. If momentum sustains, the stock may head toward the falling trendline resistance of the triangle.
A monthly close above the falling trendline could indicate a potential
MAHSEAMLES - Symmetrical Triangle Breakout📊 MAHSEAMLES – Symmetrical Triangle Breakout | RSI Bullish | Volume Surge | Daily Timeframe
📅 Chart Date: June 26, 2025
📈 CMP: ₹736.55 (+7.20%)
📍 Ticker: NSE:MAHSEAMLES
🔍 Technical Analysis Overview
🔺 Symmetrical Triangle Breakout
After months of consolidation within a symmetrical triangle pattern, MAHSEAMLES has broken out with a strong bullish candle
Breakout level: Above ₹725, confirmed with strong price momentum
Breakout marks potential trend reversal and beginning of new bullish phase
📊 V
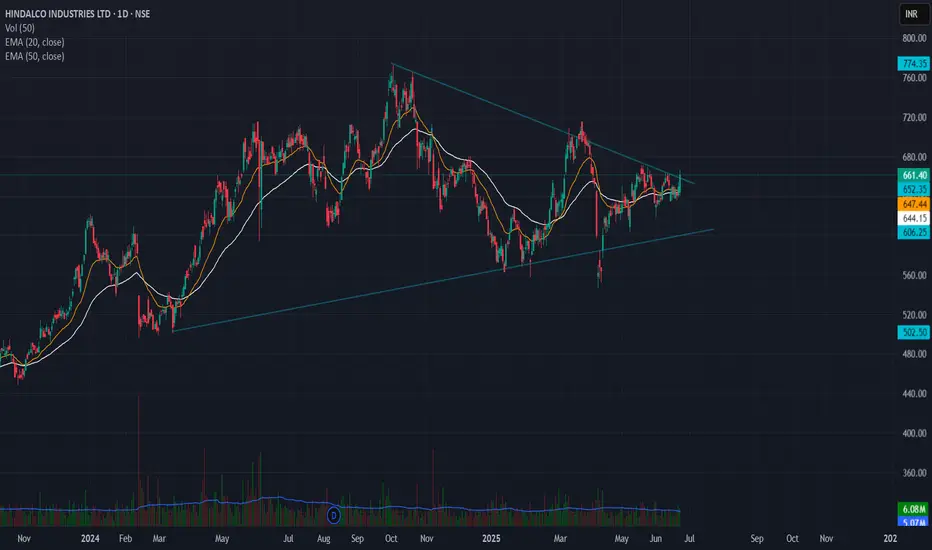
Hindalco Symmetrical Triangle breakout setup🔹 Pattern: Symmetrical Triangle
🔹 Breakout Level: ₹660
🔹 Stoploss: ₹635 (below swing low)
🔹 Target Zone: ₹850 – ₹900
🔹 Risk–Reward: 7.6 – 9.6
🔹 Timeframe: Positional (swing to medium term)
---
📊 Chart Analysis:
Hindalco has broken out of a well-defined symmetrical triangle on the daily chart, with strong price compression followed by bullish breakout confirmation.
The triangle height is ~₹200, projected from the breakout zone, giving a target range of ₹850–₹900.
🧠 Stoploss placed below the
GALLANTT |Symmetrical Triangle | Daily
### 🔍 Technical Snapshot
- **Breakout Alert**: The symmetrical triangle shows a bullish breakout above ₹488, with a strong follow-through toward ₹506.40. That breakout level was respected perfectly—classic pattern behavior.
- **Target**: The projected target of ₹580.50 looks feasible based on the height of the triangle and the breakout momentum.
- **Volume Surge**: Today's volume is a whopping 1.66M—over 10x the 5-day average—with an rVol of 1052%. That kind of participation typically supports
Ramco Cement may give break out of triangle pattern soon.Ramco Cement as per chart is trading on triangle pattern. As per indicator stock is bullish and ready for breakout. Major supply zone is 1010. After crossing this level, it may give massive move for considerable gain. It can accumulate here add more after breakout.
Aeroflex | Symmetrical triangle breakout ### 📊 **Aeroflex Industries Ltd - Technical Analysis Summary (Daily Chart)**
#### 🚀 **Breakout Overview**
* **Pattern**: Symmetrical triangle breakout (tight range → explosive move)
* **Breakout Confirmation**: Massive bullish candle (+11.45%) with **volume spike (64.98M)** — over **1200% above average**
* **Breakout Level**: \~₹174–₹176
#### 🎯 **Target Projection**
* **Height of Triangle (Approx)**: ₹31.90
* **Target Price**: ₹176 (breakout level) + ₹31.90 ≈ **₹210**
#### 📌 **Key Price Lev
Symmetrical Triangle pattern in Torrent Pharma Symmetrical Triangle Breakout Setup
Torrent Pharmaceuticals Ltd (TORNTPHARM)
Breakout Level: ₹3,300
Stop Loss: ₹3,150 (below triangle support)
Target: ₹4,000 (based on height of triangle)
Risk:Reward: ~2.8:1
✅ Technical Confirmation:
RSI near 52 — momentum shifting bullish above 55.
MACD positive crossover, rising histogram — trend strength improving.
Volume: Awaiting breakout candle with above-average volume for confirmation.
EFI (Elder Force Index) turning positive — signals potential su
Emudhra Watchlist StockEmudhra's Triangle Breakout Drama: Why This Digital Security Stock Could Rally 15% from Current Levels
Price Action:
Looking at Emudhra's daily chart, we're witnessing a textbook technical setup that could offer substantial rewards for patient traders. The stock has been consolidating in a well-defined triangle pattern since late April, with price action compressed between converging trend lines around 720-780 levels.
The current price action shows Emudhra testing the upper boundary of this
HDFCBANK | Symmetrical Triangle | Daily |Watchlist### **Technical Analysis of HDFC Bank Ltd. (NSE)**
The **daily candlestick chart** of **HDFC Bank Ltd.** highlights key technical patterns, suggesting potential bullish momentum.
### **Key Observations:**
1. **Cup and Handle Formation:**
- A well-defined **cup and handle** pattern is visible, indicating prolonged accumulation.
- Breakout above **1,960.00 INR** confirms bullish sentiment.
- **Projected Target:** **2,057.30 INR**, a **11.62% upside** from breakout.
2. **Symmetri
PAYTM | Symmetrical Triangle | Daily ### **Technical Analysis of Paytm (ONE 97 COMMUNICATIONS LTD - NSE)**
The chart highlights a **symmetrical triangle breakout**, signaling potential bullish momentum.
### **Key Observations:
**Symmetrical Triangle Formation:**
- The price oscillated between converging trendlines, forming a tightening range.
- The breakout above the upper trendline confirms bullish continuation.
**Cup and Handle Preceding the Breakout:**
- The earlier **cup and handle** pattern reinforced accumula
Multi-Month Triangle Breakout Can Signal Move to ₹750+NSE:TIPSMUSIC Made a Beautiful Chart Structure Today and Breaks Free of Multi-Month Triangle Breakout and Could Signal Explosive Move to ₹750+
Price Action Analysis:
NSE:TIPSMUSIC is currently trading at ₹676.80, up 3.68% (₹24.00) today. The stock has been consolidating in a narrowing range since January 2025, forming a classic symmetrical triangle pattern. After testing the lower support multiple times around ₹580-600, the stock is now approaching the apex of the triangle and showing si
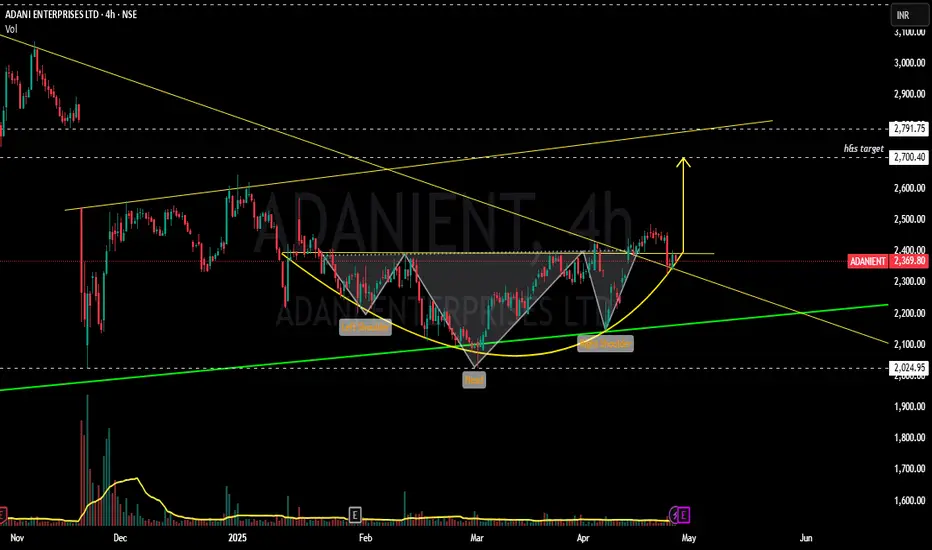
ADANIENT - Bulls getting ready to bump up ?????!!!Y essss!!! !
Chart patterns inculcating me the above titled opinion.
1. Monthly timeframe shows the symmetrical triangle pattern from 2020 till now, now the stock at support line(chart image shown below)
2. Weekly time frame shows us the INSIDE BAR candlestick pattern(mother baby pattern) with good volumes....with the low umtested till now.(made the low of 2025 on 22 nov 2024)
3. Daily time frame shows the Breakout attempt out of the 11 month old trendline.
4. Now, with the result
CITY UNION BANK - Buy above 188₹BUY BUY BUY CUB - Dont miss opportunity if 188₹ levels are broken
Ascending triangles tend to be bullish as they indicate the continuation of an upward trend. In some cases, they may point to the reversal of a downtrend. A descending triangle is bearish. That's because it points to the continuation of a downtrend or the reversal of an uptrend.
Unlocking Breakouts with the Symmetrical Triangle PatternUnderstanding the Symmetrical Triangle Chart Pattern
Hello Traders!
Today, we’ll discuss one of the most powerful chart patterns used to predict breakout opportunities — the Symmetrical Triangle . This pattern is a sign of market consolidation, where price is moving within a narrowing range, and a breakout is expected once the price escapes from this converging trend.
The Symmetrical Triangle consists of two trendlines:
Ascending Trendline : Connecting the rising lows.
Descending Tre
Paytm - CMP 950 - Monthly - Symmetrical Expanding TrianglePaytm has created Symmetrical Expanding Triangle in Monthly time frame
RSI going up continuously, still not in overbought zone
MACD is looking good
Price is above 20 Months EMA
volume is good for past 4-5 months
Crossed 930 resistance with good volume
DII has increased holding in June and Sep 2024, FII has decreased holdings
Target 1 : 1160++
Target 2 : 1350 , This could be next Resistance
if price sustain at 1350 and give breakout from triangle with good volume t