XAUUSD Weekly Outlook — Breakout Needs a Retest
Gold is sitting around 4,378 after breaking the H4 descending trendline.
The structure is improving, but price is now testing the 4,385–4,405 immediate resistance area.
The simple read
A pullback toward 4,290–4,320 would be the cleaner test for buyers.
If this zone holds, Gold may recover toward 4,400 first, followed by the major 4,485–4,510 resistance.
A clean break above 4,510 could later expose the H4 resistance around 4,630.
If 4,290 fails, the major swing support near 4,235 becomes important again.
Key price zones
4,385–4,405 — immediate resistance
4,290–4,320 — key pullback support
4,235 — major swing low
4,485–4,510 — major resistance
4,630 — H4 resistance
The trendline break is encouraging, but I prefer a retest before continuation.
Do not chase the breakout.
Wait for the zone.
Can buyers defend 4,30x and open the path toward 4,500?  Long
Long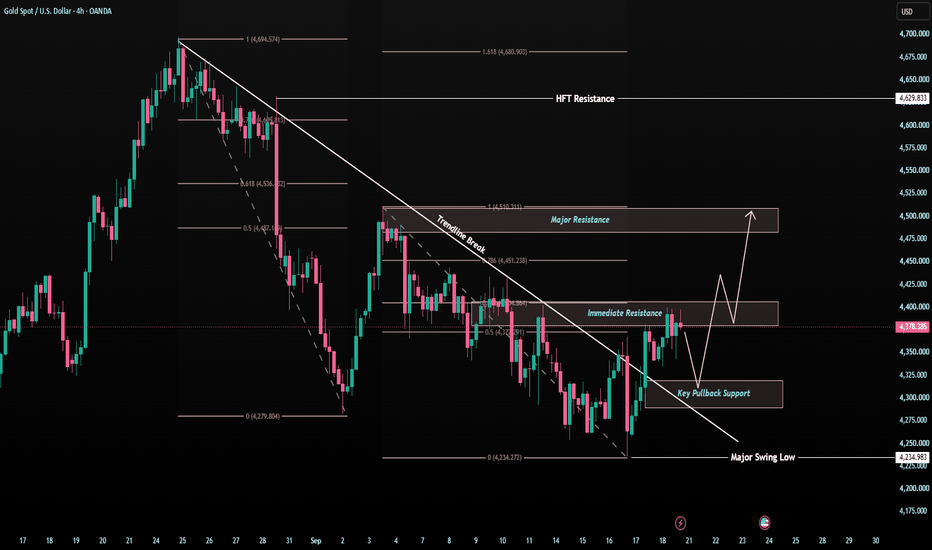
XAUUSD — Bullish Retest Toward 4,410Fundamental Analysis
Gold finishes the week on firmer footing as easing crude oil prices reduce near-term inflation pressure, helping XAUUSD recover despite the U.S. dollar remaining near a seven-week high. Gold posted its first weekly gain in four weeks, while markets now price roughly a 55% probability of another Fed hike in October after this week’s 25 bp increase.
Treasury yields have also eased from their post-Fed highs, although the U.S. 10-year remains close to the important 5% area. Next week, traders will focus on U.S. PMI data, Fed communication and whether lower energy prices can continue moderating inflation expectations.
Technical Analysis
On H1, XAUUSD is trading near 4,378 after successfully reacting from the previous 4,355–4,367 buy zone and reaching the 4,389–4,395 resistance area.
Price has printed a BOS above 4,377, while the rising support trendline continues to protect the recovery structure.
The preferred continuation area remains 4,355–4,367, where Fibonacci 0.618, previous structure and the marked buy zone converge.
If buyers defend this area again, gold may retest 4,389, followed by the key 4,410 liquidity high.
A deeper correction could reach 4,342, with the H1 FVG around 4,323–4,342 acting as secondary support.
Important Key Levels
4,410 — Main liquidity target
4,389–4,395 — Immediate resistance
4,377 — BOS / short-term pivot
4,355–4,367 — Main buy zone
4,342 — Fibonacci support
4,323–4,342 — H1 FVG
Below 4,338 — Bullish invalidation
Trading Scenario
Main Buy Setup
Entry: 4,355–4,367
Stop Loss: 4,338
Take Profit 1: 4,389
Take Profit 2: 4,400
Take Profit 3: 4,410
Buy Condition
Wait for a controlled retracement into 4,355–4,367 and bullish confirmation. A liquidity sweep, long lower wick, bullish engulfing candle or H1 reclaim above 4,367 may signal renewed buyer pressure.
A sustained H1 break below 4,338–4,342 would weaken the continuation setup.
Overall View
The H1 structure remains constructively bullish while price holds above the rising support structure. Since gold is currently near the 4,377–4,390 resistance area, chasing fresh longs offers less attractive positioning.
The preferred plan is to wait for another retracement into 4,355–4,367. If buyers defend the zone, XAUUSD could retest 4,389–4,400 and potentially attack the 4,410 liquidity high.
Will gold defend 4,355–4,367 again before breaking 4,410? Long 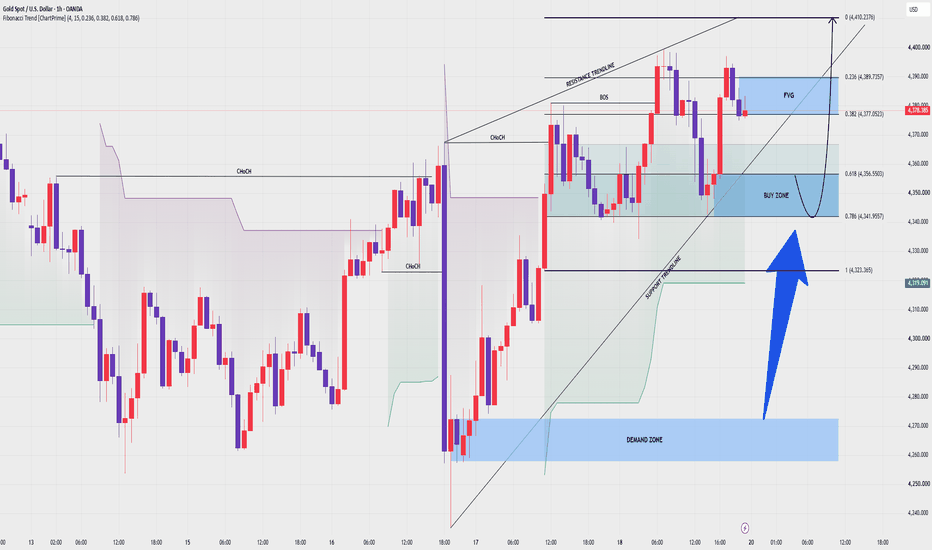
 Long
Long
 Education

Nifty 50 Weekly Analysis [21 Sep - 25 Sep, 2026]Probable Price Structure and Scenario Analysis for the Nifty 50. It is a weekly analysis (21st to 25th of September, 2026).
🟢 Bullish Scenario
Presently, there is no bullish scenario. The main trend is bearish. All the upmoves should be doubted. But there are signs of a trend reversal. There is a possibility of a "Dead Cat Bounce." If the price sustains above 23400, then weak bullish moves can be observed. The probable weak bullish targets above 23400 are - 23450 and 23500. There will be strong resistance at the 23500 level. Next, if the price breaks out above 23500, then a strong bullish move can be observed. The probable strong bullish targets above 23500 are - 23550, 23600, 23650, and 23700.
🔴 Bearish Scenario
Presently, the price is in a bearish to indecision zone. However, level 23250 might offer strong support. If the price breaks down below 23250, then stay bearish. The first target might be 23200. Level 23200 is a weak support level. Next, strong selling might be observed if the price breaks down below 23200. The probable bearish targets below 23200 are - 23150, 23100, 23050, and 23000. The zone (23050 - 23000) is a strong support zone (SSZ)/
🟡 No Trading Zone (NTZ): (23400 - 23250).
⏺ Range of Consolidation (ROC): (23500 - 23000).
Here, 23250 is the median of the ROC. The median works like a trading session sentiment evaluator. The price trading above the median would offer bullish sentiment, while the price trading below the median would trigger bearish sentiment within the ROC.
● Event
There's no high-impact event this week. There's no holiday this week. However, geopolitical issues are omnipresent and beyond our control.
● Intraday, Weekly, and Monthly Bias
Establish bias with respect to the opening price (of the particular session - Intraday, Weekly, and Monthly). If the price sustains above the opening price, then don't think of shorting. Look for bullish trades only. On the contrary, if the price sustains below the opening price, then don't think of going long. Look for bearish trades in that case.
● Disclaimer + End Note
- All the analyses would fail in the case of a major gap up, gap down, or price structure anomaly. Thus, practice PRAGMATISM in the live session.
- Trade only if there is a set-up. Remember, not trading is an extension of the trading activity.
- Mark your points. Trade your points. Price is GOD. Anything can happen in the markets. Thus, trade what you see, not what you believe.
- Always PRACTICE RISK MANAGEMENT. Always PROTECT YOUR CAPITAL. Be RESPONSIBLE.
- Be Strategic. Be Courageous. Be Patient. Be Wise.
- Every day is a new day. Thus, do not carry the baggage of past successes or failures. Leave the gardens of winning and losing. Establish yourself in equanimity. Always think from a new perspective.
- Let the joy of trading drive your effectiveness, not greed or fear. Believe in Possibilities.
Happy Trading! Education

XAUUSD — Weekly Wave 5 Lower Toward 4,060
From Kelly’s view, gold enters next week inside a broader bearish corrective structure. Price is currently trading around 4,378, after recovering from the 4,240–4,250 area, but the rebound is still developing beneath a descending channel and an important sell zone around 4,390–4,410.
The key idea is simple: the current recovery may represent a corrective Wave (4), while the main weekly scenario remains a continuation lower into Wave (5) if sellers defend the upper resistance zone.
⟡ Market structure
Gold remains inside a descending structure after the major peak near 4,680. Recent rebounds have continued to form below important resistance, while the descending channel is still controlling the broader direction.
The current recovery from around 4,240 has pushed price back toward the 4,390–4,410 sell zone, where Fibonacci resistance and the projected Wave (4) completion area overlap.
For next week, 4,334 is the first important support. A clean break below this level could confirm renewed bearish momentum and expose the 4,240–4,255 area.
If that support also fails, the larger Wave (5) projection points toward the 4,045–4,075 zone.
➤ Key levels
◌ Current price area: 4,375–4,385
◌ Main sell zone: 4,390–4,410
◌ Strong resistance: 4,410–4,430
◌ Strong support: 4,334
◌ Secondary support: 4,240–4,255
◌ First target: 4,334
◌ Second target: 4,240–4,255
◌ Main target: 4,045–4,075
◌ Invalidation: Above 4,430
⌁ Elliott Wave view
Wave (1): The first bearish leg pushed price lower from the previous recovery high.
Wave (2): Gold produced a corrective rebound before sellers regained control.
Wave (3): The stronger bearish impulse extended toward the 4,240 area.
Wave (4): The current rebound may be completing near 4,390–4,410, where the descending channel and Fibonacci resistance overlap.
Wave (5): If sellers reject this zone, the final bearish leg could develop toward 4,240 first, followed by the larger 4,045–4,075 target area.
▸ Trading scenario
Preferred bearish scenario
Entry: 4,390–4,410 after bearish confirmation
Stop Loss: Above 4,430
Take Profit 1: 4,334
Take Profit 2: 4,240–4,255
Take Profit 3: 4,045–4,075
The cleaner plan is to wait for rejection from the sell zone rather than chase price lower around current levels. A bearish reaction near 4,390–4,410, followed by a break below 4,334, would strengthen the Wave (5) scenario.
Alternative scenario:
If gold breaks above 4,410–4,430 and holds above the descending structure, the bearish Wave (5) setup may be delayed and price could extend toward the next higher resistance before sellers regain control.
◌ Invalidation
The main bearish scenario would weaken if price gains sustained acceptance above 4,410, and a confirmed break above 4,430 would invalidate the preferred Wave (5) structure for next week.
⌁ Kelly’s view
Kelly’s main view remains bearish for next week while gold stays below 4,390–4,430.
The current rebound may still have room to test the sell zone, but the broader structure favors another bearish leg if sellers defend resistance. 4,334 is the first confirmation level, while 4,240–4,255 remains the next major support before the larger 4,045–4,075 Wave (5) target comes into focus.
Do you think gold will reject the 4,390–4,410 sell zone first, or break 4,334 directly next week? Short 
Education

XAUUSD — Bullish Pullback Toward H1 SupportMarket Pulse
Gold ended the week on firmer footing, helped by easing oil prices that reduced some inflation pressure. The metal posted its first weekly gain in four weeks. However, the U.S. dollar remains firm and markets still see roughly a 55% chance of another Fed hike in October, so the macro picture is supportive but not fully bullish.
What the Chart Says
XAUUSD still shows a constructive H1 recovery after the strong rebound from the lower demand area.
Price reached the 4,390–4,400 region, then started to pull back. This is normal after the recent bullish expansion.
The main area I am watching is 4,325–4,345. This zone combines previous structure, Fibonacci support and the rising trend area.
If buyers defend this zone, Gold could build another higher low and recover toward the recent highs.
The first upside test remains around 4,390–4,400. A clean breakout above this resistance could open the way for a stronger continuation.
Levels That Matter
4,398–4,410 — Main resistance
4,370–4,380 — Current structure
4,325–4,345 — Main pullback / support zone
4,235–4,245 — Major demand zone
My Main Plan
The main plan remains bullish.
I prefer waiting for a controlled pullback toward 4,325–4,345 instead of chasing price near the highs.
If buyers return with clear confirmation, Gold could recover toward 4,390–4,400 again.
What I Need to See
I want the pullback to hold above the main support zone and form another higher low.
A sustained H1 break below 4,325 would weaken the immediate bullish continuation setup.
Final Read
The H1 recovery remains constructive, but Gold is still trading below an important resistance area.
For now, I prefer waiting for the pullback and bullish confirmation before following the next move higher. Long 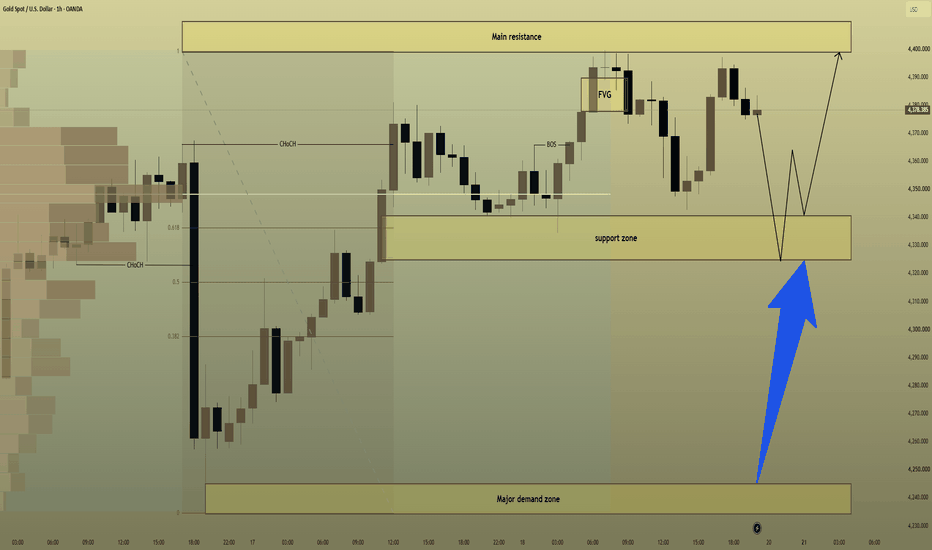
H1 Major Supply Rejection Toward Lower Liquidity
XAUUSD is trading around 4,378 after extending its recovery from the lower H1 structure. Price has returned directly into the 4,385–4,405 Major Supply Zone, where the broader bearish trendline also remains relevant.
Gold reached a one-week high on Friday as easing crude oil prices reduced part of the inflation pressure that had dominated markets earlier in the week. Spot gold climbed about 1.2%, while softer energy prices helped Treasury yields retreat from their recent highs.
However, the broader macro backdrop remains restrictive. The Fed has raised rates to 3.75%–4.00% and still expects further tightening, while markets currently price roughly a 55% probability of another hike in October. The dollar also remains near a seven-week high, and the U.S. 10-year yield has recently traded above 5%, limiting the strength of gold’s recovery.
Technical View
The H1 recovery has improved after the recent MSS and rebound from lower demand, but price is now entering the main decision area.
The 4,385–4,405 Major Supply Zone aligns with the previous bearish trendline and recent swing structure. This makes the current area less attractive for chasing longs.
A rejection or failed acceptance above this supply could trigger a corrective move back toward the 4,335–4,350 Demand Zone.
If that demand fails to absorb selling pressure, the larger downside objective sits around 4,270–4,290, where the marked downside target and previous liquidity structure align.
Below that, the 4,235–4,250 Major Demand / SSL Zone remains the deeper structural support.
Key Zones
Current Price: 4,378.385
Major Supply / Sell Area: 4,385–4,405
Demand Zone: 4,335–4,350
Downside Target: 4,270–4,290
Major Demand / SSL: 4,235–4,250
Bearish invalidation: sustained H1 acceptance above 4,410–4,420
Trading Plan
Sell Priority: 4,385–4,405
Condition: wait for price to retest Major Supply and show bearish rejection, liquidity sweep, failed acceptance or lower-high confirmation.
TP1: 4,335–4,350
TP2: 4,270–4,290
TP3: 4,235–4,250
Invalidation: sustained H1 acceptance above 4,420.
Sell View
The cleaner approach is to avoid selling aggressively below current price after the recent recovery.
I prefer to let gold test 4,385–4,405 first. If sellers clearly defend the zone, the risk/reward improves for a rotation back toward demand.
A clean H1 breakout and acceptance above 4,420 would weaken the immediate bearish scenario and require reassessment.
Important Note
Lower oil prices are helping gold recover in the short term, but the Fed’s renewed tightening cycle, a strong dollar and elevated Treasury yields remain important headwinds. This creates a two-sided environment where liquidity sweeps around resistance may be aggressive.
Final View
Gold has recovered strongly, but H1 is now testing a key supply area rather than trading from clean demand.
The main scenario is a retest and rejection from 4,385–4,405, followed by a move toward 4,335–4,350 first and potentially 4,270–4,290 if bearish momentum expands.
Will H1 Major Supply stop the recovery before gold rotates back toward lower liquidity? Short 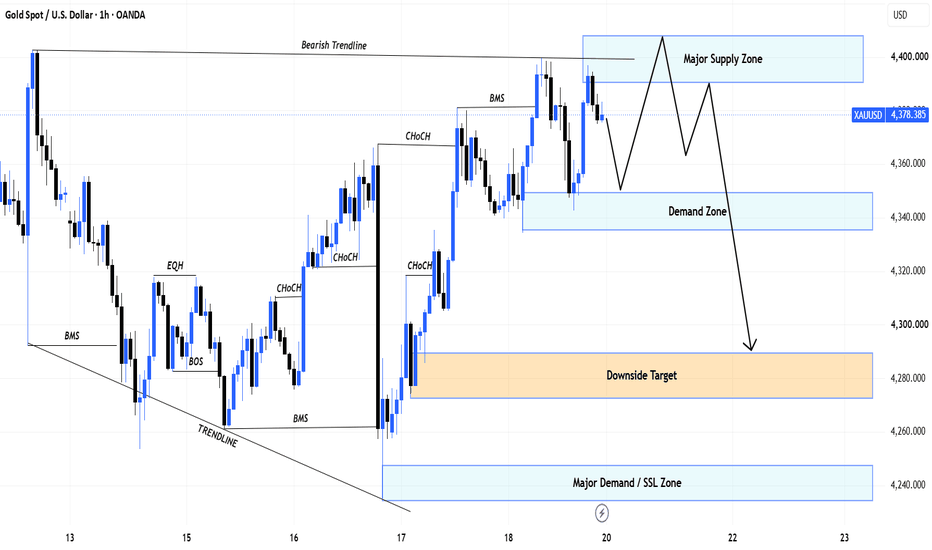
 Education



Global Financial MarketsGlobal financial markets are systems where people, companies, and governments buy and sell financial assets across the world. They help move money from those who have extra funds to those who need funds.
Main Types of Global Financial Markets:
Stock Markets – Buying and selling shares of companies (e.g., NYSE, NSE).
Bond Markets – Governments and companies borrow money by issuing bonds.
Foreign Exchange (Forex) Markets – Trading currencies like USD, EUR, INR.
Commodity Markets – Trading gold, oil, wheat, etc.
Money Markets – Short-term borrowing and lending.
Derivatives Markets – Contracts based on assets like stocks or currencies.
Importance:
Provide funds for business growth
Support international trade
Create investment opportunities
Help manage financial risks
Affect global economies
Example:
If the US stock market falls sharply, markets in Asia and Europe may also be affected because markets are connected globally.
 Education

BSL Rejection Opens Corrective Move
Fundamental Analysis
Gold remains supported by softer oil prices and easing Treasury yields after the Fed’s latest rate hike. However, the Fed has signaled that further tightening is still possible, so Gold may remain sensitive to changes in yields, the dollar and energy prices.
Technical Analysis
On H1, Gold confirmed a bullish BOS and pushed into the 4,390–4,405 BSL, where price is now showing rejection.
This makes a short-term correction more likely. The first support sits around 4,350–4,367 OB + Fibo. If sellers break this zone, price could extend toward the 4,300–4,318 POC.
Important Key Levels
4,390–4,405 — BSL / Major Resistance
4,350–4,367 — OB + Fibo
4,300–4,318 — POC
4,235–4,250 — SSL / Major Support
Trading Scenario
Sell priority remains after rejection from 4,390–4,405.
Target: 4,350–4,367 first, then 4,300–4,318 if support fails.
Invalidation: H1 acceptance above 4,405.
Overall View
Gold has reached major upper liquidity after a strong recovery. The cleaner setup now is to watch for a corrective move toward lower support rather than chase buys near resistance.
Will Gold hold the OB + Fibo, or correct deeper toward the POC? Short 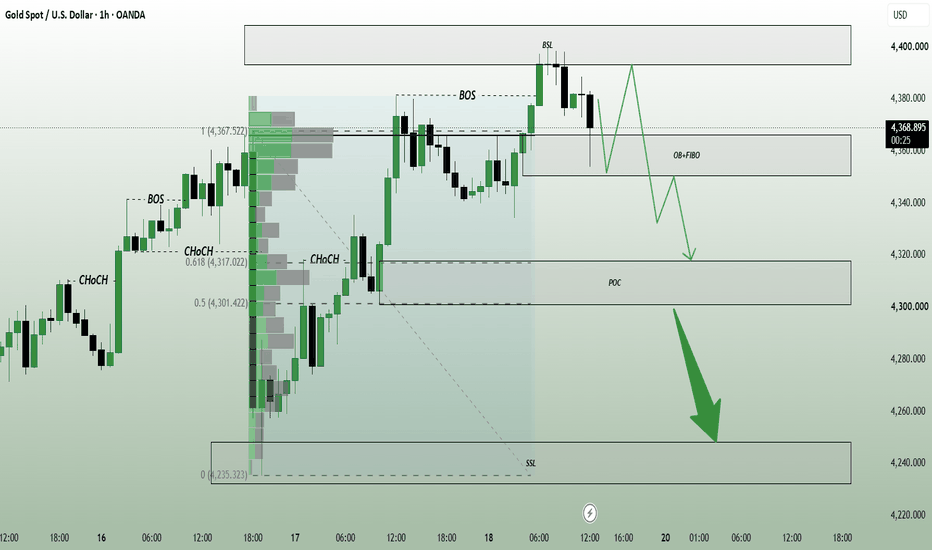
Education

Gold: Possibility of Channel Breakout [Plan 18.09.2026: Fri]Probable Scenario Analysis:
⏺ Present Scenario:
Gold (XAUUSD) has been trading inside the downward-sloping channel for a long time. The price has been extremely volatile. Taking the support base at 4250, Gold OANDA:XAUUSD is now showing signs of reversal (from bearish to bullish). There is a high probability of a breakout from the channel. Probably, channel compression is over.
🟢 Bullish Scenario
Be bullish if the price decisively sustains above 4375. The probable bullish targets above 4375 are - 4405.25 and 4437.5. Strong resistance is at 4437.5.
🔴 Bearish Scenario
Be bearish if the price decisively trades below 4312.5. The probable bearish targets below 4312.5 are - 4482.25 and 4250. There is a strong support zone (SSZ) in the region (4482.25 - 4250).
🟡 No Trading Zone: (4375 - 4312.5).
⏺ Range of Consolidation (ROC): (4375 - 4250).
Here, 4312.5 is the median of the ROC. The median works like a trading session sentiment evaluator. The price trading above the median would offer bullish sentiment, while the price trading below the median would trigger bearish sentiment within the ROC.
● Events:
- 14 Sep (Mon): No events.
- 15 Sep (Tue): ADP Weekly Employment Change (05:45 PM IST, 🔵 Low Impact).
- 16 Sep (Wed): Core Retail Sales m/m (06:00 PM IST, 🟠 Medium Impact). Federal Funds Rate, FOMC Economic Projections, and FOMC Statement (11:30 PM IST, 🔴 High Impact).
- 17 Sep (Thu): Philly Fed Manufacturing Index (06:00 PM IST, 🟠 Medium Impact). Pending Home Sales m/m (07:30 PM IST, 🔵 Low Impact).
- 18 Sep (Fri): Capacity Utilization Rate (06:45 PM IST, 🔵 Low Impact). FOMC Member Bowman Speaks (07:00 PM IST, 🔵 Low Impact). FOMC Member Schmid Speaks (09:15 PM IST, 🔵 Low Impact).
● Intraday, Weekly, and Monthly Bias
Establish bias with respect to the opening price (of the particular session - Intraday, Weekly, and Monthly). If the price sustains above the opening price, then don't think of shorting. Look for bullish trades only. On the contrary, if the price sustains below the opening price, then don't think of going long. Look for bearish trades in that case.
● Disclaimer + End Note
- All the analyses would fail in the case of a major gap up, gap down, or price structure anomaly. Thus, practice PRAGMATISM in the live session.
- Trade only if there is a set-up. Remember, not trading is an extension of the trading activity.
- Mark your points. Trade your points. Price is GOD. Anything can happen in the markets. Thus, trade what you see, not what you believe.
- Always PRACTICE RISK MANAGEMENT. Always PROTECT YOUR CAPITAL. Be RESPONSIBLE.
- Be Strategic. Be Courageous. Be Patient. Be Wise.
- Every day is a new day. Thus, do not carry the baggage of past successes or failures. Leave the gardens of winning and losing. Establish yourself in equanimity. Always think from a new perspective.
- Let the joy of trading drive your effectiveness, not greed or fear. Believe in Possibilities.
Happy Trading! XAUUSD — 4,290 Retest Before the Next Push?
Gold is trading around 4,317 after a strong post-Fed recovery.
M30 structure is improving, but price is still sitting inside a near-term decision area.
A bounce is not enough.
The pullback will tell us more.
The simple read
The key zone today is 4,285–4,298.
If buyers defend this pullback area, Gold may recover toward 4,335 first, then challenge the major resistance around 4,357–4,367.
A clean breakout above that zone could open the way toward 4,396–4,399.
If 4,285 fails, the 4,277 OB becomes the next support.
Key price zones
4,285–4,298 — key pullback zone
4,277 — OB support
4,357–4,367 — major resistance
4,396–4,399 — upper target
4,236–4,245 — major support
The recovery structure is improving, but I prefer the pullback rather than chasing price.
Can 4,290 hold and send Gold toward 4,36x? Long 
Long 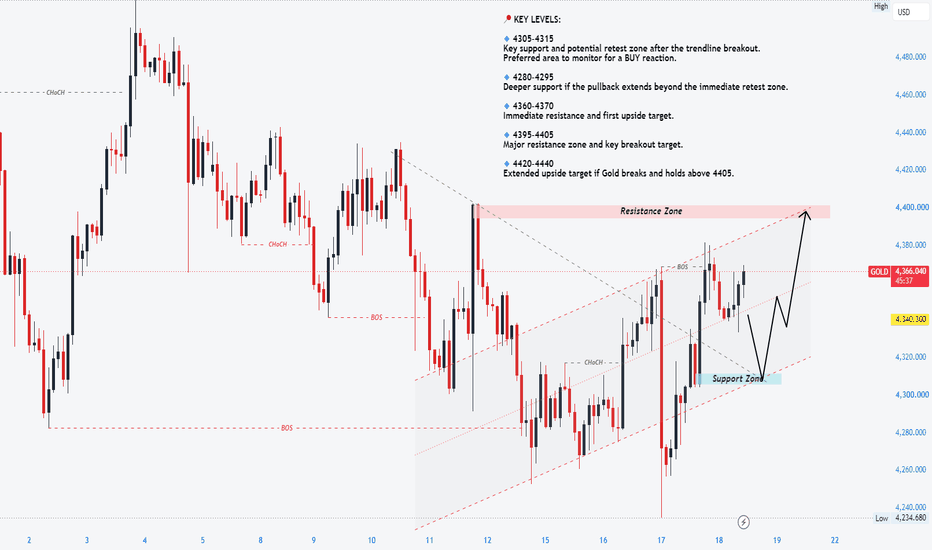
XAUUSD — Post-Fed Bullish RecoveryMarket Pulse
Gold is recovering strongly after the Fed raised rates by 25 bp to 3.75%–4.00%. The Fed still sees room for another hike this year, which keeps the medium-term rate backdrop restrictive. However, Gold has gained more than 1% today as the U.S. dollar eased from a seven-week high and oil prices moved lower.
Short-term Treasury yields remain elevated, so the recovery may stay volatile even if buyers keep control.
What the Chart Says
XAUUSD has made a strong bullish recovery on H1 after the sharp Fed-driven sweep toward the 4,260 area.
Price reclaimed 4,300, pushed through the 4,330–4,345 zone, and has now broken above the previous CHoCH around 4,365.
That shift shows buyers have regained short-term control.
Gold is currently trading near 4,370, so chasing the move higher is less attractive. A controlled pullback could give a cleaner continuation setup.
The first area I am watching is 4,330–4,345. If buyers defend this zone, price may continue toward the upper 4,388–4,398 resistance area.
A deeper correction could reach 4,295–4,305, which remains the stronger demand zone below.
Levels That Matter
4,388–4,398 — Main resistance
4,365–4,370 — Breakout structure
4,330–4,345 — First support / retest zone
4,295–4,305 — Main demand zone
4,260–4,270 — Post-Fed swing low
My Main Plan
The main plan is bullish.
I prefer waiting for a pullback toward 4,330–4,345 rather than buying after the current expansion.
If this zone holds and bullish confirmation appears, Gold could continue toward 4,388–4,398.
A deeper pullback toward 4,295–4,305 could still keep the recovery structure valid if buyers return there.
What I Need to See
I want price to hold above the reclaimed structure and continue forming higher lows.
A sustained H1 move below 4,295 would weaken the immediate bullish recovery idea and increase the risk of another deeper correction.
Final Read
The H1 picture has improved sharply after the post-Fed liquidity sweep.
For now, buyers have the short-term advantage, but Gold is already extended from the lows. I prefer waiting for the pullback and bullish confirmation rather than chasing price near resistance. Long 
SRF Bulls Are Back! 2500 CE trade Momentum Trade Setup!Hello guy's let's focus on an options buying trade in SRF, as it has finally started showing some real momentum after spending days in a weak structure.
The important part is that price has moved above the short-term resistance with strong volume, while the 9/21 EMA structure is turning bullish.
TRADE SETUP 👇
Underlying: SRF
Timeframe: 15 Min
Entry: Around 2,532
Target: 2,590
Invalidation: Below 2,502
Option: SRF 2500 CE strike
Option Entry: Around 62-63
Keep stop loss at 45, and hold for the target of 71/80/90++
WHY I LIKE THIS SETUP
Breakout from the short term resistance zone
9/21 EMA showing bullish momentum
Strong volume expansion during the move
RSI has moved back above 60, showing buyers are active
Underlying price is holding above the breakout area
The main level I am watching now is 2,530 .
If SRF sustains above this level, the next move towards 2,590 can come into focus.
For the exact levels and structure, watch the chart above.
Risk Management is important. If the underlying loses 2,502, the setup gets invalidated.
Disclaimer: This is my personal market view for educational purposes only. Please do your own research before taking any investment or trading decision. Technical levels can fail and markets involve risk.
By— @TraderRahulPal
 Long
Long


