BSE at a Crucial Fibonacci Support: Bullish Reversal LoadingBSE Ltd. is currently trading near a critical technical support zone after undergoing a healthy correction from its recent high. The stock has retraced toward the 61.8% Fibonacci level around ₹3,276, a widely watched retracement zone, where buyers are showing signs of renewed interest.
The recent price action has formed a Hammer candlestick pattern around the 61.8% Fibonacci support, while the broader structure continues to remain supported by the long-term 200 EMA. This combination makes the current zone technically important and provides a potential setup for a bullish reversal.
🟢 Bullish Scenario
If BSE continues to hold the ₹3,220–₹3,275 support area and starts moving higher, the first important hurdle is around ₹3,500. A sustained move above this level could strengthen the recovery and open the way toward ₹3,715.
Above ₹3,715, the next major objective comes near ₹4,000, followed by the larger projected target around ₹4,440. The Fibonacci structure and previous price expansion suggest that a successful reversal from the current zone could potentially develop into another strong upward move.
🔴 Bearish Scenario
The bullish setup is dependent on the stock holding its key support. A decisive breakdown below ₹3,220 would weaken the reversal setup and indicate that sellers are gaining control. In that case, the stock could move toward the lower dynamic support zone around the 200 EMA, making risk management important for any long position.
Overall: BSE is sitting at a technically important Fibonacci support with a Hammer formation and 200 EMA support nearby. If buyers defend this zone and momentum returns, the stock could begin a fresh recovery toward the projected targets.  Long
Long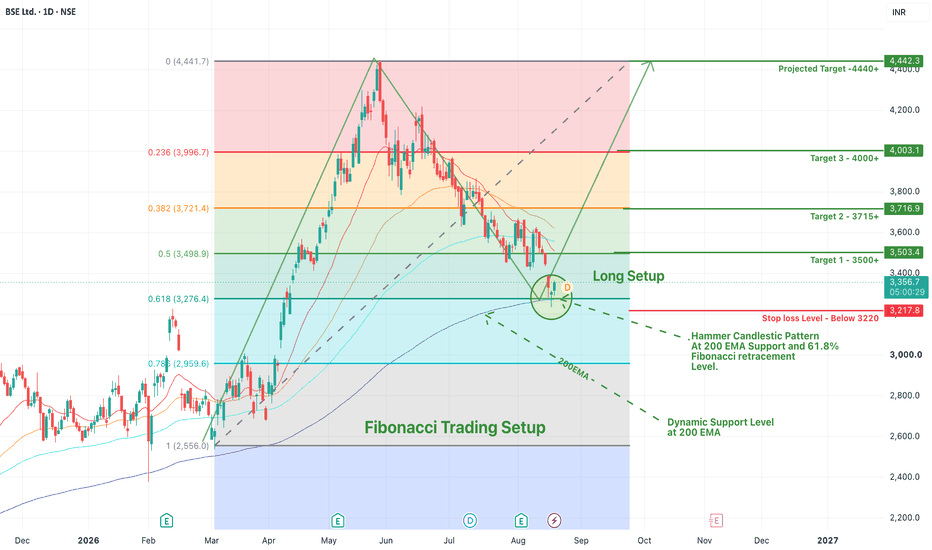
#NIFTY Intraday Support and Resistance Levels - 19/08/2026Nifty 50 is expected to open flat, with the index currently around 24,155 and continuing to trade within a consolidation zone. The immediate resistance is placed near 24,200–24,250, while 24,050 remains the important support level.
On the buying side, if Nifty sustains above 24,250, buying can be considered for targets of 24,350, 24,400 and 24,450+. A decisive move above 24,450 can further strengthen the bullish momentum.
On the selling side, if Nifty breaks and sustains below 24,200, selling can be considered for targets of 24,150, 24,100 and 24,050. A sustained breakdown below 24,050 may lead to further weakness.
Overall, with a flat opening and continued consolidation, traders should avoid aggressive positions inside the range and wait for a clear breakout above 24,250 or breakdown below 24,200 for directional trades. #BANKNIFTY Intraday PE & CE Levels(19/08/2026)Bank Nifty is expected to open flat, with no major gap-up or gap-down movement. The index is currently trading around 57,260, keeping the market in a relatively cautious zone. Immediate resistance is placed around 57,450–57,550, while 57,050 remains an important support level.
On the bullish side, if Bank Nifty sustains above 57,550, buying can be considered for targets of 57,750, 57,850 and 57,950+. A sustained move above 57,950 can bring stronger upside momentum.
On the bearish side, if the index breaks below 57,400, selling can be considered with targets of 57,250, 57,150 and 57,050. If 57,050 breaks decisively, further downside towards 56,950 and 56,550 can be expected.
Overall, with a flat opening, traders should watch the 57,400–57,550 zone closely. Since the index has been moving within a range, avoid aggressive trades inside the consolidation and prefer buying or selling only after a clear breakout or breakdown. Bitcoin (BTC): Bearish Sweep Into Supply Zone — Setup for ?Market Context & Technical Overview:
Pair: BTC/USD (1-Hour Chart, Bitstamp)
Current Price: ~$64,732
Bitcoin has recently expanded upward following a accumulation range ($62,800 – $63,100) and a clear Market Shift Structure (MSS). Price pushed strongly through previous structure points to reach the critical Supply Zone located between $64,800 – $65,250.
Trade Plan & Key Technical Elements:
Supply Zone Reaction: Price is currently tapping into strong overhead supply/liquidity around $65,000.
Bearish Setup: Anticipating a rejection from this supply block as buyers exhaust momentum near key resistance.
Primary Target (TP1): $64,000 (Recent swing low/local demand)
Secondary Target (TP2): $63,500 (Prior breakout level/liquidity pool)
Execution Guidelines:
Trigger: Look for lower-timeframe (5m/15m) Market Structure Shifts (MSS) or strong bearish engulfing candles inside the Supply Zone before taking entry.
Invalidation / Stop Loss: A sustained 1-Hour candle close above $65,300 invalidates the bearish bias.  Short
Short
XAUUSD (Gold): Bearish Setup off H4-OB & FVG RetestTechnical Analysis & Key Structure Points:
Resistance Zone: Price reached a higher-timeframe resistance cluster comprising a 4-Hour Order Block (H4-OB) (~4,410–4,430) and a 4-Hour Fair Value Gap (H4-FVG) (~4,405–4,412).
Liquidity & Market Structure:
Liquidity Sweep (Liq Sweep): Recent highs cleared resting buy-side liquidity before rejecting downwards.
Equal Highs (EQH): Internal liquidity pools were formed and tested around 4,400.
Market Structure Shift (MSS) / BOS: The chart shows a strong displacement downwards following the sweep, confirming institutional supply overhead.
Trade Plan:
Entry Strategy: Look for a pullback/retest into the lower boundary of the H4-FVG / H4-OB zone (~4,400–4,410 level) for a short entry.
Invalidation (Stop Loss): Above the top of the H4-OB (~4,432+).
Take Profit (Target): The sell-side liquidity pool and local support low marked as TARGET (~4,365–4,370 region).  Short
Short
Short 
Bitcoin 1H: SMC Setup — Retest of Demand Zone for Target $64,000BTCUSD (1H) — Bullish Retest & Expansion Setup
Bitcoin has broken out of its tight consolidation range ($62,900–$63,150) with strong bullish momentum following the market structure shift (MSS) and liquidity sweep at lower levels.
Key Technical Factors:
Market Structure Shift (MSS): Price shifted structure after sweeping liquidity at the $62,400 low.
Range Breakout: Strong displacement candles broke above the consolidation range, leaving behind a clear Demand Zone ($62,700 – $63,100).
Primary Plan: Expecting a corrective pullback into the Demand Zone to mitigate order blocks and absorb sell-side liquidity before the next leg up.
Trading Plan & Targets:
Entry Area: $62,700 – $63,100 (Demand Zone)
Target 1: $63,950 (Previous High / Liquidity Pool)
Target 2: $64,400 (Major Resistance / Swing Target)
Invalidation: Clean break below $62,600
Manage your risk accordingly and wait for lower timeframe confirmations inside the demand zone. Long 
 Long
Long
Part 3: The Quietest Candle Can Tell You the MostAn unusually small candle after a period of expansion can be more informative than a dramatic breakout candle. The reason is simple: price has moved, but participation has suddenly gone quiet.
When a market expands strongly, traders become emotionally involved. New buyers chase the move, existing holders become confident, and late participants enter because they fear missing out. Candle ranges tend to widen because opinions are widely dispersed. Then, sometimes, something strange happens. Price remains elevated, but the candle becomes unusually small.
That compression can tell you that the market has reached a temporary point of agreement. Buyers are no longer willing to push aggressively higher, but sellers have not yet gained enough confidence to drive price down. The result is a narrow candle sitting inside or near the upper portion of the previous expansion. This is where positioning becomes interesting.
A quiet candle after expansion is not automatically bearish . It can represent accumulation, absorption, exhaustion, or simple hesitation. The important information comes from its location and what happens next. Consider a strong upward expansion followed by several small candles near the high. If price refuses to give back much of the previous advance, that tells you something different from a market that immediately collapses into the middle of the expansion candle.
The first situation suggests that sellers are appearing, but they are not yet strong enough to force a meaningful retracement. The second suggests that the expansion may have attracted buyers who are now trapped. So the small candle itself is not the signal. The market's inability or ability to move away from it is the signal.
This is why unusually small candles can reveal positioning. A large candle tells you that something happened. A very small candle immediately afterward can tell you what participants are doing with the result . Are they defending higher prices? Are they refusing to chase? Are they taking profits? Are new buyers absorbing the selling? Or is the market simply waiting for another catalyst?
These questions become especially useful when the small candle appears after an obvious expansion at a meaningful level. For example, expansion, tiny candle near the high, price holds, breakout attempt can indicate that sellers tried to respond but failed to create enough downside. Compare that with expansion, tiny candle near the high, price breaks below it, previous range is quickly reclaimed . Now the interpretation changes. The small candle may have represented a pause before distribution rather than continued strength.
The lesson is subtle: Do not judge a candle only by its size. Judge what the market does after the size changes. The quietest candle often deserves the most attention precisely because it tells you that the aggressive phase has temporarily ended. Expansion shows urgency. Compression shows agreement or uncertainty. The next displacement tells you which one it was.
By @BrightRally_Research Education 
Long 
 Education

 Education

Trading Masterclass #1Institutional trading means trading like hedge funds, banks, prop firms, and professional desks. They do not trade based on emotions, random tips, or gambling. They use systems, probabilities, risk control, position sizing, discipline, and psychology.
Retail traders often lose because they focus only on “entry.” Institutions focus on:
Risk Management
Capital Protection
Position Sizing
Probability
Psychology
Consistency
Repeatable Edge
In options trading, if you think like institutions, your results can improve significantly Education

Education

 Education

Long 
 Education

Education

Long 
IFCI: Stage 2 Momentum ContinuationMarket Context
IFCI has emerged from a prolonged multi-year structural base into an established Stage 2 mark-up phase. Following a sharp initial advance and subsequent contraction, price formed a symmetrical pennant consolidation that successfully absorbed overhead supply above the rising primary weekly moving average.
What the Chart Is Showing
Primary Trend: Price is sustaining above the upward-sloping 30-week SMA (~₹65.90), confirming sustained institutional accumulation.
Pattern & Structure: A clear multi-week volatility contraction pattern (pennant) has broken out to the upside and is testing the critical multi-year horizontal resistance shelf near ₹80.00.
Relative Strength (RS-26): RS is holding firmly in positive territory (+0.27) and curling higher, confirming that the asset is outperforming the benchmark index.
Volume Dynamics: High volume expansion on breakout rallies contrasted with significant volume dry-up during consolidation pullbacks.
Momentum Shift: Following a weekly HA Doji at the support shelf, price action is building a decisive weekly Heikin-Ashi Green Bar (HAGB).
Why This Setup Is Interesting
Multi-Year Supply Absorption: Clearing and sustaining above the historical horizontal barrier (~₹80.00) shifts long-term structural resistance into structural support.
Volume Signature: The asymmetric volume signature (accumulation on advances, supply dry-up on pullbacks) signals low selling pressure at higher valuations.
Trend & Moving Average Alignment: The upward trajectory of the weekly SMA provides dynamic trailing support, reducing immediate overhead drag.
Key Levels to Watch
Primary Resistance / Breakout Pivot: ₹80.00 – ₹82.00
Immediate Base Support Zone: ₹74.00 – ₹76.00
Key Trend Defense Level (30-Week SMA): ₹65.90
Confirmation Criteria
A decisive weekly close above ₹80.50 accompanied by an established Heikin-Ashi Green Bar (HAGB).
Continued upward expansion of the RS-26 line into positive territory.
Invalidation Criteria
A weekly close back below the consolidation shelf at ₹74.00, or a break below the primary rising moving average at ₹65.90, which would indicate a failed breakout and return to Stage 1/consolidation range.
Risk Consideration
High-beta mid/small-cap volatility can cause sharp intra-week wicks. Entering prematurely before the weekly candle confirmation carries false-breakout risk.
Educational Takeaway
In Stan Weinstein Stage 2 setups, the highest-probability continuation entries occur when a stock pauses after an initial breakout, dries up volume during a tight base/pennant, and resumes momentum with positive Relative Strength.
Thesis: Stage 2 continuation retest with symmetrical triangle breakout holding above a rising weekly SMA and positive RS.
Bullish Trigger: Weekly candle & HAGB close above ₹80.50.
Invalidation Trigger: Weekly close below ₹74.00.
Main Risk: Volatility whipsaw prior to weekly close.
Setup Type: Stage 2 Continuation / Pennant Breakout.
 Long
Long