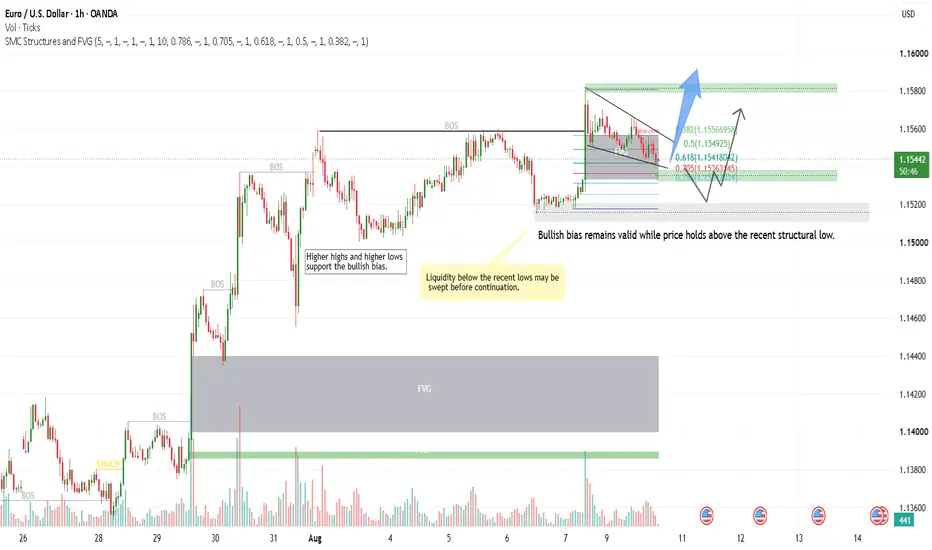
 Long
Long
#NIFTY Intraday Support and Resistance Levels - 17/08/2026Nifty is expected to open flat, with the index likely to continue consolidating within the current range. The immediate resistance is around 24,450–24,550, while 24,250 remains the key support level. The overall structure is still range-bound, so traders should wait for a decisive move before taking aggressive positions.
On the bullish side, if Nifty sustains above 24,550, buying can be considered with targets of 24,650, 24,700 and 24,750+. A sustained move above 24,750 can further improve the bullish momentum.
On the bearish side, if Nifty breaks and sustains below 24,450, selling can be considered with targets of 24,350, 24,300 and 24,250. A decisive break below 24,250 may indicate further weakness.
Overall, Nifty is expected to start flat and remain in consolidation initially. The 24,450–24,550 zone will be crucial for the next directional move, while traders should avoid aggressive trades inside the consolidation range and wait for confirmation. #BANKNIFTY Intraday PE & CE Levels(17/08/2026)Bank Nifty is expected to open flat, with the index likely to continue its consolidation within the 57450–57600 range. The immediate support is placed around 57450, while 57550–57600 is acting as an important resistance zone. Since the index has been moving sideways near these levels, traders should wait for a decisive breakout or breakdown before taking a directional position.
On the bullish side, if Bank Nifty sustains above 57600, buying can be considered for targets of 57750, 57850 and 57950+. A sustained move above 57950 can further strengthen the upside momentum toward the next resistance near 58050.
On the bearish side, if Bank Nifty breaks and sustains below 57450, selling can be considered with targets of 57250, 57150 and 57050. A break below 57050 could bring further weakness.
Overall, the opening is expected to remain flat, and the index may continue range-bound movement initially. Traders should avoid aggressive positions inside the consolidation range and wait for confirmation above 57600 or below 57450 for a clearer directional move. HINDUSTAN UNILEVER — Testing Triangle Support, Bullish SetupOverview
Hindustan Unilever is trading at 2,077, down 0.72%, now testing the lower boundary of its 2-year symmetrical triangle. This is the same triangle covered in our earlier post, where price was watching the upper resistance zone; instead, price has drifted down and is now testing support at the opposite end of the same structure.
Pattern Explanation
The triangle's upper resistance line connects the October 2024 high (2,988) down through the September 2025 secondary high, converging toward the lower support line, which connects a series of rising lows since late 2024. Price is now testing this lower support again near current levels, trading below the 200 EMA (2,238.5), reflecting the recent weakness. This support zone has held on prior tests and remains the key level for a bullish reversal setup.
Trade Setup
Entry: Buy near current levels (2,070–2,090), on strength off triangle support
Stop Loss / Invalidation: Close below 2,000
Target 1: 2,175
Target 2: 2,238.5 (200 EMA)
Target 3: 2,325
Target 4: 2,408
Target 5: 2,480 (Triangle Upper Resistance)
Key Levels
Triangle Support / Entry Zone: 2,000–2,090
Invalidation: Close below 2,000
Target 1: 2,175
Target 2: 2,238.5
Target 3: 2,325
Target 4: 2,408
Target 5: 2,480
Beginner's Lesson
In a symmetrical triangle, support and resistance testing can happen many times before the eventual breakout. A stock testing the lower boundary isn't necessarily bearish, it's simply price checking whether buyers will defend that zone again, just as it earlier tested the upper boundary and pulled back. Watching how price reacts right at this support, rather than assuming which way the triangle eventually breaks, is the key skill here.
Conclusion
HINDUNILVR is testing important triangle support, with the invalidation clearly marked below 2,000. A bounce from here with strength would support a bullish case through a staged target ladder up to the 2,480 zone. A close below 2,000 would invalidate this setup and suggest a deeper breakdown.
This is for educational purposes only and not investment advice. Please do your own research or consult a financial advisor before making any trading decisions.  Long
Long
The Chart That Broke Every Rule: A Warning About ChasingAll price action, candlesticks and levels shown in this chart are historical and older than three months. This post is purely educational and observational in nature and does not name or promote any specific stock. It is not a forecast or a trading recommendation.
🟢 Seven Years of Consolidation, Then a Breakout Nobody Should Have Trusted
The chart in front of us shows a stock that spent seven years in consolidation before finally producing a breakout candle above that entire zone. On paper, this looked like a textbook horizontal breakout. In practice, this is exactly the type of setup that should be approached with caution.
🟢Horizontal breakouts and all time high breakouts carry poor probability in the majority of cases. Most of the time, they convert into fakeouts.
This chart is one of those rare exceptions. Not only did the breakout hold, the stock delivered a 644% return from that zone.
🟢 Why This Chart Is Dangerous to Learn From ❌
This is precisely where many traders go wrong. They take a single exceptional outcome like this and turn it into their mental template for every future horizontal breakout they see. The brutal truth of trading is that one stock's history does not repeat itself on another stock. Every stock builds its own structure, its own levels, and its own behaviour.
🟢 What Happened Next ✅
After that extended rally, the stock corrected sharply, falling around 60% and forming a sequence of lower highs and lower lows before eventually finding a base and breaking out again. This is where a technically sound entry point could be identified, a higher low forming inside a two to three year retracement zone. Even here, valuation was already stretched, but at least price itself was lower and the technical structure was more defined.
From that base, the stock rallied again, first tapping into a nearby supply zone, then extending well beyond it. Using Fibonacci extensions in hindsight, the stock breached both the 127% and 161.8% extension levels, levels that in most cases mark an extreme, unsustainable stretch of a move, typically followed by a much deeper consolidation. That is how the majority of stocks behave once they reach this kind of extension.
This one did not follow that script. It kept climbing, higher high after higher high, in what became close to a straight line move, all while its price to earnings ratio expanded to levels many multiples above its industry average.
🔴 The Real Lesson
This entire move, from the seven year breakout to the extension driven rally, represents behavior far outside the normal range of outcomes. It is not something to anchor future decisions on. A chart like this cannot be used as a reference point for how other setups are expected to play out. The only responsible takeaway is this: study price action deeply, on its own terms, for each individual chart, rather than chasing the memory of one extraordinary move and expecting the next green candle to repeat it. FOMO built on someone else's outlier is one of the most common and costly mistakes a trader can make.
BEL — Falling Wedge Testing Apex, Bullish SetupOverview
Bharat Electronics is trading at 410.80, up 0.07%, testing the apex of a falling wedge that has formed since the May high of 464.40. Price recently bounced off Major Support at 382 and has climbed back up to test the wedge's converging trendlines, right at the 50 EMA (407.93) and 200 EMA (409.88) cluster.
Pattern Explanation
Since the May high, the stock has made lower highs and lower lows within two converging trendlines, the hallmark of a falling wedge. Price recently tested the wedge support and Major Support zone (382) together, holding just above the Invalidation level (380), before bouncing back up to test the wedge's upper boundary, where it now also runs into the 50 and 200 EMA cluster. This confluence of wedge resistance and EMA resistance makes the current zone an important test.
Trade Setup
Entry: Buy on every dip near current levels and closer to the 407–410 EMA cluster support
Stop Loss / Invalidation: 380 (below Major Support)
Target 1: 424
Target 2: 435
Key Levels
Wedge Resistance + EMA Cluster: 408–411
Major Support: 382
Invalidation: 380
Target 1: 424
Target 2: 435
Beginner's Lesson
When a falling wedge's resistance line lines up closely with key moving averages, like the 50 and 200 EMA here, it creates a stronger resistance zone than either alone. A breakout through this kind of confluence zone, with a clean close above it, carries more weight than breaking a single trendline in isolation, since it means price has cleared multiple layers of overhead pressure at once. In setups like this, buying on dips toward support rather than chasing strength can offer a better entry, as long as the broader structure stays intact.
Conclusion
BEL is testing an important confluence zone at the wedge apex and EMA cluster. Buying on dips within this zone, with a close above 411 confirming strength, would support the bullish case toward 424 and 435. A slip below 380 would invalidate this setup.
This is for educational purposes only and not investment advice. Please do your own research or consult a financial advisor before making any trading decisions.  Long
Long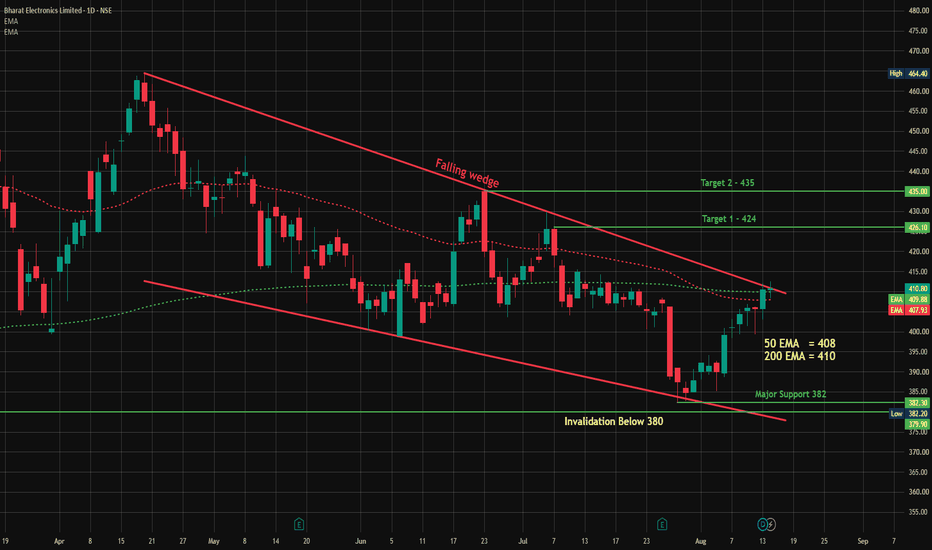
 Long
Long
BTCUSD 4H — Critical Support Test: Bounce or Breakdown?Market Structure:
Bitcoin is showing short-term bearish pressure, with price trading below the 20/50/100 EMA cluster and forming lower highs recently. However, price is approaching a clearly defined support area where a potential recovery setup is developing.
Key Zone:
🟢 Support: 62,216
🔴 Major Invalidation: 61,750
🎯 Resistance/Targets: 64,559 → 65,914
Bullish Scenario: 🐂
If BTC holds the 62,216 support and confirms a bullish reaction, the setup favors a recovery toward 64,559. A confirmed breakout above this level could open the way toward 65,914.
Bearish Scenario: 🐻
A decisive 4H breakdown below 62,216, followed by continued weakness, would increase the probability of a move toward 61,750. Losing 61,750 would invalidate the current bullish recovery idea.
Trade Idea:
Support reaction → bullish confirmation → reclaim of EMA resistance → continuation toward T1 → T2.
The key is confirmation; chasing before BTC proves support is holding carries higher risk.
Invalidation:
A confirmed 4H breakdown below 61,750.
🎯 Bottom Line: BTC is at a major decision point. The next reaction around 62,216 could determine whether this is a healthy pullback before recovery or the beginning of another bearish leg.  Education

 Education

 Education

 Education

Education

 Education

Trading Masterclass #1Institutional trading means trading like hedge funds, banks, prop firms, and professional desks. They do not trade based on emotions, random tips, or gambling. They use systems, probabilities, risk control, position sizing, discipline, and psychology.
Retail traders often lose because they focus only on “entry.” Institutions focus on:
Risk Management
Capital Protection
Position Sizing
Probability
Psychology
Consistency
Repeatable Edge
In options trading, if you think like institutions, your results can improve significantly
 Education

 Education

BTC/USD (1H): Rejection at Supply Zone & Descending Trendline ?Market Overview
Bitcoin (BTC/USD) on the 1-hour timeframe continues to print lower highs and lower lows, heavily guided by a descending trendline. Recent structural movements indicate Smart Money Concepts (SMC) behavior, including a Market Structure Shift (MSS), Break of Structure (BOS), and liquidity sweeps of Equal Lows (EQL).
Key Technical Elements
Market Structure: Downward momentum remains intact following multiple liquidity sweeps (Liq Sweep) and structural breaks on the lower timeframe.
Supply Zone ($63,000 – $63,200): Price is currently retracing into a marked Supply Zone that converges directly with the descending trendline resistance.
Invalidation / Overhead Resistance: A strong candle close above the trendline and the upper boundary of the supply zone (~$63,200–$63,300) invalidates this short bias.
Trade Plan & Execution
Bias: Bearish / Short
Entry Area: Rejection price action inside the Supply Zone ($63,000 – $63,200) near the descending trendline.
Target: $62,400 (Recent swing lows / liquidity target marked at the base).  Short
Short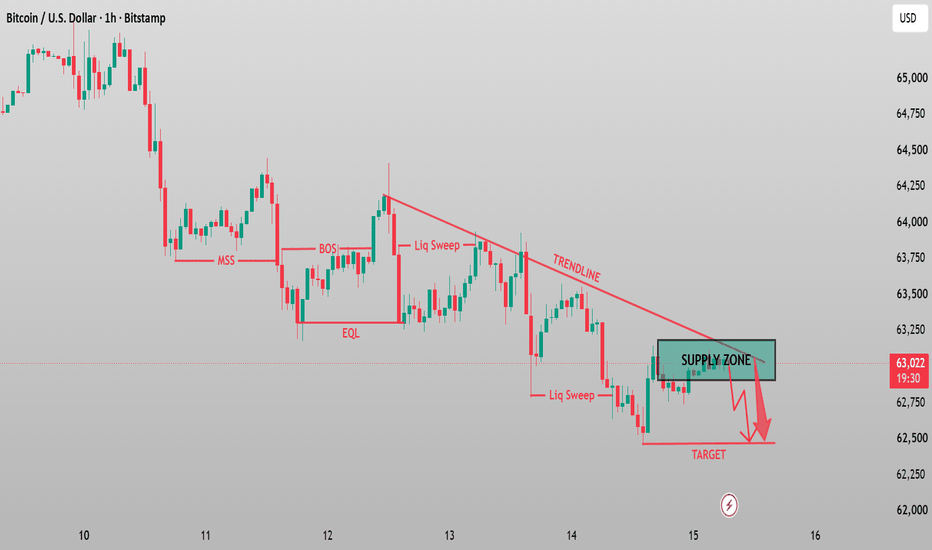
Bitcoin 1H: SMC Setup —Rejection from Supply Zone Target $62,700Bitcoin (BTC/USD) 1H Analysis — Bearish Continuation Setup
Overview:
Bitcoin continues to trade within a well-defined bearish channel on the 1-hour timeframe following a Change of Character (CHOCH) and a clear Market Structure Shift (MSS) higher up.
Key Technical Factors:
Descending Trendline Confluence: Price has consistently respected the descending trendline resistance, driving the price lower.
Supply Zone Rejection: The green highlight ($63,300–$63,600) represents a key supply zone that aligns directly with the descending trendline resistance.
Liquidity Grab & BOS: Following the sweep of the Equal Lows (EQL) and a clear Break of Structure (BOS), market structure remains firmly in favor of the bears.
Trade Execution Plan:
Bias: Short / Bearish 📉
Sell Zone (Supply Area): ~$63,300 – $63,550
Take Profit Target: ~$62,750 (Recent liquidity lows)
Stop Loss: Above the top of the Supply Zone / Trendline (~$63,700–$63,800) Short 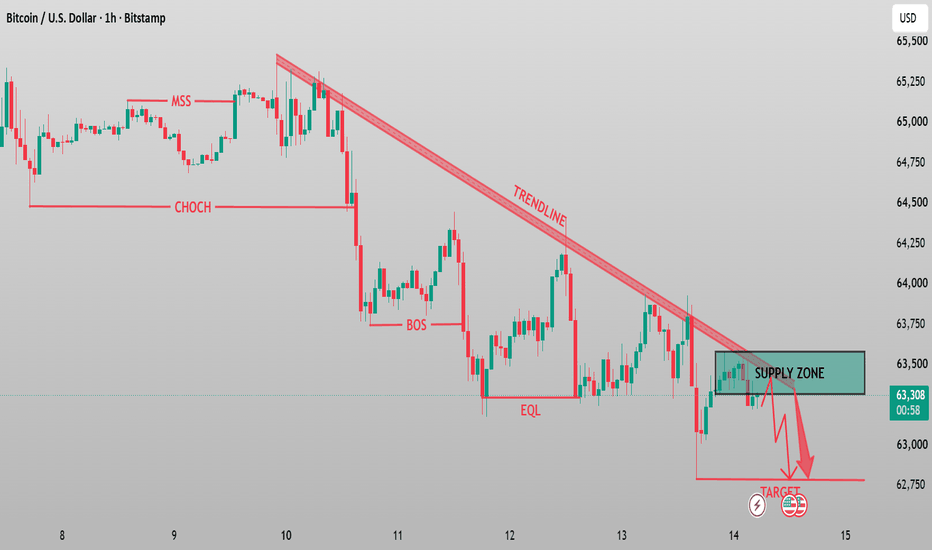
Education