TATA CHEMICALS — Falling Wedge Nearing Resolution, Bullish SetupOverview
Tata Chemicals closed Friday's session at 673.55, up 1.55%, right near the support of a falling wedge that has formed since the stock topped out at 854.85 in April. Falling wedges are typically bullish patterns, and price testing the lower boundary here is worth watching closely as we head into the new week.
Pattern Explanation
Since the April high, the stock has been making lower highs and lower lows, but within two converging trendlines, a steeper falling resistance and a shallower falling support. This is the classic falling wedge shape. Price is now testing the wedge support for the first time in a while, right where buyers have previously stepped in.
Trade Setup
Entry: Buy near current levels (673-676), on strength above wedge support
Stop Loss / Invalidation: 656
Target 1: 701 (near the wedge's upper trendline and 50 EMA zone)
Target 2: 751 (near the 200 EMA)
Key Levels
Wedge Support: ~660-670
Target 1: 701
Target 2: 751
Invalidation: 656
Beginner's Lesson
A falling wedge is a pattern where price keeps making lower highs and lower lows, but the two trendlines are converging, meaning the pace of the decline is slowing down. This often signals that sellers are running out of strength. Once price breaks above the wedge's upper trendline with conviction, it's usually seen as a bullish signal. Watching how price behaves right at the wedge support, like Friday's close, is key: a bounce here with strength adds confidence to the setup.
Conclusion
Tata Chemicals enters the new week at a decision point inside a falling wedge. A bounce from current levels with strength would support the bullish case toward 701 and eventually 751. A close below 656 would invalidate this setup.
This is for educational purposes only and not investment advice. Please do your own research or consult a financial advisor before making any trading decisions.  Long
Long
#NIFTY Intraday Support and Resistance Levels - 10/08/2026Nifty is expected to open flat, with no major changes in the existing levels as the index continues to witness consolidated movements. The immediate support is placed around 24,550–24,450, while 24,700–24,750 remains the key resistance zone.
If Nifty sustains above 24,750, buying can be considered with targets of 24,850, 24,900 and 24,950+. On the downside, a break below 24,450 can trigger selling pressure towards 24,350, 24,300 and 24,250.
Overall, the market is likely to remain range-bound during the initial session. Traders should avoid aggressive trades within the consolidation zone and wait for a decisive breakout above 24,750 or breakdown below 24,450 for fresh directional moves. #BANKNIFTY Intraday PE & CE Levels(10/08/2026)Bank Nifty is expected to witness a flat opening around the current levels, with the index likely to continue its range-bound and consolidated movement. The immediate support zone is placed around 57,550–57,450, while 57,950–58,050 remains an important resistance zone. Traders should wait for a clear breakout or breakdown before taking fresh positions.
If Bank Nifty sustains above 57,950, traders can consider buying with targets of 58,050, 58,250, 58,350, and 58,450+. A decisive breakout above 58,050 can further strengthen the bullish momentum.
On the downside, if Bank Nifty faces rejection from the 57,950–58,050 zone and breaks below 57,550, traders can consider selling with targets of 57,450, 57,250, 57,150, and 57,050. A sustained breakdown below 57,450 can increase the selling pressure further.
Overall, a flat opening is expected with no major change in the existing levels. Since the index is trading within a consolidation range, traders should avoid aggressive entries in the middle of the range and wait for confirmation above resistance or below support. GOLD (XAUUSD) 1H SMC Analysis: Demand Zone Play After BOSXAUUSD (Gold) 1H Technical Analysis
Gold continues to trade in a strong overall bullish structure. Following a brief corrective channel and liquidity sweep around lower levels, price executed a strong Break of Structure (BOS) to the upside, sweeping higher resistance levels.
Currently, price has pulled back to retest a crucial 1H Demand Zone, presenting a potential long opportunity for continuation toward recent high targets.
Key Levels:
Demand Zone / Buy Area: $4,330.00 – $4,345.00
Invalidation / Support (BSL): Below $4,300.00
Primary Target: $4,375.00 – $4,380.00
Trade Plan:
Entry: Looking for bullish confirmation (lower timeframe market structure shift) inside the Demand Zone ($4,330 - $4,345).
Take Profit: $4,375.00 (Recent Highs)
Stop Loss: Placed below the Demand Zone or key support levels.
Risk Disclaimer: Trading Gold carries high risk. Always manage your risk appropriately and use strict position sizing.  Long
Long
Beneath the Surface: Flip Zones, Supply, and PatternsThis post is educational and observational in nature based on historical price action. It is not a forecast or a trading recommendation
Flip Zone (White zone)
A resistance zone that, once broken and sustained above, converted into support. This shift in character is what defines a flip zone, a level whose role changes from holding price down to holding price up.
Counter Trendline (White line)
A trendline drawn against the direction of the primary trend, used to track corrective or pullback phases within a larger structure.
Supply Zone ( Red zone )
A price area where sellers have historically overwhelmed buyers, rejecting advances and capping price on multiple prior attempts.
Hidden Broadening Pattern (Dotted Orange Lines)
A broadening pattern that isn't immediately obvious on the chart, formed by widening highs and lows rather than a contracting range. Because it sits quietly beneath the more visible structures, it's often overlooked despite reflecting increasing volatility within the broader move.
The Bigger Picture
This chart layers four separate elements together, a flip zone, a counter trendline, a supply zone, and a hidden broadening pattern, all coexisting within the same price history. Recognizing how these structures sit relative to one another, rather than viewing any single one in isolation, offers a deeper read of the chart's overall behavior.  Long
Long
 Long
Long

The Science of Price Discovery: Why Markets Move the Way They Have you ever watched a stock trade around ₹1,000 for hours and then suddenly jump to ₹1,020?
Nothing magical happened.
The market was simply trying to answer one question:
What is the price buyers and sellers are willing to accept right now?
This process is called price discovery.
It is happening every second the market is open. Buyers are placing orders, sellers are responding, and price keeps moving until the market finds an area where enough participants are willing to trade.
Understanding this process can completely change the way you look at a chart.
Instead of asking only, "Where will price go next?", you start asking:
"What is the market trying to discover?"
What Is Price Discovery?
Price discovery is the process through which buyers and sellers arrive at a market price.
Think about a simple auction.
A seller wants ₹100 for an item.
A buyer is willing to pay ₹90.
They haven't agreed on a price yet.
Maybe another buyer offers ₹95.
Another offers ₹98.
Eventually, someone is willing to pay ₹100.
A transaction happens.
Financial markets work on the same basic idea, just at a much larger and faster scale.
Millions of orders can interact across different prices, creating continuous changes in supply and demand.
The price on your screen is simply the latest point where buyers and sellers agreed to trade.
Price Is Always Searching for Balance
Markets are constantly moving between balance and imbalance.
When buyers and sellers are relatively balanced, price often moves sideways.
You may see small candles, overlapping ranges, and repeated tests of the same area.
The market is comfortable there.
But when one side becomes more aggressive, that balance changes.
If buyers are willing to pay increasingly higher prices, sellers may raise their asking prices.
Price moves higher.
If sellers become more aggressive and buyers are no longer willing to pay the current price, sellers begin accepting lower prices.
Price moves lower.
This is why markets trend.
A trend is essentially a period where the market is repeatedly searching for a new level of agreement.
Why Price Moves So Quickly Sometimes
Not every price move happens at the same speed.
Sometimes price moves slowly.
Other times, it seems to explode in seconds.
Why?
Because liquidity and order flow are constantly changing.
Imagine there are many sellers around ₹500.
Buyers can easily find someone willing to sell at that price.
Trading happens smoothly.
Now imagine those sellers suddenly disappear or get bought up.
The next available sellers might be at ₹505.
Buyers who still want to enter must now pay more.
Price jumps.
This is one reason markets can move quickly when liquidity is thin.
The market is searching for the next available area where transactions can occur.
The Order Book and the Battle for Price
Behind every market price is a collection of buy and sell orders.
Buyers typically place bids.
Sellers place offers or asks.
The difference between the highest bid and lowest ask is known as the spread.
When buyers and sellers agree, a transaction takes place.
That transaction becomes part of the market's price history.
Thousands of these interactions create the chart we see.
A candlestick may look simple, but behind it are countless decisions.
Someone decided to buy.
Someone else decided to sell.
Their agreement created another piece of price information.
## Why Price Doesn't Always Go Where the News Suggests
This is where price discovery becomes particularly interesting.
Suppose a company releases excellent earnings.
You might expect the stock to rise.
But instead, it falls.
How can that happen?
Because the market isn't reacting to the news in isolation.
It is reacting to how the news compares with expectations.
If traders were expecting even better results, the announcement may disappoint them.
Perhaps investors had already bought the stock in anticipation of the results.
Once the news arrives, they sell to take profits.
The information may be positive.
But the price discovery process may still push the stock lower.
Markets care about expectations, positioning, and new information—not simply whether a headline sounds good or bad.
The Role of Supply and Demand
Supply and demand are at the heart of price discovery.
When demand exceeds available supply, buyers compete for the available shares.
They may need to offer higher prices.
Price rises.
When supply exceeds demand, sellers compete to find buyers.
They may need to accept lower prices.
Price falls.
This process continues until the market reaches another area where enough buyers and sellers are willing to transact.
That is why price is always moving.
The market is constantly searching for agreement.
Why Markets Consolidate
Have you ever wondered why price sometimes stays trapped in a narrow range for hours, days, or even weeks?
This is often a sign of balance.
Buyers aren't aggressive enough to push price significantly higher.
Sellers aren't aggressive enough to push it significantly lower.
Both sides are comfortable trading within a particular area.
This creates consolidation.
But eventually, something changes.
New information arrives.
Large orders enter.
Sentiment shifts.
Liquidity changes.
One side becomes more aggressive.
The balance breaks.
Price begins searching for a new level.
This is why consolidation can often appear before a major move.
The market is building a new area of agreement—or preparing to leave the old one.
What Happens During a Breakout?
A breakout occurs when price moves beyond an area where the market previously found balance.
Imagine a stock has traded between ₹100 and ₹110 for several weeks.
Buyers repeatedly defend ₹100.
Sellers repeatedly defend ₹110.
The market has established a range.
Then buyers become aggressive enough to absorb the available selling around ₹110.
Price breaks above the range.
Now the market must discover where the next group of sellers is willing to participate.
Maybe ₹115.
Maybe ₹120.
Maybe much higher.
The market keeps moving until it finds enough supply to slow the advance.
The same process happens during a breakdown.
## Price Discovery and Market Structure
This is where price discovery connects directly with technical analysis.
Higher highs and higher lows show that buyers are repeatedly accepting higher prices.
Lower highs and lower lows show that sellers are successfully pushing the market toward lower prices.
Support and resistance show areas where the market previously found agreement or experienced strong rejection.
Consolidation shows temporary balance.
Breakouts show the market searching for a new area of value.
When you understand price discovery, these patterns stop looking like isolated technical formations.
They become different stages of the same process.
The Importance of Volume
Volume can provide additional clues.
When a large amount of trading occurs around a particular price, it tells us that many participants were willing to transact there.
That area may become important in the future.
On the other hand, when price moves rapidly through an area with relatively little trading, the market may be moving quickly toward the next area where buyers and sellers are willing to engage.
This is why tools such as volume profiles can be useful.
They help traders see where the market spent time trading and where it moved through quickly.
Price Does Not Move Because It "Wants" Something
Traders often say:
"Price wants to go higher."
Or:
"The market wants to take the liquidity below those lows."
These phrases can be useful shorthand, but they shouldn't be taken literally.
Price doesn't have intentions.
It responds to orders, liquidity, expectations, information, and the decisions of market participants.
The market isn't thinking.
People are thinking.
And their collective decisions create the movement we see on the chart.
The Real Advantage of Understanding Price Discovery
You don't need to predict every move.
In fact, trying to predict everything can make trading unnecessarily complicated.
Instead, focus on what the market is currently showing you.
Ask:
Where are buyers accepting higher prices?
Where are sellers becoming aggressive?
Where is the market balanced?
Where has price been rejected?
Where is liquidity concentrated?
Is the market searching for a new area of value?
Is the current move being accepted or rejected?
These questions help you understand what is happening rather than simply guessing what might happen next.
Final Thoughts
Price discovery is one of the most fundamental processes in financial markets.
Every tick, every candle, every breakout, and every reversal is part of the same ongoing process.
Buyers and sellers are constantly negotiating.
Sometimes they agree.
Sometimes they strongly disagree.
When they agree, price tends to stabilize.
When they disagree, price moves until a new agreement is found.
That is the science behind price movement.
So the next time you look at a chart, don't just see a series of candles.
Think of it as a continuous auction.
Every candle represents another round of negotiation between buyers and sellers.
And every move tells you something about where the market is willing—or unwilling—to trade.
Price discovery isn't just something that happens in the market.
It is the market. Education 
Trading Masterclass #1Institutional trading means trading like hedge funds, banks, prop firms, and professional desks. They do not trade based on emotions, random tips, or gambling. They use systems, probabilities, risk control, position sizing, discipline, and psychology.
Retail traders often lose because they focus only on “entry.” Institutions focus on:
Risk Management
Capital Protection
Position Sizing
Probability
Psychology  Education



Trading AnalysisWhere is Nifty right now?
Nifty closed at 23,689 on Thursday May 14. After a brutal fall earlier this week (it touched ~23,300), it bounced back for 2 days in a row. So right now it's in a recovery mood — but it hasn't really "fixed" itself yet. Think of it like someone who had a fever, now feeling slightly better, but not fully healthy.
2 What's the wall above? (Resistance)
If Nifty tries to go up next week, it will hit a wall around 23,500–23,600 first. That's the first test. If it somehow crosses that, the BIGGER wall is at 23,900–24,000 — where all the major moving averages (50-day & 200-day) are sitting. Lots of sellers will be waiting there to book profits. So going above 24,000 next week? Unlikely unless something very positive happens.
3 What's the floor below? (Support)
If Nifty starts falling, the first safety net is around 23,300–23,150. This zone has held multiple times recently. If it breaks this level decisively (and stays below it), then the next stop could be 23,000 or even 22,900. That's the danger zone — but that's not the most likely scenario for next week.


 Education

 Long
Long
Gold Trade Plan [10.08.2026: Monday]Probable Scenario Analysis and Trade Plan for Gold TVC:GOLD for the 10th of August, 2026. The day is Monday.
🟢 Bullish Scenario
Presently, Gold is bullish. Doubt every down move unless the trend gets reversed. If the price stays above 4325, then stay bullish. The probable bullish targets above 4325 would be - 4350, 4375, and 4400. Level 4400 will be strong resistance. Next, if the price decisively breaks out above 4400, then bullishness might further increase. The probable bullish targets above 4400 would be - 4425, 4450, 4475, and 4500.
🔴 Bearish Scenario
Presently, there is no bearish scenario. Doubt every down move. Level 4275 is critical. If the price breaks down below 4275, then a weak bearish move will emerge. In that case, 4250 would be a minor bearish target. Level 4250 would act as strong support. Next, if the price decisively breaks down below 4250, then a strong bearish move is expected. The probable bearish targets below 4250 would be - 4225 and 4200. Level 4200 would offer strong support.
🟡 No Trading Zone (NTZ): (4325 - 4275).
⏺ Minor Range of Consolidation (Mi-ROC): (4400 - 4300).
Here, 4350 is the median of the Mi-ROC. The median works like a trading session sentiment evaluator. The price trading above the median would offer bullish sentiment, while the price trading below the median would trigger bearish sentiment within the ROC.
⏺ Major Range of Consolidation (Ma-ROC): (4400 - 4250).
Here, 4325 is the median of the Ma-ROC. The median works like a trading session sentiment evaluator. The price trading above the median would offer bullish sentiment, while the price trading below the median would trigger bearish sentiment within the ROC.
● Event
There is no high-impact event this week (10 - 14 August, 2026).
● Intraday, Weekly, and Monthly Bias
Establish bias with respect to the opening price (of the particular session - Intraday, Weekly, and Monthly). If the price sustains above the opening price, then don't think of shorting. Look for bullish trades only. On the contrary, if the price sustains below the opening price, then don't think of going long. Look for bearish trades in that case.
● Disclaimer + End Note
- All the analyses would fail in the case of a major gap up, gap down, or price structure anomaly. Thus, practice PRAGMATISM in the live session.
- Trade only if there is a set-up. Remember, not trading is an extension of the trading activity.
- Mark your points. Trade your points. Price is GOD. Anything can happen in the markets. Thus, trade what you see, not what you believe.
- Always PRACTICE RISK MANAGEMENT. Always PROTECT YOUR CAPITAL. Be RESPONSIBLE.
- Be Strategic. Be Courageous. Be Patient. Be Wise.
- Every day is a new day. Thus, do not carry the baggage of past successes or failures. Leave the gardens of winning and losing. Establish yourself in equanimity. Always think from a new perspective.
- Let the joy of trading drive your effectiveness, not greed or fear. Believe in Possibilities.
Happy Trading! BTCUSD: Bullish Bounce Off Demand Zone — Eyeing $65.4k BSLBTCUSD: Demand Zone Reaction & Bullish Structure Shift
Bitcoin is currently exhibiting a strong bullish structure on the 1-Hour timeframe, adhering cleanly to Smart Money Concepts (SMC).
Key Technical Breakdown:
Liquidity Sweep & CHOCH: Price swept low-end sell-side liquidity near $62,500 before initiating a strong reversal with a Change of Character (CHOCH) and consecutive Breaks of Structure (BOS).
Upward Channel Breakout: Following an extended rally inside an ascending channel, price broke higher and established a fresh Market Structure Shift (MSS) above $64,750.
Demand Zone Hold: The recent pullback tapped perfectly into our 1H Demand Zone ($64,500 – $64,750) and reacted positively, signaling strong buyer absorption.
Trade Outlook & Key Levels:
Bias: Bullish above Demand Zone
Immediate Target: $65,400 – $65,500 (Buy-Side Liquidity / Highs)
Key Support / Demand: $64,500 – $64,750
Invalidation (SSL): A clean hourly close below $64,100 invalidates the current bullish setup. Long 
BTC/USD: H4 Order Block Retest – Target (BSL) at $65.3K!1. Technical Context & Market Structure
Bottoming & Liquidity Sweep: Bitcoin swept sell-side liquidity near $62,500, followed by a clear CHOCH (Change of Character) and BOS (Break of Structure) above $63,750.
Upward Channel: Price held an ascending channel structure before breaking higher toward $65,250.
Current Zone: After a quick liquidity sweep, price has retraced into a key H4 Order Block (H4-OB) around $64,400 – $64,800, showing strong bullish reaction candles on lower timeframes.
2. Trade Setup Details
🟢 Bias: Bullish
🎯 Target (BSL): ~$65,300 (Taking out recent swing high buy-side liquidity)
📥 Entry Zone: $64,400 – $64,800 (Inside H4 Demand / Order Block)
🛑 Invalidation (SL): Below $64,000 (Below Sell-Side Liquidity / SSL)
3. Trade Plan & Execution Strategy
Bullish Scenario: As long as price respects the H4-OB and holds above the SSL ($64,100), we expect a push to clear the BSL ($65,300+).
Bearish Risk: A candle close below the $64,000 level invalidates the bullish SMC thesis, opening the door for deeper retests toward lower demand zones. Long 
Gold (XAUUSD) - H1/H4 Demand Re-entry Following Strong BOS🚀 Market Context & Technical Overview
Gold (XAUUSD) on the 4-Hour (4H) chart has demonstrated a strong bullish structural shift following a prolonged consolidation/reversal phase (Inverse Head & Shoulders setup).
Market Structure Shift (MSS) & BOS: Price recently completed a decisive Break of Structure (BOS) above the key swing high near $4,120, surging impulsively into new highs past $4,320.
Current Action: Price is pressing higher toward our immediate target zone around $4,370 - $4,380.
📈 Trade Setup & Key Levels
Immediate Bullish Momentum:
Target: ~$4,370.00
If buying pressure remains intense, price may push directly to complete the primary target.
Pullback / Re-entry Scenarios (Order Block / Demand Zones):
Should the price experience a retracement/correction from current levels, we are monitoring two key demand zones for long opportunities:
H1-Demand Zone: ~$4,270 - $4,290
H4-Demand Zone: ~$4,230 - $4,260
A drop into either of these interest zones offers a favorable risk-to-reward ratio (RRR) for another leg up toward the $4,370+ target.
💡 Summary Execution Plan
Bias: Strongly Bullish
Target Area: ~$4,370.00
Key Support / Demand: $4,270 (H1) and $4,230 (H4)
Invalidation: A sharp breakdown back below the $4,200 structural level would invalidate the immediate bullish thesis. Long 
Short 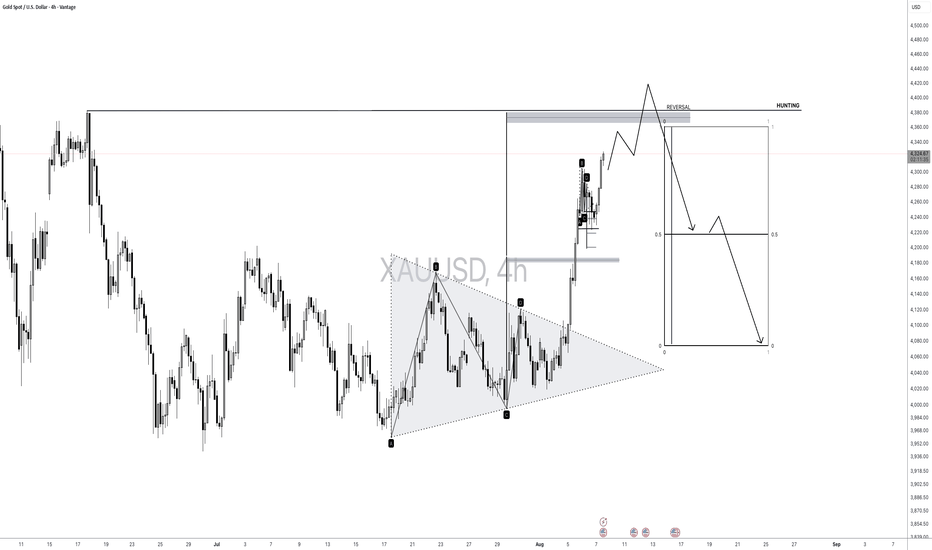
Gold Spot (4H) | Smart Money Structure Shift & Demand Zone BuyOverview
Gold (XAU/USD) on the 4-Hour timeframe is showing strong bullish momentum after a series of structural confirmations (MSS and BOS). We are currently seeing price trace into key interest areas following an explosive expansion upwards.
🔑 Key Technical Highlights
Market Structure Shift (MSS) & Break of Structure (BOS):
Price broke key swing highs with high momentum, confirming a shift from a corrective phase to a strong bullish trend.
Point of Interest (POI) & SMC Alignment:
Following liquidity sweeps and initial MSS around the $4,000 zone, price respected the POI and expanded violently to the upside.
Key Reaction Levels:
Demand Zone: ~$4,240 – $4,265 (Immediate area of interest)
Strong Demand Zone: ~$4,195 – $4,220 (Deeper pullback zone for higher-probability entries)
Upside Target:
Target Area: $4,295 – $4,300+ (Aligned with liquidity pools above the latest high)
🎯 Trading Plan / Strategy
Scenario A (Immediate Demand): Watch for lower-timeframe bullish confirmation (15m/1h MSS or engulfing patterns) inside the 4,240 - 4,265 Demand Zone.
Scenario B (Deeper Discount): If the current demand fails to hold, look for a deeper retracement into the 4,195 - 4,220 Strong Demand Zone for a safer risk-to-reward long position.
Invalidation: A clean 4H candle close below the Strong Demand Zone ($4,190) invalidates the immediate bullish structure. Long 
BTC Short Setup: Supply Zone Rejection Following BSL SweepTrade Setup: Bearish Rejection at Supply Zone (SMC Setup)
Bitcoin (BTC/USD) on the 1H timeframe is showing clear signs of potential bearish continuation after a breakdown from an ascending channel structure.
Key Technical Observations:
Buy-Side Liquidity (BSL) Swept: The recent rally to the $65,000 mark successfully cleared buy-side liquidity, creating a local top.
Ascending Channel Breakdown: Price action broke out of the rising channel structure, signaling loss of bullish momentum.
Supply Zone Retest: BTC is currently pulling back to retest the newly formed Supply Zone ($64,600 - $64,750).
Market Structure Alignment: Prior price action established key levels via previous Liquidity Sweeps, CHOCH, and MSS, setting up this distribution phase.
Trade Execution Plan:
Bias: Bearish / Short
Entry Zone: $64,500 – $64,750 (Inside the Supply Zone)
Target (TP): $63,750 (Sell-Side Liquidity / Support Level)
Stop Loss (SL): Above the BSL / Local High (~$65,100+) Short 
Education