Long
Long
Trading Masterclass #1Institutional trading means trading like hedge funds, banks, prop firms, and professional desks. They do not trade based on emotions, random tips, or gambling. They use systems, probabilities, risk control, position sizing, discipline, and psychology.
Retail traders often lose because they focus only on “entry.” Institutions focus on:
Risk Management
Capital Protection
Position Sizing
Probability
Psychology
Consistency
Repeatable Edge
In options trading, if you think like institutions, your results can improve significantly






NIFTY50 (1D): Gap Analysis & Macro Structural Shift - Road AheadOverview:
The Nifty 50 Index on the daily timeframe is currently at a critical structural junction at 23,767.45. Following a monumental run from the 18,800 lows to an all-time high of 26,373.20, the index has undergone a sharp macro correction. The application of gap analysis reveals that the recent steep decline has left behind significant overhead supply gaps, marked by the red resistance zones, while multiple unfilled bullish gaps, marked by the green support zones, still act as magnets below the current market price. The daily RSI at 42.87 indicates that the short-term momentum currently favors the bears, as it is actively trading below its RSI moving average of 52.48.
Micro and Macro Trend Bias:
Micro Trend (Short-Term): Bearish to Neutral. The immediate price action is struggling to reclaim the overhead supply zones and remains under pressure following a major gap-down sequence. The bias remains sell-on-rise until the immediate resistance gap is decisively filled and closed above.
Macro Trend (1 to 3 Years): Cautiously Bullish and Accumulation Phase. Despite the sharp corrective drop from 26,373.20, the broader macro structure over a multi-year horizon remains technically positive. The current pullback to the 23,700 level and potential deeper dips into lower gap zones represent long-term wealth creation and accumulation areas for a multi-year holding horizon.
Key Support and Resistance Levels (Gap Analysis):
Immediate Resistance (Supply Gaps): The first major overhead hurdle is the immediate red gap zone near 24,000 to 24,200. Reclaiming this is the first step to neutralizing the micro bearish trend.
Macro Resistance: The ultimate macro resistance sits at the unfilled structural gap near 25,000 to 25,200, followed by the all-time high peak of 26,373.20.
Immediate Support (Demand Gaps): The price is currently testing the first tier of green gap support clustered around 23,400 to 23,600. If this fails, the next major gap demand zone sits firmly at the 23,000 to 23,100 psychological level.
Deep Macro Support (1 to 3 Year Floor): For long-term investors, the massive unfilled gaps left behind during the historic rally at 22,000, 21,000, and 20,000 represent extreme value zones. A multi-year capitulation into these green gap levels would offer generational accumulation opportunities.
Directional Bias and 1 to 3 Year Outlook:
For a 1 to 3-year investment horizon, the directional bias is to accumulate systematically on dips into the established green gap support zones. The current entry point near 23,767 offers a reasonable initial allocation, but conservative investors should keep dry powder ready for potential gap-fill flushes down to the 23,000 or even 22,000 levels. As long as the macro gap supports hold over the longer timeframe, the expectation is for the Nifty 50 to eventually base out, absorb the overhead supply, and launch a new structural bull run to challenge the 26,373.20 peak over the next 36 months.  Long
Long
BAJAJ FINANCE: Fresh All-Time High BreakoutOverview
Bajaj Finance has broken out to a fresh all-time high today, closing at 1,141.2, up 8.32% in a single session on strong volume. This is a big breakout candle after weeks of steady grinding higher, and the stock is now trading in uncharted territory with no historical resistance above.
Pattern Explanation
If we look at the chart, the stock spent March to June building a base, then started a clean uptrend from June onwards, staying above both the 50 EMA and 200 EMA the whole way up. Today's candle broke clean above the previous swing high with a big green breakout candle, taking it to a new all-time high.
What makes this breakout even more convincing is the volume. Today's candle traded 40.81M shares, way above the recent average of 9.94M. High volume on a breakout day tells us this isn't just a random spike, there's real buying interest behind the move.
Since this is uncharted territory, we're using a rising trendline (connecting recent swing highs) along with recent swing levels to plan our zones.
Key Levels
Immediate Support: 1,102
Invalidation Level: 1,074 (a close below this would question the breakout)
EMA Support: 50 EMA at 999.80, 200 EMA at 956.04 (deeper support if pullback extends)
Scenarios
If Bajaj Finance holds above the 1,102–1,074 zone on any pullback, we can expect the trend to continue higher, with the stock making fresh highs step by step.
If the stock closes below 1,074, it would invalidate this breakout structure, and we may see a deeper correction back towards the 50 EMA.
Beginner's Lesson
When a stock hits an all-time high, there's no old resistance above it to worry about, every previous seller has already been proven wrong. That's why breakouts to new highs can move fast. But it also means we don't have historical price levels to rely on, so traders use tools like recent swing points and trendlines to plan supports and targets.
Volume is like a lie detector for price moves. A breakout on low volume can often fail or get reversed, but a breakout on high volume, like we see here, usually has more strength behind it and better odds of continuing.
Conclusion
Bajaj Finance is in a strong all-time-high breakout structure, backed by a clear volume surge. As long as it holds above 1,074, the path of least resistance remains up. A close below that level would be the first sign of caution.
This is for educational purposes only and not investment advice. Please do your own research or consult a financial advisor before making any trading decisions.  Long
Long
 Short
Short
#NIFTY Intraday Support and Resistance Levels - 03/08/2026Nifty 50 is expected to open with a slight gap-up above the 24,550 level, indicating a positive start to the trading session. However, traders should wait for confirmation above the immediate resistance zone before initiating aggressive long positions, as the index is approaching a key breakout area.
If Nifty sustains above 24,550 after the opening, traders can consider buying with upside targets of 24,650, 24,700, and 24,750+. A sustained move above this level will confirm fresh bullish momentum and may extend the rally towards higher levels.
On the downside, if the index fails to sustain near 24,450–24,400, traders can consider selling with downside targets of 24,350, 24,300, and 24,250. The immediate support remains around 24,250, and a breakdown below this level may invite further selling pressure.
Overall, a slight gap-up opening is expected above the 24,550 level with a positive bias. As long as Nifty holds above the 24,550 breakout zone, buying on dips remains the preferred strategy. Traders should wait for a confirmed breakout above resistance before taking fresh long positions while maintaining disciplined risk management. #BANKNIFTY Intraday PE & CE Levels(03/08/2026)Bank Nifty is expected to open with a slight gap-up above the 57,500 level, indicating a positive start to the trading session. However, traders should wait for confirmation above the immediate resistance zone before taking aggressive long positions, as the index is approaching a key supply area.
If Bank Nifty sustains above 57,550 after the opening, traders can consider buying CE options with upside targets of 57,750, 57,850, and 57,950+. A decisive breakout above 58,050 will further strengthen the bullish momentum, opening the path towards 58,250, 58,350, and 58,450+.
On the downside, if the index fails to hold above 57,450–57,400, traders can consider buying PE options with downside targets of 57,250, 57,150, and 57,050. The immediate support remains near 57,050, and a breakdown below this level may trigger further selling pressure.
Overall, a slight gap-up opening is expected above the 57,500 level with a positive bias. As long as Bank Nifty sustains above the 57,500–57,550 zone, buying on dips remains the preferred strategy. Traders should wait for a confirmed breakout above key resistance levels before initiating fresh long positions while maintaining disciplined risk management.  Short
Short
Nifty 50 Trade Plan [03.08.2026: Monday]Probable Scenario Analysis and Trade Plan for the Nifty 50 Index NSE:NIFTY for the 03rd of August, 2026. The day is Monday.
🟢 Bullish Scenario
Presently, the price is in the bullish zone. If the price stays above 24300, then stay bullish. Take bullish trades only. Every down move should be considered as an opportunity to go long. The probable bullish targets above 24300 would be - 24350, 24400, 24450, and 24500. There will be strong resistance at 24500. Next, if the price sustains above 24500, then the probable bullish targets would be - 24550, 24600, 24650, 24700, and 24750.
🔴 Bearish Scenario
Presently, there is no bearish setup. Doubt every down move. There is a strong support zone (SSZ) in the area of (24300 - 24200). However, if the price breaks down below 24200, then a weak bearish scenario would emerge. The probable weak bearish targets below 24200 would be - 24150 and 24100. There will be strong support at 24100. Next, if the price decisively breaks down below 24100, then there will be strong selling. The probable bearish targets below 24100 would be 24050 and 24000.
🟡 No Trading Zone (NTZ): (24300 - 24200).
⏺ Range of Consolidation (ROC): (24500 - 24200).
Here, 24350 is the median of the ROC. The median works like a trading session sentiment evaluator. The price trading above the median would offer bullish sentiment, while the price trading below the median would trigger bearish sentiment within the ROC.
● Event
There is one high-impact event this week. The RBI Interest Rate Decision is on 05th of August, 2026. The day is Wednesday. It is positioned between two expiries (Tuesday Nifty 50 and Thursday SENSEX expiry). There are no holidays this week. Lastly, geopolitical events are omnipresent and beyond our analysis.
● Intraday, Weekly, and Monthly Bias
Establish bias with respect to the opening price (of the particular session - Intraday, Weekly, and Monthly). If the price sustains above the opening price, then don't think of shorting. Look for bullish trades only. On the contrary, if the price sustains below the opening price, then don't think of going long. Look for bearish trades in that case.
● Disclaimer + End Note
- All the analyses would fail in the case of a major gap up, gap down, or price structure anomaly. Thus, practice PRAGMATISM in the live session.
- Trade only if there is a set-up. Remember, not trading is an extension of the trading activity.
- Mark your points. Trade your points. Price is GOD. Anything can happen in the markets. Thus, trade what you see, not what you believe.
- Always PRACTICE RISK MANAGEMENT. Always PROTECT YOUR CAPITAL. Be RESPONSIBLE.
- Be Strategic. Be Courageous. Be Patient. Be Wise.
- Every day is a new day. Thus, do not carry the baggage of past successes or failures. Leave the gardens of winning and losing. Establish yourself in equanimity. Always think from a new perspective.
- Let the joy of trading drive your effectiveness, not greed or fear. Believe in Possibilities.
Happy Trading! Gold Weekly Analysis [03 - 07 August, 2026]Probable Scenario Analysis and Trade Plan for Gold TVC:GOLD for the week (03 - 07 August, 2026).
🟢 Bullish Scenario
Presently, there is no bullish scenario. The price is in a grinding range-bound consolidation. The zone (4150 - 4100) is a strong resistance zone (SRZ). If the price sustains above 4150, then a bullish setup would trigger. The probable bullish targets above 4150 would be - 4200 and 4250. There might be strong resistance at 4250. Next, if the price sustains above 4250, then the probable bullish target would be 4300.
🔴 Bearish Scenario
Presently, there is no bearish scenario. The price is in a grinding range-bound consolidation. Though the main trend is bearish and there is a strong bearish bias, there is no observable bearish scenario. The zone (4000 - 3950) is a strong support zone (SSZ). However, if the price decisively breaks down below 3950, then a bearish setup would activate. The probable bearish target below 3950 would be 3900. Level 3900 might offer strong support. Next, if the price breaks down below 3900, then there will be a strong sell-off in the market. The probable bearish targets below 3900 would be - 3850 and 3800.
🟡 No Trading Zone (NTZ): (4150 - 3950).
⏺ Range of Consolidation (ROC): (4250 - 3950).
Here, 4100 is the median of the ROC. The median works like an intraday sentiment evaluator. The price trading above the median would offer bullish sentiment, while the price trading below the median would trigger bearish sentiment within the ROC.
● Event
It will be the first week of August 2026. All the events in this week have medium impact. There is no high-impact event. Also, there are no holidays.
● Intraday, Weekly, and Monthly Bias
Establish bias with respect to the opening price (of the particular session - Intraday, Weekly, and Monthly). If the price sustains above the opening price, then don't think of shorting. Look for bullish trades only. On the contrary, if the price sustains below the opening price, then don't think of going long. Look for bearish trades in that case.
● Disclaimer + End Note
- All the analyses would fail in the case of a major gap up, gap down, or price structure anomaly. Thus, practice PRAGMATISM in the live session.
- Trade only if there is a set-up. Remember, not trading is an extension of the trading activity.
- Mark your points. Trade your points. Price is GOD. Anything can happen in the markets. Thus, trade what you see, not what you believe.
- Always PRACTICE RISK MANAGEMENT. Always PROTECT YOUR CAPITAL. Be RESPONSIBLE.
- Be Strategic. Be Courageous. Be Patient. Be Wise.
- Every day is a new day. Thus, do not carry the baggage of past successes or failures. Leave the gardens of winning and losing. Establish yourself in equanimity. Always think from a new perspective.
- Let the joy of trading drive your effectiveness, not greed or fear. Believe in Possibilities.
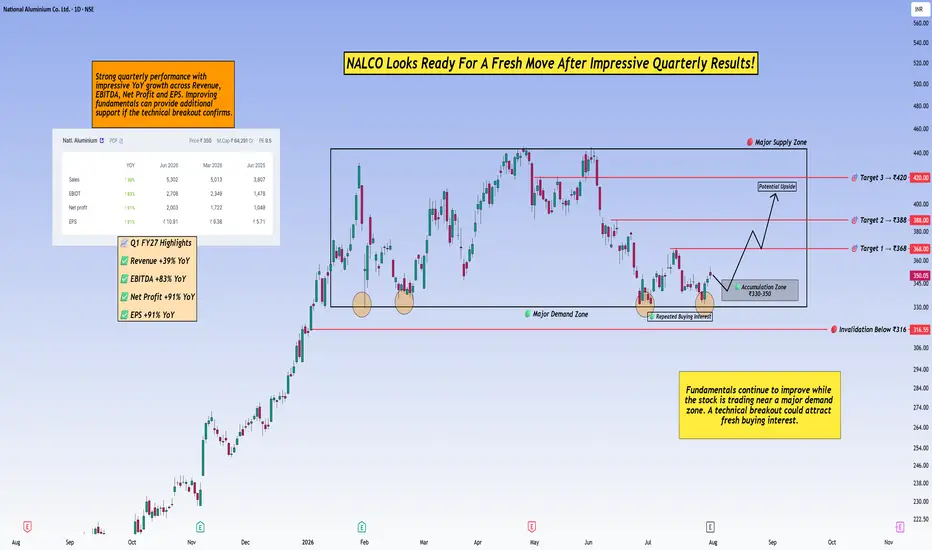
Happy Trading! NALCO: Strong Results + Strong Support = High Conviction Setup?Hello Traders! 👋
Today I'm sharing my view on National Aluminium Company Ltd. (NALCO).
Most of the time I only focus on price action, but this time one more thing caught my attention, the latest quarterly results.
The company reported really strong growth in Revenue, EBITDA, Net Profit and EPS compared to last year. Good earnings don't always mean the stock will go up immediately, but when fundamentals start improving and the chart also looks strong, I always keep that stock on my watchlist.
What I Like On This Chart:
Price is trading near a major demand zone where buyers have already defended the stock multiple times.
The stock is slowly building a base instead of making lower lows, which is a positive sign.
Recent quarterly numbers were much better than last year, showing the business is moving in the right direction.
If buyers continue defending this area, the stock may try to move towards the next resistance levels.
I'm not saying this stock will suddenly start flying from here. Market can always surprise us. But when fundamentals and technicals both start supporting each other, I think it's worth paying attention.
For me, this is more like a "watch closely" setup rather than chasing the price.
All important support, accumulation zone, stop loss and target levels are already marked on the chart above.
What do you think about NALCO?
Do you believe the strong quarterly results can help the stock break out, or will it spend some more time in this range? I'd love to hear your opinion.
If you found this analysis useful, don't forget to hit Boost, leave a comment and Follow for more market ideas.
Disclaimer: This analysis is only for educational purposes and shares my personal market view. Please do your own research before taking any investment or trading decision.
— @TraderRahulPal
SCA Registered Financial Influencer
 Long
Long
 Education

Trading Masterclass #1Institutional trading means trading like hedge funds, banks, prop firms, and professional desks. They do not trade based on emotions, random tips, or gambling. They use systems, probabilities, risk control, position sizing, discipline, and psychology.
Retail traders often lose because they focus only on “entry.” Institutions focus on:
Risk Management
Capital Protection
Position Sizing
Probability
Psychology
Consistency
Repeatable Edge
In options trading, if you think like institutions, your results can improve significantly  Education

 Education

Core of Technical AnalysisCore of Technical Analysis
Technical Analysis is the study of past price movements, volume, and market trends to predict future price direction.
3 Main Principles:
Market Discounts Everything
All news, emotions, and fundamentals are already reflected in price.
Prices Move in Trends
Markets usually move in uptrend, downtrend, or sideways trends.
History Repeats Itself
Human psychology creates repeating chart patterns.
Key Tools:
Charts (Candlestick, Line, Bar)
Support & Resistance
Trendlines
Indicators (RSI, MACD, Moving Averages)
Volume Analysis
Patterns (Head & Shoulders, Double Top, Triangle)
 Education

Education

 Education

Technical AnalysisCore of Technical Analysis
Technical Analysis is the study of past price movements, volume, and market trends to predict future price direction.
3 Main Principles:
Market Discounts Everything
All news, emotions, and fundamentals are already reflected in price.
Prices Move in Trends
Markets usually move in uptrend, downtrend, or sideways trends.
History Repeats Itself
Human psychology creates repeating chart patterns.
Key Tools:
Charts (Candlestick, Line, Bar)
Support & Resistance
Trendlines
Indicators (RSI, MACD, Moving Averages)
Volume Analysis  Education