Long
Long
XAUUSD — Breakout Pressure BuildsGold remains volatile after the Federal Reserve kept rates unchanged at 3.50%–3.75% in a divided 9–3 decision, with three members preferring a 25-basis-point hike. This split reinforces uncertainty around the next policy move and keeps XAUUSD sensitive to Treasury yields and the US dollar.
Attention now shifts to today’s US Q2 GDP advance estimate and June Personal Income and Outlays, including PCE inflation, both scheduled for 8:30 a.m. ET. These releases could determine whether the latest gold recovery develops into a broader expansion or faces renewed pressure.
Technical View
On the H1 chart, XAUUSD has recovered strongly from the 4,000 area and is now forming higher lows above a rising intraday trendline.
Price has reclaimed both the EMA 34 and EMA 89, while the faster average is beginning to turn higher. This suggests improving short-term momentum, although the broader descending trendline near 4,105–4,115 remains the decisive resistance.
RSI is holding near 58, above the neutral 50 level without entering overbought territory. Buyers therefore retain momentum, but confirmation above the descending trendline is still required.
The MACD panel is not visible, so no crossover can be confirmed. A bullish crossover or expanding positive histogram would strengthen the breakout scenario.
Important Key Levels
Immediate support: 4,040–4,052
Deeper demand: 4,015–4,025
Trendline resistance: 4,105–4,115
First upside zone: 4,112–4,120
Higher resistance: 4,158–4,168
Trading Scenario
My primary view remains bullish while XAUUSD holds above the rising trendline and the 4,040–4,052 support zone.
A controlled retracement into this confluence, followed by bullish rejection and RSI holding above 50, could support another attempt toward 4,105–4,115.
Sustained H1 acceptance above the descending trendline, ideally accompanied by bullish MACD confirmation, may open the way toward 4,158–4,168.
Buy/Sell Condition
Bullish condition: Price defends 4,040–4,052 and confirms an H1 breakout above 4,115.
Bearish condition: Sustained acceptance below 4,040 would weaken the immediate structure and expose the deeper demand around 4,015–4,025.
Overall View
The EMA recovery, rising trendline and RSI above 50 currently support buyers, but XAUUSD is still trading beneath a major descending resistance line.
With GDP and PCE approaching, I prefer to wait for confirmed acceptance rather than anticipate the initial volatility.
Do you expect XAUUSD to retest 4,050 before breaking higher, or move directly toward 4,115?  Long
Long
New week requires breakout; key is bigger trendline.Gold begins the new trading week at a critical technical point, where both buyers and sellers are fighting for control. Although the recent correction has eased bullish momentum, the overall recovery structure remains valid as long as price continues to respect the ascending trendline and nearby support.
The 4025–4040 support zone is now the key area to watch. Holding above this region would preserve the series of higher lows and provide buyers with another opportunity to build momentum. At the same time, price is approaching the higher-timeframe descending trendline, which has capped every recovery over the past several weeks.
For the bullish outlook to gain stronger confirmation, gold must accomplish two things: hold above the current support and ascending trendline, then break decisively above the major descending trendline. A confirmed breakout would shift market sentiment and open the way toward the 4085–4095 resistance, followed by the larger 4110–4120 resistance zone.
For now, the preferred strategy is to remain buy-biased on pullbacks while price stays above support. However, patience is essential. The higher-probability trade will come once the market confirms a breakout above the larger trendline instead of anticipating the move too early.
📍 Key Levels
🔹 4025–4040
Primary support zone and ascending trendline support.
🔹 4085–4095
First resistance and breakout confirmation area.
🔹 4110–4120
Major resistance and higher-timeframe descending trendline.
🔹 4155–4165
Medium-term bullish target if the breakout succeeds.
🔹 Below 4000
A sustained break below this level would invalidate the current recovery structure.
✅ Preferred Scenario
Price continues holding above 4025–4040 support.
The ascending trendline remains intact.
Wait for a confirmed breakout above the higher-timeframe descending trendline before adding Buy positions.
Upside targets remain 4085–4095, followed by 4110–4120 if bullish momentum strengthens. Long 
 Long
Long
 Short
Short
XAUUSD Supply Zone Test & Potential Bearish Pullback
Gold (XAUUSD) recently staged an aggressive, impulsive breakout to the upside, breaking out of a descending corrective channel. However, momentum has visibly slowed down as price pushes into a prominent overhead Supply Zone (4,088 - 4,096 area). A short-term correction back down toward key support levels is expected if resistance holds firm.
Technical Breakdown
Breakout & Impulsive Move:
Price broke out strongly from the downward sloping parallel channel (highlighted in red), clearing previous structural swing highs near 4,047 with high volume.
Supply Zone & Momentum Loss:
After reaching recent highs near 4,115, price met strong selling pressure. The recent re-test into the highlighted gray supply zone around 4,090 - 4,095 shows fading bullish momentum (highlighted yellow circle), indicating buyers are losing traction.
Price Action Pattern:
Price is currently consolidating right below key resistance at 4,080 - 4,090, forming lower highs on lower timeframes after the initial strong impulse.
Trading Scenario & Targets
Primary Bias: Bearish Pullback / Retest
Invalidation / Breakout Level: A strong 30m candle close above 4,095 - 4,100 invalidates the short setup and re-opens targets toward 4,115+.
Downside Targets:
First Support: 4,047.13 (Broken channel resistance turned support / previous structure high)
Second Support: 4,026.98 (Major demand level / key swing low) Short 
 Long
Long
 Education

Trading Masterclass #1Institutional trading means trading like hedge funds, banks, prop firms, and professional desks. They do not trade based on emotions, random tips, or gambling. They use systems, probabilities, risk control, position sizing, discipline, and psychology.
Retail traders often lose because they focus only on “entry.” Institutions focus on:
Risk Management
Capital Protection
Position Sizing
Probability
Psychology
Consistency
Repeatable Edge
In options trading, if you think like institutions, your results can improve significantly  Education

 Education

Education

Education

BTC/USD - Order Block Hold Before Next Bullish ExpansionOverview:
Bitcoin ( BITSTAMP:BTCUSD ) is currently consolidating at a critical higher-timeframe support zone after a sharp corrective pullback. We are testing the H1 Order Block (H1-OB), which previously acted as an accumulation area following a local range breakout.
Technical Breakdown:
Demand Zone Hold (H1-OB): Price has tapped into the H1 Order Block near $63,800. We are witnessing early signs of lower-timeframe stabilization and rejection wicks within this demand block.
Liquidity & Structure: After breaking out from the prior consolidation range, price swept liquidity and pushed higher before pulling back into this key interest zone. Holding above the bottom level of this Order Block keeps the immediate bullish market structure intact.
Trade Setup: As long as price holds above the lower boundary of the H1-OB, we expect a continuation move upward to sweep the local swing high resistance marked as TARGET.
Trade Execution Plan:
🟢 Entry Zone: Around current price level / H1 Order Block (~$63,500 – $64,000)
🛑 Stop Loss (SL): Placed strictly below the recent swing low / bottom of the H1-OB (~$62,700 – $62,900)
🎯 Take Profit (TP / Target): Previous swing high resistance line (~$66,500 – $67,000)
⚠️ Disclaimer: Financial markets carry risk. Always manage your position sizing and risk properly. Wait for lower-timeframe confirmation (like an M5/M15 MSS) before taking the entry. Long 
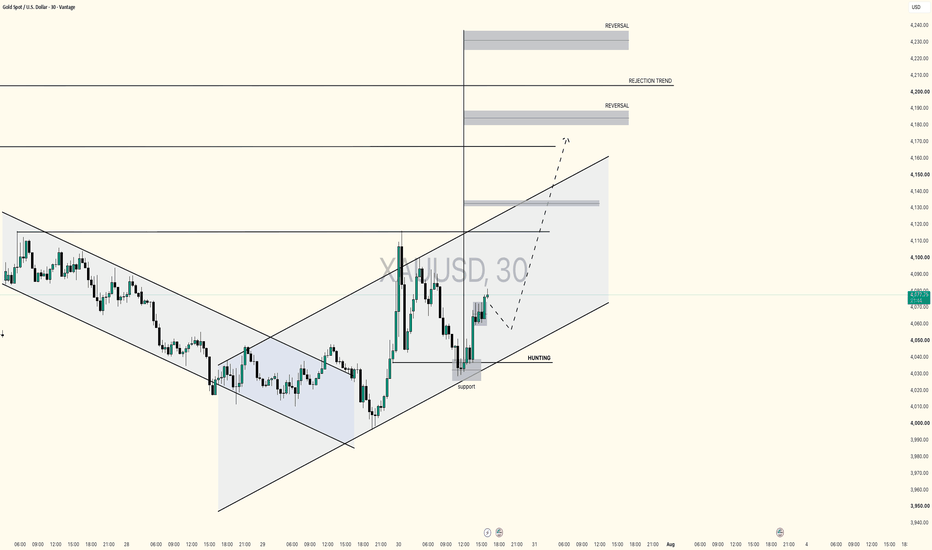
Gold (XAUUSD): Re-testing Key Demand Zone – Potential Push to ?Technical Breakdown
Change of Character (CHOCH): Price previously signaled a structural shift to the upside by breaking recent swing highs around the $4,050 zone.
Demand Zone Confluence: The price has returned to retest the 1H Demand Zone ($4,037 – $4,060).
Dynamic Support: An ascending Trendline Support aligns directly with the bottom of this demand zone, providing a strong double-confluence area for buyers to enter.
Previous Structure: The chart shows a completed bearish Head & Shoulders pattern earlier in the week, followed by liquidity sweeps and a strong bullish impulsive wave.
Trade Execution Strategy
Bias: Bullish 🟢
Entry Zone: $4,040.00 – $4,055.00 (Inside the Demand Zone / Trendline Touch)
Take Profit 1 (TP1): $4,080.00 (Recent lower high / internal liquidity)
Take Profit 2 (TP2): $4,110.00 (Equal highs / main target zone)
Stop Loss (SL): Below $4,030.00 (Below the demand zone and trendline structure)
Risk Disclaimer
Trading spot gold involves substantial risk of loss. Always manage your position size according to your risk tolerance and wait for lower-timeframe confirmation (e.g., 5m/15m bullish engulfing or CHOCH) before entering. Long 
Long 
Adani Green at a Critical Inflection PointAdani Green Energy has reached one of the most decisive zones on its long-term monthly chart. After respecting its rising support trendline for several years, the stock is now trading near the intersection of a long-term ascending support and a falling resistance trendline. This creates a high-probability decision point where the next major trend is likely to begin.
The chart also illustrates a possible ABCDE corrective pattern, with waves (a), (b), (c), and (d) already completed. If the current move forms the final (e) wave while holding the long-term support, the stock could complete its correction and prepare for a fresh bullish cycle. However, failure to hold this support would invalidate the bullish setup and open the door for a deeper correction.
🟢 Bullish Scenario
The bullish case remains valid as long as the long-term rising support continues to hold. A decisive breakout above the falling resistance trendline, preferably with strong monthly closing strength and increased volume, would confirm that buyers have regained control.
Bullish Targets:
Target 1: ₹1,620+
Target 2: ₹2,225+
Long-Term Breakout Target: ₹3,000+
A confirmed breakout could mark the beginning of the next long-term uptrend, offering significant upside potential over the coming quarters.
🔴 Bearish Scenario
If the stock fails to sustain above the rising support trendline and breaks below the highlighted support zone, the current bullish structure would weaken considerably. Such a breakdown would indicate that sellers remain in control and the correction is not yet complete.
Bearish Target:
Initial Downside Zone: ₹900
A sustained move below this support could trigger fresh selling pressure and delay any long-term bullish reversal.
🟡 Consolidation Trading Opportunity
Until Adani Green gives a decisive breakout or breakdown, the stock is likely to remain in a consolidation phase between the rising support and falling resistance trendlines. During this period, swing traders can capitalize on short-term price movements by buying near the support zone and booking profits near the resistance zone, while maintaining strict stop-loss discipline.
However, traders should avoid taking aggressive positional bets until the stock confirms its next major direction. A breakout above the resistance could trigger a fresh bullish rally, whereas a breakdown below support may lead to a deeper correction. Until then, range-bound (consolidation) trading remains the preferred strategy.
Trading Strategy
This is not an ideal level to chase aggressively. Conservative traders should wait for a confirmed breakout above the descending resistance before initiating long positions. On the other hand, a breakdown below the rising support would shift the technical bias to bearish and warrant caution.
Conclusion
Adani Green is approaching a make-or-break technical zone where both bullish and bearish possibilities exist. The next major move will likely be decided by whether price breaks above the falling resistance or falls below the long-term rising support. Until confirmation arrives, traders should remain patient and allow the market to reveal its direction. AXIS BANK | Swing Long Setup 📌 AXIS BANK – Wave 2 Completion & Potential Bullish Wave 3 Ahead 🚀
Axis Bank appears to have completed its corrective Wave 2 and may now be gearing up for the next impulsive rally — Wave 3, which is often the strongest in Elliott Wave theory.
---
🧩 Elliott Wave Structure
Wave 1: Strong rally from the lows earlier in 2025, showing clear bullish intent.
Wave 2: Completed as a complex W–X–Y correction , ending around the 50% Fibonacci retracement zone (₹1,079), which is a common reversal area in Elliott Wave patterns.
The substructure inside Wave 2 (marked as a–b–c, w–x–y) shows corrective nature, indicating that the broader uptrend remains intact.
---
📈 Current Outlook & Key Levels
Current Price**: ₹1,073 (hovering near 50% retracement level).
Support Zones:
₹1,051 (38.2% Fib) – minor support.
₹1,005 (23.6% Fib) – strong support and Wave 2 invalidation watch.
Immediate Resistance: ₹1,128 (61.8% Fib).
Breakout Trigger : A sustained close above ₹1,182 will confirm strength and open the path for higher targets.
---
🎯 Upside Targets (Based on Fib Extensions of Wave 1)
Target 1: ₹1,238 (100% projection).
Target 2: ₹1,321 (127.2% extension) – strong Wave 3 projection zone.
---
🔍 Indicators & Market Context
✅ Price has respected the 50% Fibonacci retracement, showing early signs of buyers stepping in.
✅ Moving averages are starting to flatten, and a bullish crossover could be on the way once price pushes above ₹1,128.
✅ Volume remains moderate; a spike in buying volume on breakout would add confidence to the bullish scenario.
---
⚠️ Risk Management
> If price drops below ₹1,005 (Wave 2 low), the bullish Elliott count would be invalidated, and deeper correction may follow. In such a case, it's better to step aside and wait for a fresh setup.
---
📝 Summary
> Axis Bank seems to have finished its Wave 2 correction and is preparing for a possible Wave 3 rally. A breakout above ₹1,182 could start the next bullish leg towards ₹1,238 and ₹1,321. Until then, watch the key supports at ₹1,051 and ₹1,005.
---
**Disclaimer:**
This analysis is for educational purposes only and is not financial advice. Please consult a SEBI-registered financial advisor before making any investment decisions.
#AxisBank #ElliottWave #SwingTrading #Wave3 #PriceAction #TradingViewIndia #TechnicalAnalysis
---  Long
Long
Long 
Nifty 50 Trade Plan [31.07.2026: Friday]Probable Scenario Analysis and Trade Plan for the Nifty 50 Index NSE:NIFTY for the 31st of July, 2026. The day is Friday.
🟢 Bullish Scenario
Presently, the price is in the bullish zone. If the price stays above 24300, then stay bullish. Take bullish trades only. Every down move should be considered as an opportunity to go long. The probable bullish targets above 24300 would be - 24350 and 24400. There will be strong resistance at 24400. Next, if the price sustains above 24400, then the probable bullish targets would be - 24450 and 24500. There will be strong resistance at 24500. If the price breaks out above 24500, then the probable bullish targets would be 24550 and 24600.
🔴 Bearish Scenario
Presently, there is no bearish setup. Doubt every down move. There is a strong support zone (SSZ) in the area of (24250 - 24200). However, if the price breaks down below 24200, then a weak bearish scenario would emerge. The probable weak bearish targets below 24200 would be - 24150 - 24100. There will be strong support at 24100. Next, if the price decisively breaks down below 24100, then there will be strong selling. The probable bearish targets below 24100 would be 24050 and 24000. Level 24000 will be a strong support level. Lastly, if the price breaks down below 24000, then the probable bearish targets would be - 23950 and 23900.
🟡 No Trading Zone (NTZ): (24300 - 24200).
⏺ Range of Consolidation (ROC): (24400 - 24100).
Here, 24250 is the median of the ROC. The median works like an intraday sentiment evaluator. The price trading above the median would offer bullish sentiment, while the price trading below the median would trigger bearish sentiment within the ROC.
● Event
It is the last day of the week. Geopolitical issues are the only barrier. There is no other event or holiday.
● Intraday, Weekly, and Monthly Bias
Establish bias with respect to the opening price (of the particular session - Intraday, Weekly, and Monthly). If the price sustains above the opening price, then don't think of shorting. Look for bullish trades only. On the contrary, if the price sustains below the opening price, then don't think of going long. Look for bearish trades in that case.
● Top-Down Analysis
- Monthly TF: The monthly candle is a green spinning top. As compared to the candle of the previous month, there is a higher-highs and lower-lows structure. Maybe the price is trying to emerge out of the five months of sideways consolidation. However, it is not yet sustainable, as every monthly candle for the five months has been a spinning top. Observable major resistance is 24500. Observable major support is 24000. The view is indecisive to bullish.
- Weekly TF: The market has been range-bound for 7th week. It is a flat correction. Thus, there is no observable trend. For a clear trend analysis, it is necessary for the market to either break out above 24500 (bullish scenario) or break down below 24000 (bearish scenario). However, this week's candle is a bullish marubozu so far. It almost engulfed the previous week's red marubozu. In the coming two days, if the price stays above 24250, then there is a higher chance that the market might reach 24500 very soon. The view is indecison.
- Daily TF: We can observe four days of bull run with massive gaps. Right now there are multiple unfilled gaps. If the market forgets these gaps, then in the future it might convert into runaway gaps. Taking into consideration of the activity of the past four days, the market has made higher-highs and lower-lows structure. There is no sign of negativity. The unfilled GAPs are the only fear. The level 24100 is now a major support line. Stay bullish unless the level 24100 is broken. The first major resistance is 24400. There is an unfilled gap near 24400. Next, if the price decisively trades above 24400, then level 24500 is also possible. The view is bullish.
- 30-minute TF: Taking into consideration of the activity of the past four days, the market has made higher-highs and lower-lows structure. There is no sign of negativity. A major support zone is (24150 - 24100). Take no bearish trade unless the level 24100 is broken down. Stay bullish if the price sustains above 24250. The first major resistance would be 24400. The second major resistance would be 24500. The view is bullish.
● Disclaimer + End Note
- All the analyses would fail in the case of a major gap up, gap down, or price structure anomaly. Thus, practice PRAGMATISM in the live session.
- Trade only if there is a set-up. Remember, not trading is an extension of the trading activity.
- Mark your points. Trade your points. Price is GOD. Anything can happen in the markets. Thus, trade what you see, not what you believe.
- Always PRACTICE RISK MANAGEMENT. Always PROTECT YOUR CAPITAL. Be RESPONSIBLE.
- Be Strategic. Be Courageous. Be Patient. Be Wise.
- Every day is a new day. Thus, do not carry the baggage of past successes or failures. Leave the gardens of winning and losing. Establish yourself in equanimity. Always think from a new perspective.
- Let the joy of trading drive your effectiveness, not greed or fear. Believe in Possibilities.
Happy Trading!  Short
Short
Bitcoin (BTCUSD): Key Demand Level Retest & Target HorizonBTC/USD: Long Opportunity from Demand Zone Retest
Market Overview:
Bitcoin ( BITSTAMP:BTCUSD ) on the 1-Hour timeframe presents a compelling long setup as price action consolidates following a strong recovery from the lower $62,600 support region.
After completing a Head & Shoulders pattern and an upward channel break earlier in the week, price established a firm higher-low structural trendline. We are now observing consolidation right below local resistance.
Technical Breakdown:
Current Price Action: Hovering near $64,450, under immediate resistance.
Key Demand Zone: $63,800 – $64,150 (Purple Support Box).
Resistance / Target: $64,650 – $64,750.
Trade Plan:
Strategy: Wait for price to pull back into the Demand Zone ($63,800 – $64,150) to fill orders and sweep liquidity. Look for bullish confirmation candles (hammer, bullish engulfing, or lower timeframe market structure shift) within this box.
Entry: Near $63,900 – $64,100 (inside the Demand Zone).
Target (TP): $64,650 – $64,750 (Resistance Line).
Invalidation / Stop Loss (SL): Below $63,500 (A breakdown below the SMC trendline invalidates this bullish outlook). Long 
Long