Long
Long
#NIFTY Intraday Support and Resistance Levels - 27/07/2026Nifty is expected to open with a gap-up near the 24000 level, supported by positive global cues. However, the index is still trading within a broader consolidation zone, making the opening hour crucial for confirming the next directional move. Traders should wait for a sustained breakout before initiating fresh positions.
If Nifty sustains above 24050 after the opening, traders can consider buying CE options with upside targets of 24150, 24200, and 24250+. A decisive move above this resistance is likely to trigger fresh buying momentum and strengthen the bullish outlook.
On the downside, if Nifty breaks below 23950, traders can consider buying PE options with downside targets of 23850, 23800, and 23750. A breakdown below this support may attract renewed selling pressure and extend the corrective move.
Overall, a gap-up opening near the 24000 level is expected. Traders should avoid chasing the opening move and wait for confirmation above 24050 for bullish trades or below 23950 for bearish trades. As the index remains in a consolidation phase, disciplined risk management and strict stop-losses are recommended until a clear breakout or breakdown is confirmed. #BANKNIFTY Intraday PE & CE Levels(27/07/2026)Bank Nifty is expected to open with a gap-up above the 57000 level, indicating positive sentiment at the start of the session. However, traders should watch for follow-through buying after the initial gap-up, as resistance levels ahead may trigger some profit booking.
If Bank Nifty sustains above the 57050–57100 zone after the opening, traders can consider buying CE options with upside targets of 57250, 57350, and 57450+. A decisive move above 57550 can further strengthen bullish momentum and open the path towards 57750, 57850, and 57950+.
On the downside, if Bank Nifty fails to hold above 57000 and slips below 56950, traders can consider buying PE options with downside targets of 56750, 57650, and 57550. A further breakdown below 56450 would strengthen the bearish outlook with targets of 56250, 56150, and 56050.
Overall, a gap-up opening above the 57000 level is expected. Traders should avoid chasing the opening move and wait for confirmation above 57050–57100 before initiating fresh long positions. If the index fails to sustain the gap-up and breaks below key support levels, a reversal towards lower levels may unfold. Maintain strict stop-losses and focus on confirmation before taking any trade. BTC/USD Bullish Reversal: Channel Support Bounce
Bitcoin (BTC/USD) is demonstrating a strong bullish response off a major support junction around $63,100 – $63,700. After sweeping lower-timeframe liquidity and tapping directly into key market structure, the convergence of price action, volume imbalances, and momentum indicators strongly points toward a bullish continuation.
Detailed Technical & SMC Breakdown
Demand Zone & Order Block Defense:
Price is holding the lower boundary of the overarching ascending channel.
A clear Bullish Order Block (OB) at $63,130 is providing a strong structural demand floor for buyers.
Fair Value Gap (FVG) Mitigation:
The drop mitigated the Bullish FVG zone ($62,471 – $63,715), turning a previous market imbalance into active, functional support.
Golden Pocket Confluence:
The ongoing bounce aligns precisely with the 0.618 Fibonacci retracement level, marking an optimal trade entry (OTE) zone.
Momentum & Indicator Divergence:
RSI: A distinct Bullish Divergence on lower timeframes indicates seller momentum is exhausted.
MACD: A fresh Bullish Crossover below the zero line accompanied by expanding green histogram bars confirms a shift in trend direction.
Key Price Levels
Invalidation: $62,471 (A clean loss of this level invalidates the bullish setup)
Target 1: $64,859 (Immediate Resistance & Liquidity Target)
Trading Plan & Outlook
As long as BTC maintains acceptance above the $63,715 support zone, the path of least resistance remains upward. Look for a sustained breakout above $64,859 to confirm follow-through toward the upper channel boundary.
 Long
Long
 Short
Short
BTC/USD: Order Block Reaction & CHOCH Signal Potential Drop to ?Overview
Bitcoin ( BITSTAMP:BTCUSD ) on the 1-Hour timeframe is displaying clear signs of bearish market structure shift (MSS) following a breakdown from its local high and top downward channel. Price recently experienced a Change of Character (CHOCH) to the downside around $64,600 and is currently consolidating beneath a newly formed supply zone (teal box).
A rejection from this immediate supply zone points toward a high-probability short opportunity targeting the Sell-Side Liquidity (SSL) rested below $63,600.
Key Technical Factors & SMC Elements
Market Structure:
Downward Channel Breakdown: BTC completed a downward channel corrective phase, which broke down aggressively into a broader trend reversal.
MSS & CHOCH: A clear Market Structure Shift (MSS) was followed by a bearish CHOCH (Change of Character) at ~$64,600, confirming that sellers are firmly in control.
Supply Zone / Resistance:
The teal zone (~$64,050 – $64,200) acts as local bearish supply/order block where price is currently finding resistance.
Liquidity Targets:
SSL (Sell-Side Liquidity): Located around $63,600, marked by recent swing lows (main target).
BSL (Buy-Side Liquidity): Resting higher at ~$65,750, acting as the macro invalidation level for medium-term shorts.
Trading Scenarios
📉 Primary Scenario: Bearish Continuation (Short Entry)
Entry: Rejection / Bearish price action inside the supply zone ($64,000 – $64,200).
Stop Loss (SL): Above the local consolidation high / supply box boundary (~$64,350 – $64,450).
Take Profit 1 (TP1): $63,600 (Sweep of SSL).
Take Profit 2 (TP2): $63,200 (Psychological / Key extended support). Short 
Nifty 50 Weekly Analysis [27 - 31 July, 2026]Probable Scenario Analysis and Trade Plan for the Nifty 50 Index NSE:NIFTY for the Week of 27- 31 July 2026.
🟢 Bullish Scenario
Nifty 50 is in an indecisive zone. The main trend is bearish, but there is a bounce. The zone (23900 - 23800) is a strong resistance zone (SRZ). It is difficult for the price to break out of this SRZ. However, if the price decisively sustains above the SRZ, then a weak bullish move will generate. The probable weak bullish targets above 23900 would be - 23950 and 24000. At 24000, the price will experience strong resistance. If the price starts to trade above 24000, then the price will enter into a strong bullish move. The probable strong bullish targets above 24000 would be - 24050 and 24100. Next, if the price starts to trade above 24100, then a super strong bullish move would emerge. The probable super strong bullish targets above 24100 would be - 24150, 24200, and 24250.
🔴 Bearish Scenario
Presently, the price is in the bearish to indecisive zone. A weak support zone (WSZ) is formed at (23750 - 23700). If the price decisively breaks down below the WSZ (or the 23700 level), then bearish sentiment will trigger. Weak and underconfident bearish targets below 23700 would be - 23650 and 23600. There will be weak support at 23600. Next, if the price decisively breaks down below 23600, then a strong bearish move will be triggered. The probable strong bearish targets below 23600 would be - 23550 and 23500. The price will receive strong support at 23500. Next, if the price breaks down below 23500, then super strong bearish sentiment will be triggered. The probable bearish targets below 23500 would be 23450 and 23400.
🟡 No Trading Zone (NTZ): (23900 - 23700).
Presently, the price is in the NTZ. Only a breakdown or breakout would trigger a tradable condition. If the price remains within NTZ, then avoid trading at all costs.
⏺ Range of Consolidation (ROC): (24000 - 23500).
Here, 23750 is the median of the ROC. The median works like an intraday sentiment evaluator. The price trading above the median would offer bullish sentiment, while the price trading below the median would trigger bearish sentiment within the ROC.
● Event
There are no holidays this week either in India or in the U.S. A high-impact event is on 29th of July, 2026 (Wednesday 11:30 PM IST). The high-impact event is "FED INTEREST RATE DECISION." Next, there will be 2 monthly expiries (both NSE and BSE F&O contract expiries). This will happen on Tuesday (28 July: NSE) and Thursday (30 July: BSE). This week will be a CRAZY WEEK. Thus, there are three events - Fed Interest Rate Decision, NSE F&O Contract Expiry, and BSE F&O Contract Expiry. Lastly, geopolitical issues are omnipresent. We can definitely experience major price anomalies. Therefore, trade with caution. If possible, avoid trading this week.
● Intraday, Weekly, and Monthly Bias
Establish bias with respect to the opening price (of the particular session - Intraday, Weekly, and Monthly). If the price sustains above the opening price, then don't think of shorting. Look for bullish trades only. On the contrary, if the price sustains below the opening price, then don't think of going long. Look for bearish trades in that case.
● Top-Down Analysis
- Monthly TF: The price has been trapped in the range of (24000 - 23500) for the past 5 months. The candles of the past 4 months are either DOJI or Spinning Tops. Thus, there is no trend for the past 5 months. The view is highly indecisive.
- Weekly TF: This week, the price gave a breakdown from the rounded top structure formed for the past five weeks. The present week's candle is a red bar. Strong resistance is 24000. It is recommended to take no bullish trade unless the price trades and sustains above 24000. The view is indecisive to bearish.
- Daily TF: The price is forming a Pennant pattern since Mar 2026. Level 24000 is strong resistance. Bullish sentiment can only emerge if the price sustains above 24000. Level 23500 is the last support. If the price breaks down below 23500, then there will be a sharp fall. The view is bearish to indecisive.
- 30-minute TF: The price gave a breakdown from the head and shoulder pattern. Maybe there will be a minor pullback or a dead cat bounce. The price is in a lower-lows and lower-highs structure. There is no sign of bullishness. Bullish sentiment can only emerge if the price sustains above 24000. Level 23500 is the last support. The view is indecisive to bearish.
● Disclaimer + End Note
- All the analyses would fail in the case of a major gap up, gap down, or price structure anomaly. Thus, practice PRAGMATISM in the live session.
- Trade only if there is a set-up. Remember, not trading is an extension of the trading activity.
- Mark your points. Trade your points. Price is GOD. Anything can happen in the markets. Thus, trade what you see, not what you believe.
- Always PRACTICE RISK MANAGEMENT. Always PROTECT YOUR CAPITAL. Be RESPONSIBLE.
- Be Strategic. Be Courageous. Be Patient. Be Wise.
- Every day is a new day. Thus, do not carry the baggage of past successes or failures. Leave the gardens of winning and losing. Establish yourself in equanimity. Always think from a new perspective.
- Let the joy of trading drive your effectiveness, not greed or fear. Believe in Possibilities.
Happy Trading! The Hidden Psychology of Support and ResistanceLook at almost any price chart and you will find them.
A level where price repeatedly stops falling.
Another area where rallies keep losing momentum.
Sometimes price breaks through these levels and continues moving. Other times, it breaks the level for a few moments and then quickly reverses.
Most traders know these areas as support and resistance.
But support and resistance are not really about lines on a chart.
They are about people.
Behind every important price level is a story of traders who bought, sold, took profits, got trapped, or are still waiting for another opportunity.
Once you understand the psychology behind these levels, charts can start to look very different.
Why Do Support and Resistance Exist?
Markets are driven by decisions.
Every trader has a reason for entering a position.
Some believe price will rise.
Others believe it will fall.
When enough traders make similar decisions around the same price, the market begins to react there.
This creates areas of support and resistance.
Support forms when buying interest becomes strong enough to slow or stop a decline.
Resistance forms when selling pressure becomes strong enough to slow or stop a rally.
The level itself has no power.
The people trading around it create the reaction.
The Psychology Behind Support
Imagine a stock falls from ₹500 to ₹400.
At ₹400, many traders believe the stock has become attractive.
Some begin buying.
Others who previously missed the move decide to enter.
Short sellers may start taking profits.
All of this creates additional demand.
Price begins to stabilize.
The market has found temporary support.
Now imagine price rallies to ₹450 before falling back to ₹400.
Traders who watched the previous bounce remember what happened.
They may think:
"If price reaches ₹400 again, I'll buy."
This creates the possibility of even more demand.
The more traders who remember the same level, the more important that area can become.
The Psychology Behind Resistance
Resistance works in the opposite way.
Imagine a stock previously rallied to ₹500 but then experienced a sharp decline.
Many traders who bought near ₹500 may still be holding losing positions.
When price eventually returns to ₹500, some of these traders may decide to exit at breakeven.
Other traders may see the previous rejection and begin selling.
Short sellers may also enter.
Suddenly, selling pressure increases.
Price struggles to move higher.
The previous high has become a psychological barrier.
Why Previous Highs and Lows Matter
Traders remember prices.
A previous high represents a place where buyers failed to push the market higher.
A previous low represents an area where sellers were unable to continue pushing price lower.
When price returns to these areas, traders remember what happened before.
This memory influences future decisions.
That is why previous highs and lows often become important reference points.
The market doesn't have a memory in the human sense.
But the participants do.
Support and Resistance Are Zones, Not Exact Lines
One of the biggest mistakes beginners make is treating support and resistance as perfectly precise lines.
Real markets rarely behave that way.
A support level at ₹100 doesn't mean price must reverse exactly at ₹100.00.
Price may briefly move to ₹99.50 or ₹98.80 before buyers step in.
The same applies to resistance.
This is why it is often better to think in terms of **zones** rather than exact prices.
The goal is not to predict the exact turning point.
The goal is to identify an area where the balance between buyers and sellers may change.
When Support Becomes Resistance
One of the most interesting psychological shifts occurs when support breaks.
Imagine hundreds of traders bought around ₹100.
Then price suddenly falls below ₹100.
Those traders are now holding losing positions.
If price later returns to ₹100, some may want to exit their trades and reduce their losses.
At the same time, new sellers may view ₹100 as an opportunity to enter short positions.
The result?
A level that previously attracted buyers may now attract sellers.
Old support can become new resistance.
This isn't magic.
It's a change in trader psychology.
Why Breakouts Can Be So Powerful
A breakout represents a shift in expectations.
When price breaks a major resistance level, traders who were waiting on the sidelines may finally enter.
Short sellers may be forced to close their positions.
Momentum traders may join the move.
The combination of new buying and short covering can create a powerful rally.
The opposite can happen when support breaks.
Long positions may be stopped out.
New short sellers may enter.
Selling pressure increases.
This is why important support and resistance levels can produce strong moves when they finally break.
The Psychology of Trapped Traders
Some of the strongest market moves happen when traders become trapped.
Imagine price breaks above resistance.
Traders buy the breakout expecting a rally.
But instead of continuing higher, price falls back below the level.
Suddenly, those breakout buyers are trapped in losing positions.
If price continues falling, they may rush to exit.
Their selling adds further downward pressure.
This can create a sharp reversal.
The same process works in reverse after a false breakdown.
Understanding trapped traders can help explain why markets sometimes move so quickly after failed breakouts.
Strong Levels Are Often Tested Multiple Times
A support or resistance zone that has been respected several times can become psychologically important.
But there is an interesting paradox.
The more often a level is tested, the more attention it receives.
More traders begin watching it.
More orders accumulate around it.
Eventually, the level may become vulnerable to a breakout.
This is why traders should never assume that a level will hold simply because it has worked several times before.
Markets constantly change.
The Hidden Story Behind Every Level
The most useful way to think about support and resistance is to ask:
Who is trapped here?
Who is waiting to enter?
Who is taking profits?
Where are stop losses likely to be placed?
These questions reveal the psychology behind the chart.
A support level isn't just a line where price bounced in the past.
It is an area where traders have memories, expectations, and positions.
And those decisions can influence what happens when price returns.
Final Thoughts
Support and resistance are among the oldest concepts in technical analysis.
Yet their real power comes from something much deeper than chart patterns.
They work because traders remember.
They work because traders react.
They work because fear, greed, hope, and regret influence decisions around important prices.
A level becomes significant when enough market participants believe it is significant.
That belief creates orders.
Those orders create reactions.
And those reactions create the patterns we see on our charts.
So the next time you draw a support or resistance line, don't just ask:
"Will price bounce here?"
Ask a better question:
"What are traders likely to think and do when price reaches this area?"
Because behind every support and resistance level, there is a psychological battle.
And understanding that battle may be far more valuable than the line itself.
Nifty 50 Weekly Outlook: Bullish or Bearish Ahead?Disclaimer: This analysis is for educational and informational purposes only. It is based on technical analysis and should not be considered financial or investment advice. Always conduct your own research and use appropriate risk management before making any trading or investment decisions.
The Nifty 50 ended the week on a cautious note, slipping below key short-term moving averages while finding support near an important demand zone around 23,650–23,700. Although buyers managed to defend this level, the overall price structure remains mixed, suggesting that the coming week could be decisive for the index.
This analysis is based purely on price action, moving averages, RSI, volume, and support-resistance levels observed on the Daily, 4-Hour, and 1-Hour charts.
Nifty 50 Technical Overview
The broader market structure continues to show signs of consolidation with a slightly negative bias. The index has repeatedly respected the 23,650–23,700 support zone , but it is also struggling to move above the nearby resistance levels.
On the daily timeframe, Nifty is trading below its short-term moving averages, indicating that bullish momentum has weakened. At the same time, sellers have not yet managed to force a decisive breakdown below support, keeping the market within a defined trading range.
As long as the index remains inside this range, traders may continue to witness volatile two-way price movement.
Daily Chart Analysis
The Daily chart reflects a cautious outlook.
Key observations include:
Nifty continues to hold above the 23,650–23,700 support zone.
Price is trading below important short-term moving averages, indicating near-term weakness.
The Relative Strength Index (RSI) remains below the 50 mark, suggesting momentum currently favors the sellers.
The longer-term trend remains neutral as the index is trading between major support and resistance levels.
Although support has not been broken, buyers will need stronger participation to regain control.
4-Hour Chart Analysis
The 4-hour timeframe provides additional confirmation of weakening momentum.
Current observations:
Price is trading below multiple moving averages.
RSI has moved into the weaker zone, reflecting declining buying strength.
The recent decline has brought the index back to a major horizontal support area.
This support becomes an important reference point for the coming week. A sustained move below it could increase selling pressure, while another successful defense may lead to a technical pullback.
1-Hour Chart Analysis
The shorter timeframe indicates that buyers have attempted a recovery after the recent decline.
However:
The recovery remains limited.
Lower highs continue to be visible.
RSI has bounced from oversold territory but is still below the neutral 50 level.
This suggests that the recent move appears more like a short-term relief bounce rather than confirmation of a fresh uptrend.
Important Support Levels
The following levels may remain important during the upcoming week:
23,700
23,650
23,500
23,200
A sustained move below 23,650 could increase downside momentum toward lower support zones.
Important Resistance Levels
On the upside, traders may watch:
24,000
24,050
24,130
24,350
A strong close above the 24,000–24,050 region may improve short-term market sentiment.
Possible Scenarios for Next Week
Bullish Scenario
The bullish case may strengthen if Nifty:
Holds above the 23,650–23,700 support zone.
Reclaims the 24,000–24,050 resistance area.
Maintains buying momentum with improving price action.
Under this scenario, the index could attempt to move toward higher resistance levels.
Bearish Scenario
The bearish view may strengthen if:
Nifty fails to sustain above support.
Selling pressure increases below 23,650.
Momentum indicators continue to weaken.
In such a scenario, the index could test lower support zones over the coming sessions.
Key Levels to Watch Next Week
Support Resistance
23,700 24,000
23,650 24,050
23,500 24,130
23,200 24,350
Final View
The technical setup suggests that Nifty 50 is currently trading near an important decision zone. While the index has managed to defend the 23,650–23,700 support area, it continues to face resistance near 24,000–24,050.
Until either of these levels is decisively crossed, the market may continue to witness range-bound movement with stock-specific opportunities. Traders may benefit from closely monitoring price action around these key levels rather than anticipating a directional breakout in advance.
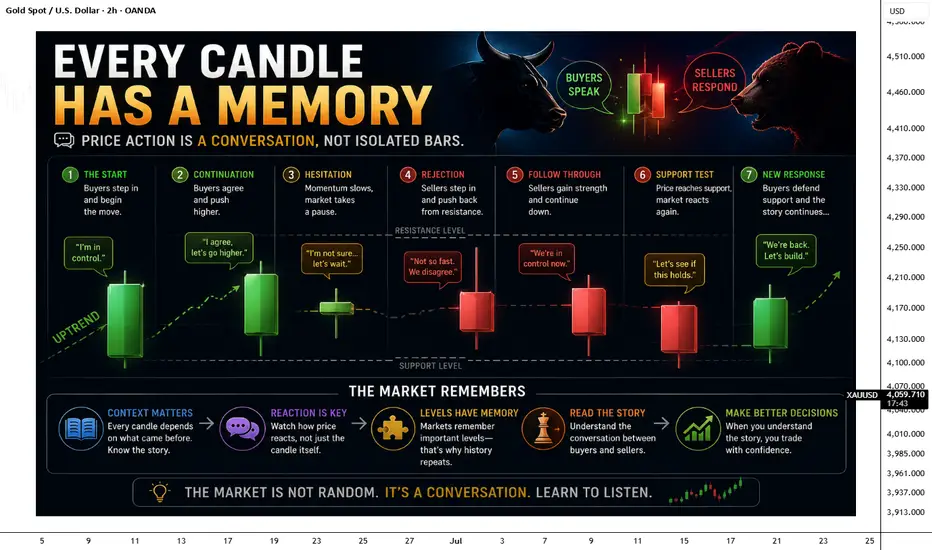
As always, confirmation through price action and proper risk management remains essential before making any trading decisions. Every Candle Has a Memory!When beginners look at a chart, they often treat every candle as a separate event. A green candle means buyers are strong, and a red candle means sellers are in control. While this is partly true, it misses something much more important. **No candle is born in isolation. Every candle is influenced by the candles that came before it. Just like every sentence in a conversation depends on the previous one, every candle continues the story that the market has already been telling.
Imagine walking into a room where two people are arguing. If you hear only the last sentence, you will probably misunderstand the situation. But if you listen from the beginning, every word starts making sense. Price action works the same way. A single candle rarely tells the complete story. It only makes sense when viewed in the context of the candles surrounding it.
The First Candle Starts the Conversation
Every move in the market begins with a reason. It could be buyers becoming more aggressive, sellers taking profits, or important news changing market sentiment. The first candle simply starts the conversation. It asks a question, but it does not always provide the answer.
A large bullish candle, for example, shows that buyers were in control during that period. However, it does not tell us whether buyers will remain strong or whether sellers are waiting at the next resistance level. The next few candles will continue that story.
The Next Candle Responds:
Every new candle reacts to what happened before it.
Suppose a strong bullish candle appears. The following candle now has a decision to make. It can continue moving higher, showing that buyers still have confidence. It can become small, suggesting hesitation. Or it can reverse completely, showing that sellers have entered the market with greater strength.
The second candle is not creating a new story. It is responding to the previous one.
Trends Are Conversations:
A trend is not created by one candle. It is created by hundreds of candles agreeing with each other.
An uptrend is like a group of people repeating the same opinion. Buyers continue making higher highs and higher lows because each candle supports the previous one.
A downtrend works the same way. Every bearish candle reinforces the message that sellers remain in control.
The moment candles stop agreeing with each other, the conversation begins to change.
Rejection Is a Different Opinion:
Sometimes the market suddenly changes its tone.
Imagine a strong bullish candle reaching resistance, followed by a candle with a long upper wick. That wick tells us something important. Buyers tried to push price higher, but sellers refused to accept those prices and forced the market back down before the candle closed.
That single wick becomes a reply in the conversation. It tells us that someone disagreed with the previous move.
This is why experienced traders pay attention to how candles react to one another instead of memorizing individual candlestick patterns.
Memory Creates Context:
Markets remember important levels because traders remember them.
If price was rejected from a certain level yesterday, many traders will watch that same level today. If a breakout failed last week, traders will be cautious the next time price reaches that area.
Although candles do not literally have memory, the people trading the market do. Their decisions are influenced by what happened before, and those decisions shape the next candle.
This is why history often seems to repeat itself.
The Story Is More Important Than the Shape
Many beginners spend months memorizing candlestick patterns like Doji, Hammer, or Engulfing candles. While these patterns can be useful, they become much more meaningful when you understand the story behind them.
A bullish engulfing candle appearing after a long downtrend tells a completely different story than the same pattern appearing in the middle of a sideways market.
The shape of the candle matters, but its location and the conversation leading up to it matter even more.
My Thoughts:
Every candle is a response to what happened before it. Every trend is a conversation between buyers and sellers. Every wick represents an argument, every breakout is a statement, and every reversal is a change in opinion.
The next time you open a chart, don't look at candles as individual bars. Read them like sentences in a story. Because the market is not writing random candles.
By @BrightRally_Research on @TradingView Education 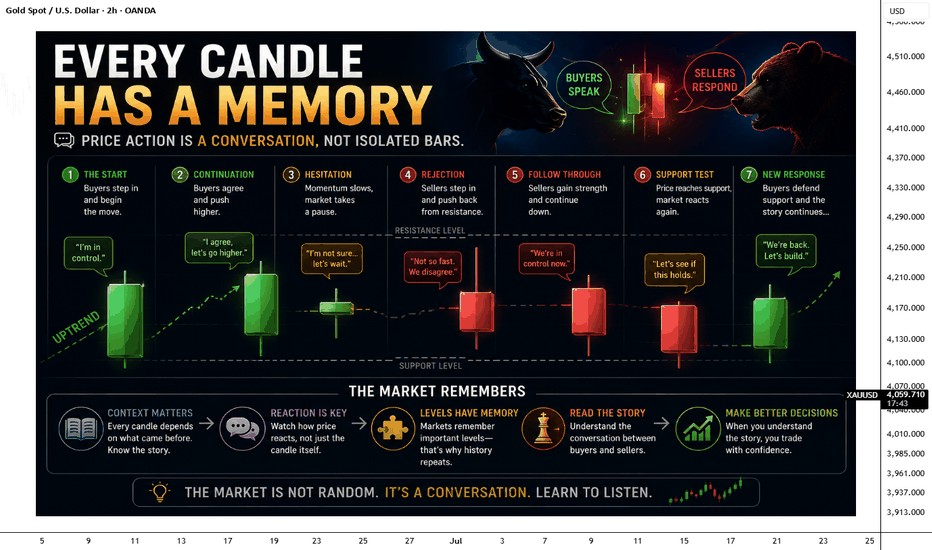
Education
 Education

Education

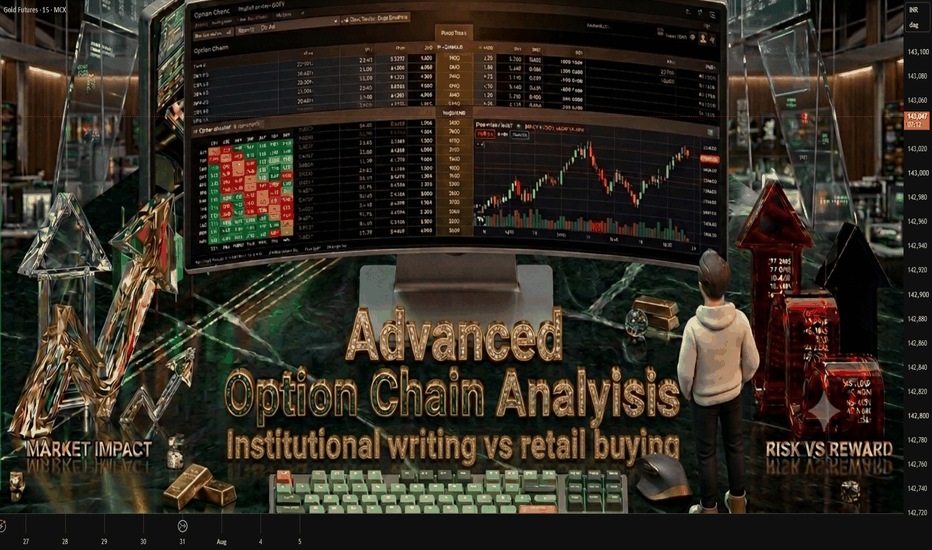
Trading Masterclass #1Institutional trading means trading like hedge funds, banks, prop firms, and professional desks. They do not trade based on emotions, random tips, or gambling. They use systems, probabilities, risk control, position sizing, discipline, and psychology.
Retail traders often lose because they focus only on “entry.” Institutions focus on:
Risk Management
Capital Protection
Position Sizing
Probability
Psychology
Consistency
Repeatable Edge  Education

 Education

Global Financial MarketsGlobal financial markets are systems where people, companies, and governments buy and sell financial assets across the world. They help move money from those who have extra funds to those who need funds.
Main Types of Global Financial Markets:
Stock Markets – Buying and selling shares of companies (e.g., NYSE, NSE).
Bond Markets – Governments and companies borrow money by issuing bonds.
Foreign Exchange (Forex) Markets – Trading currencies like USD, EUR, INR.
Commodity Markets – Trading gold, oil, wheat, etc.
Money Markets – Short-term borrowing and lending.
Derivatives Markets – Contracts based on assets like stocks or currencies.
Importance:
Provide funds for business growth
Support international trade
Create investment opportunities
Help manage financial risks
Affect global economies
Example:
If the US stock market falls sharply, markets in Asia and Europe may also be affected because markets are connected globally.  Education

 Education

Why Breakouts Fail: Understanding Liquidity Traps and False MoveFew things are more frustrating for a trader than watching price break through a major resistance level, entering the trade with confidence, and then seeing the market reverse almost immediately.
The breakout looked perfect.
The momentum was strong.
The candles were convincing.
And then, suddenly, everything changed.
Price falls back below the breakout level, stops are triggered, and traders who entered late are left wondering what went wrong.
This is the reality of trading breakouts.
Not every breakout is the beginning of a new trend.
Sometimes, the market is simply moving toward liquidity.
Understanding this can completely change the way you look at breakouts.
What Is a Breakout?
A breakout occurs when price moves beyond an important level of support or resistance.
For example, price may repeatedly struggle to move above a resistance zone.
Eventually, buyers push through that level.
Traders watching the chart see the breakout and begin entering long positions.
Others who were holding short positions place their stop losses above the same resistance.
Suddenly, there are many orders concentrated around one area.
This is where liquidity becomes important.
Why Liquidity Matters
Markets need liquidity to execute large orders.
Large participants cannot always enter or exit positions whenever they want. They need enough buying or selling activity on the opposite side.
Obvious chart levels often contain large concentrations of orders.
These can include:
Stop losses
Breakout orders
Limit orders
Short covering
Long liquidations
Previous highs and lows are especially important because many traders naturally place their orders around these levels.
When price moves toward these areas, trading activity can increase sharply.
The Anatomy of a Liquidity Trap
Imagine a stock has been rejected several times near ₹1,000.
Traders identify ₹1,000 as resistance.
Some traders place short positions near the level.
Others wait for a breakout.
Breakout traders place buy orders above ₹1,000.
Short sellers place stop losses above the same area.
Now there is a large concentration of orders above resistance.
Price suddenly breaks above ₹1,000.
The breakout traders enter.
Short sellers are forced to exit.
Buying activity increases.
Everything looks bullish.
But then something unexpected happens.
The buying pressure disappears.
Price falls back below ₹1,000.
The breakout fails.
Traders who entered late are trapped.
This is often called a liquidity trap or false breakout.
Why Traders Get Trapped
The problem isn't always the breakout itself.
The problem is entering without understanding the context.
Many traders see price moving quickly and assume the market must continue in the same direction.
This creates FOMO.
They don't want to miss the move.
So they enter immediately.
But fast price movement does not always mean strong conviction.
Sometimes it simply means the market has reached an area with a high concentration of orders.
The market may need to collect that liquidity before deciding its next direction.
Equal Highs and Equal Lows
Equal highs and equal lows are particularly interesting.
When price reaches the same high multiple times, traders often see a clear resistance level.
They expect another rejection.
At the same time, breakout traders are waiting for price to move above the level.
Both groups create orders around the same area.
This creates a potential liquidity pool.
The same thing happens with equal lows.
A market may briefly move below a series of equal lows, trigger stop losses, and then quickly reverse higher.
This is why experienced traders pay attention not only to support and resistance but also to what orders might be sitting around those levels.
The Breakout Is Not the Confirmation
One of the biggest mistakes traders make is assuming that a breakout automatically confirms a new trend.
It doesn't.
A breakout is simply a change in price location.
What happens next is often more important.
Does price hold above the broken resistance?
Does the market successfully retest the level?
Do buyers continue to step in?
Or does price quickly return to the previous range?
These questions can provide more information than the initial breakout itself.
The Retest Can Reveal the Truth
A common approach is to wait for a retest.
Price breaks above resistance.
Instead of immediately buying, the trader waits.
Price returns to the breakout area.
If the previous resistance now acts as support and buyers defend the level, the breakout may have genuine strength.
But if price falls back into the old range, the breakout may have been a trap.
This doesn't guarantee that every retest will work.
Markets can always surprise us.
But waiting for confirmation can help reduce emotional entries.
Volume Can Add Context
Volume can also help traders understand breakouts.
A breakout accompanied by strong participation may indicate genuine interest.
A breakout with weak participation may deserve more caution.
However, volume should never be used in isolation.
A sudden increase in volume can occur during both genuine breakouts and liquidity grabs.
The key is to combine volume with price action, market structure, and the location of liquidity.
Not Every False Breakout Is Manipulation
It's easy to blame institutions whenever a breakout fails.
But markets are more complicated than that.
Not every failed breakout is a deliberate attempt to trap retail traders.
Sometimes price breaks a level because there simply wasn't enough demand or supply to sustain the move.
Market expectations can change.
News can appear unexpectedly.
Large orders can shift the balance between buyers and sellers.
The important lesson is not to assume manipulation.
Instead, focus on understanding what price is actually doing.
How to Avoid Breakout Traps
There is no perfect method for avoiding every false breakout.
But traders can improve their decision-making by asking a few simple questions:
Where is the nearest liquidity?
Is price breaking an important market structure level?
Has the breakout candle already moved too far?
Is there strong participation behind the move?
Does price hold above the breakout level?
Is a retest confirming the breakout?
What happens if the breakout fails?
These questions encourage traders to think instead of simply reacting.
Final words
Breakouts are exciting because they promise the beginning of a new trend.
But sometimes, the market isn't ready to trend.
Sometimes, price is simply moving toward liquidity.
A breakout can trigger stop losses, attract new traders, and create a burst of momentum—only to reverse moments later.
The best traders don't blindly chase every breakout.
They observe.
They wait.
They look at market structure, liquidity, and price behavior.
Because the real question isn't:
"Did price break the level?"
The better question is:
"What happened after the breakout?"
That is often where the real story begins.
And once you learn to look beyond the breakout itself, you may start seeing the market differently—not as a series of random moves, but as a continuous auction searching for liquidity and balance.
 Education
Long 
EMAMIPAP: Extreme Valuation Dis. Meets Multi-Timeframe Bull. BOOverview :
EMAMIPAP (Emami Paper Mills Limited) is exhibiting an explosive trend reversal on the daily (1D) and weekly (1W) charts, trading near the ₹122.88 level. The stock has delivered staggering momentum (+35.1% in 1 week and +57.4% over 6 months), backed by a massive 380% YoY net income surge and an extraordinary valuation discount relative to its paper sector peers.
1. Technical Analysis and Trend Direction
Trend Alignment: The technical structure reflects strong bullish alignment across higher timeframes. The daily gauge rates a "Strong Buy" (16 buy signals vs. 1 sell), with weekly (1W) and monthly (1M) charts also aligned in "Strong Buy" territory.
Momentum Oscillators: The daily RSI stands at an overbought 88.68 (weekly RSI at 78.5 and monthly RSI at 58.8). While an overbought daily RSI warrants caution for a potential short-term pullback or consolidation, the MACD indicator confirms robust bullish expansion (MACD at 6.52 vs Signal line at 3.14).
Immediate Resistance Levels: Watch ₹133.70 (52-week high) and ₹146.12 (weekly decisive entry level).
Macro Resistance Target: The ultimate multi-year chart ceiling sits at ₹204.95 (2019 onwards yearly range high).
Immediate Support Levels: Watch ₹122.00 (broken swing high resistance turned support) and ₹114.80 (secondary structural support).
Macro Support Levels: Watch ₹81.38 (9-month support) and ₹57.50 (3-month support near the 52-week low of ₹55.00).
2. Fundamental Analysis and Financial History
Earnings & Operational Expansion: TTM Revenue expanded by +6.6% YoY to ₹20.1B, while EBITDA surged +78.5% YoY to ₹2.4B and Net Income exploded +379.9% YoY to ₹937M (diluted EPS up +404.7% to ₹13.57).
Multi-Year Financial Trajectory: After facing revenue headwinds following FY2021 (-16.1% in FY2022, -3.3% in FY2023, and -0.9% in FY2024), revenue has stabilized and returned to positive growth. Free cash flow turned strongly positive at ₹1.16B. Additionally, total debt has been reduced significantly from its FY2018 peak of ₹15.5B down to ₹8.17B.
Deep Valuation Discount: EMAMIPAP is heavily discounted across all key multiples—trading at a P/E of 9.1x (73% discount to the sector median of 32.9), EV/EBITDA of 3.0x (85% discount to the median of 20.4), and P/S of 0.4x (87% discount to the median of 3.2). Overall, it trades at an ~82% discount to its broader sector.
3. Paper Sector Peer Comparison
JKPAPER: Current Price ₹391.55 (+0.58% 1D), Market Cap ₹70.55B, P/E 24.63x, YoY Revenue Growth +6.5%, Analyst Consensus Strong Buy.
WSTCSTPAPR: Current Price ₹560.70 (+2.13% 1D), Market Cap ₹36.10B, P/E 24.59x, YoY Revenue Growth +5.7%, Analyst Consensus Strong Buy.
SESHAPAPER: Current Price ₹229.64 (+4.09% 1D), Market Cap ₹13.91B, P/E 16.76x, YoY Revenue Growth -2.5%, No Consensus Rating.
ANDHRAPAP: Current Price ₹62.08 (+2.83% 1D), Market Cap ₹12.05B, P/E 66.31x, YoY Revenue Growth +10.4%, Analyst Consensus Strong Buy.
Peer Takeaway: While EMAMIPAP is the smallest by market cap (₹7.17B) in this group, it commands the lowest P/E ratio (9.1x) and leads the entire paper sector in 1-week (+35.1%) and 1-month (+39.7%) momentum.
4. Directional Bias and 1-to-3 Year Holding Strategy
Directional Bias: DECISIVELY BULLISH (1-to-3 Year Horizon)
Trade Execution Strategy: Due to the overbought daily RSI (88.68), a minor near-term retest or sideways cooling toward the ₹114.80 – ₹122.00 support band is possible. For a 1-to-3-year investment horizon, phased accumulation within this demand zone offers a high-probability risk-to-reward ratio. A decisive weekly close above ₹133.70 – ₹146.12 will confirm structural price discovery toward the ₹204.95 multi-year target.
Disclaimer: This analysis is for educational purposes only and does not constitute financial advice. Always perform your own research and manage your risk/position sizing accordingly.  Long
Long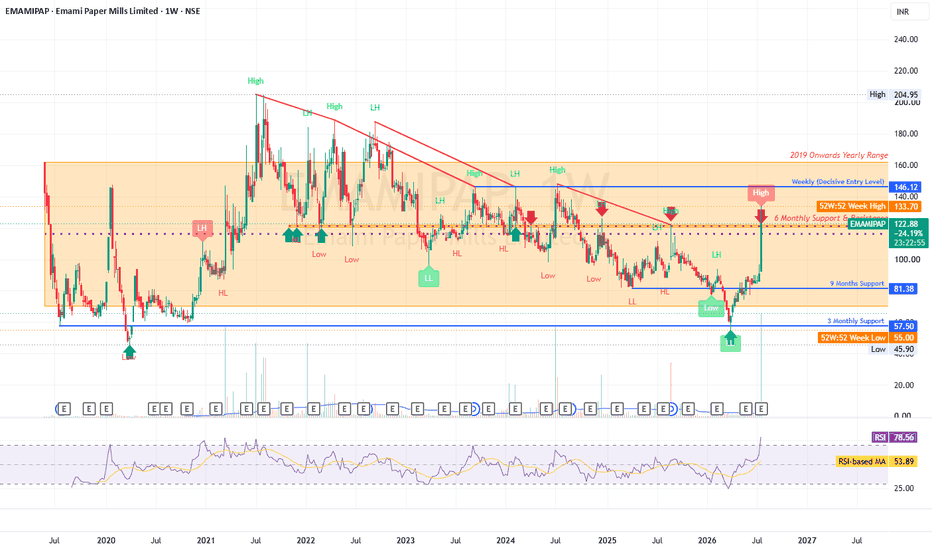
Long