Nifty 50 Trade Plan [14.07.2026: Tuesday]Probable Scenario Analysis and Trade Plan for Nifty 50 Index NSE:NIFTY for the 14th of July, 2026. The day is Tuesday.
🟢 Bullish Scenario
Be bullish if the price sustains above 24250 for at least 30 minutes and forms a sustained bullish candle. The probable bullish targets above 24250 would be - 24312.5 and 24375. There is an unfilled GAP at 24355.1. The price would receive strong resistance at 24375. Next, if the price sustains above 24375, then the probable bullish targets would be - 24437.5 and 24500.
🔴 Bearish Scenario
Be bearish if the price decisively breaks down below 24125 and sustains. In this case, the probable bearish targets would be - 24062.5 and 24000. There will be strong support at 24000. There is a minor unfilled GAP at 24981.9. Probably, the market would fill this GAP. Next, if the price decisively sustains below 24000, then there will be sharp selling. The probable bearish targets below 24000 would be - 23937.5 and 23875. There is an unfilled GAP at 24981.9.
🟡 No Trading Zone (NTZ): (24250 - 24125).
⏺ Range of Consolidation (ROC): (24375 - 24125).
Here, 24250 is the median of the ROC. The median works like an intraday sentiment evaluator. The price trading above the median would offer bullish sentiment, while the price trading below the median would trigger bearish sentiment within the ROC.
● Event
No high-impact event this week. No holidays this week. However, there is a NIFTY 50 weekly expiry. We can expect a price anomaly on the expiry day. Best to trade in the second half of the trading session. Lastly, geopolitical issues are omnipresent.
● Intraday Bias
Establish intraday bias with respect to the opening price. If the price sustains above the opening price, then don't think of shorting. Look for bullish trades only. On the contrary, if the price sustains below the opening price, then don't think of going long. Look for bearish trades in that case.
● Disclaimer + End Note
- All the analyses would fail in the case of a major gap up, gap down, or price structure anomaly. Thus, practice PRAGMATISM in the live session.
- Trade only if there is a set-up. Remember, not trading is an extension of the trading activity.
- Mark your points. Trade your points. Price is GOD. Anything can happen in the markets. Thus, trade what you see, not what you believe.
- Always PRACTICE RISK MANAGEMENT. Always PROTECT YOUR CAPITAL. Be RESPONSIBLE.
- Be Strategic. Be Courageous. Be Patient. Be Wise.
- Every day is a new day. Thus, do not carry the baggage of past successes or failures. Leave the gardens of winning and losing. Establish yourself in equanimity. Always think from a new perspective.
- Let the joy of trading drive your effectiveness, not greed or fear. Believe in Possibilities.
Happy Trading!  Long
Long
Trading Masterclass #1Institutional trading means trading like hedge funds, banks, prop firms, and professional desks. They do not trade based on emotions, random tips, or gambling. They use systems, probabilities, risk control, position sizing, discipline, and psychology.
Retail traders often lose because they focus only on “entry.” Institutions focus on:
Risk Management
Capital Protection
Position Sizing
Probability
Psychology
Consistency
Repeatable Edge  Education

XAUUSD: Massive Weekly Gap Down — Hunting Shorts to 4HR POI🔍 Why the Gap Down in XAUUSD?
Today's gap down is a classic case of "Counterintuitive Market Mechanics" driven by a major escalation over the weekend:
The Crude Oil & Dollar Index Surge: Over the weekend, US CENTCOM launched precision strikes against targets in Iran following drone/missile attacks. This forced crude oil prices to instantly skyrocket by 4%.
The Inflation / Rate Hike Trap: Usually, war drives gold up. But because oil spiked so aggressively, the market suddenly panicked that inflation is going to surge right back up.
Hawkish Central Banks: Higher inflation means the US Federal Reserve and other central banks will be forced to keep interest rates higher for longer or potentially look at more monetary tightening. Since Gold pays no yield, the fear of sustained high interest rates caused institutional desks to dump bullion.
DXY Strength: This massive capital flight went straight into the US Dollar, causing the Dollar Index ( TVC:DXY $) to surge over 101.20, crushing Gold at the weekly open.
Direction: Short / Bearish Bias 🔴
Market Overview:
XAUUSD opened the week with a massive structural gap down, catching many retail buyers off guard. Despite escalating geopolitical headlines over the weekend involving the US and Iran, the massive 4% surge in crude oil has drastically revived global inflation fears. The market is pricing in hawkish central bank extensions (higher for longer rates), causing the US Dollar Index (DXY) to skyrocket past 101.20 and forcing a heavy liquidation in safe-haven bullion.
Technical Structure & Bias:
The higher timeframe structure has officially shifted its short-term direction. We are observing pure bearish control right from the weekly open.
The Higher Timeframe Objective: The immediate path of least resistance is downward. We are looking for a continuation toward the major 4-Hour Point of Interest (POI) demand zone lower down.
Intraday Strategy: The macro bias is strictly sell-on-rise. Any early-session bullish momentum or corrective bounces must be treated purely as temporary retracements to tap premium pricing.
Risk Warning: Do not mistake minor intraday green candles for a bullish trend shift. Do not try to catch the falling knife or aggressively buy the gap-fill without institutional confirmation. Stay alert, protect your capital, and look for clean bearish setups on the lower timeframes (15m/1h) executing in line with the major 4H flow.
⚠️ Technical Disclaimer:
The structural outlook and directional bias mentioned in this chart text reflect an independent technical perspective based on institutional order flow. This is not financial advice or a direct signal to execute. Every trader must conduct their own due diligence, manage their leverage responsibly, and wait for personal confirmation before entering any positions. #NIFTY Intraday Support and Resistance Levels - 13/07/2026Nifty is expected to open with a gap-down bias near the 24000 level. Despite the weak opening, the index is trading close to a crucial support zone where buying interest may emerge. Traders should wait for confirmation before taking fresh positions as opening volatility is likely to remain high.
The immediate support is placed at 24050–24100. If Nifty sustains above this zone and shows buying momentum, traders can consider long positions with targets of 24150, 24200, and 24250. A decisive breakout above 24250 will confirm fresh bullish momentum and may extend the rally towards 24350, 24400, and 24450+.
On the downside, if Nifty fails to hold the 23950 support level, traders can consider short positions with targets of 23850, 23800, and 23750. A sustained breakdown below this level will indicate renewed selling pressure and strengthen the bearish outlook.
Overall, a gap-down opening near the 24000 level is expected. As long as Nifty holds above the 24050–24100 support zone, buying on dips remains the preferred strategy. Fresh shorts should be considered only after a confirmed breakdown below 23950. Follow strict stop-losses and book profits gradually at each target level. #BANKNIFTY Intraday PE & CE Levels(13/07/2026)Bank Nifty is expected to open with a gap-down bias, but the overall trend remains positive as long as the index holds above the immediate support zone. Early volatility is likely, and traders should wait for confirmation before initiating fresh positions.
The immediate support is placed at 57550–57600. If Bank Nifty holds this zone and attracts buying interest, traders can consider CE positions with targets of 57750, 57850, and 57950. A decisive breakout above 58050 will confirm fresh bullish momentum and may extend the rally towards 58250, 58350, and 58450+.
On the downside, if the index fails to sustain above 57950–57900 after a pullback, traders can consider reversal PE positions with targets of 57750, 57650, and 57550. A sustained breakdown below 57450–57400 will strengthen the bearish bias and may drag the index towards 57250, 57150, and 57050.
Overall, a gap-down opening is expected. However, unless Bank Nifty breaks below 57550, the broader recovery structure remains intact. Traders should prefer buying on dips above support, while fresh shorts should be considered only after a confirmed breakdown below 57450. Follow strict stop-losses and book profits gradually at each target level. MASON XAUUSD – Trendline Break May Target FibonacciXAUUSD is trading around 4,071 after losing short-term recovery momentum near the Ichimoku structure. Price is now testing the rising trendline support, and the early-week focus is on whether gold can hold this structure or break lower.
The priority view is bearish if gold breaks below the trendline and strong support area. A clean breakdown may open the way toward the Fibonacci extension targets.
Technical View
Gold is currently moving inside a tightening structure between the descending resistance line and the rising trendline support. This shows that price is being compressed before a stronger move.
The short-term recovery has failed to break clearly above the Ichimoku resistance. Price remains under pressure near the cloud, which means buyers have not fully regained control. As long as gold stays below the Ichimoku resistance and below the FVG sell order zone, the upside remains limited.
The 4,100–4,106 area is the main FVG sell order zone on the chart. This zone is important because it aligns with the short-term resistance structure, Ichimoku pressure, and the descending trendline area. If gold retests this zone and rejects, it may confirm another lower high before the next bearish leg.
The 4,055–4,065 area is the strong support zone and also connects with the rising trendline. If price breaks below this area, the bullish correction structure may fail. That would confirm a trendline break and shift the short-term market back into stronger bearish continuation.
The first downside target is the Fibonacci 1.618 extension around 4,015–4,020. If selling pressure continues after breaking support, the next deeper target may be the Fibonacci 2.618 area around 3,950–3,960.
Key Zones
Current price: 4,071
FVG sell order zone: 4,100–4,106
Ichimoku resistance area: 4,085–4,111
Strong support: 4,055–4,065
Trendline breakdown zone: below 4,055
Fibonacci 1.618 target: 4,015–4,020
Fibonacci 2.618 target: 3,950–3,960
Invalidation: above 4,116
Trading Plan
Sell Priority: 4,100–4,106
Condition: wait for bearish rejection from the FVG sell order zone, failed recovery above Ichimoku, or a clean break below the rising trendline support.
SL: above 4,116
TP1: 4,055–4,065
TP2: 4,015–4,020
TP3: 3,950–3,960
Alternative Scenario
If gold breaks below 4,055 directly at the start of the week, wait for a retest of the broken trendline or support zone as resistance before looking for sell continuation toward the Fibonacci 1.618 target.
Buy View
Buy is not the priority while price stays below the FVG sell order zone and Ichimoku resistance. A short-term buy reaction may appear around 4,015–4,020, but it needs clear bullish confirmation first.
Final View
Overall, gold is still under short-term bearish pressure. The key point for the start of the week is the rising trendline support. If gold breaks below 4,055–4,065, the correction structure may fail and the downside path toward 4,015 and 3,950 becomes more realistic.
Will gold break the trendline early next week, or retest the FVG sell order zone before moving lower?
 Short
Short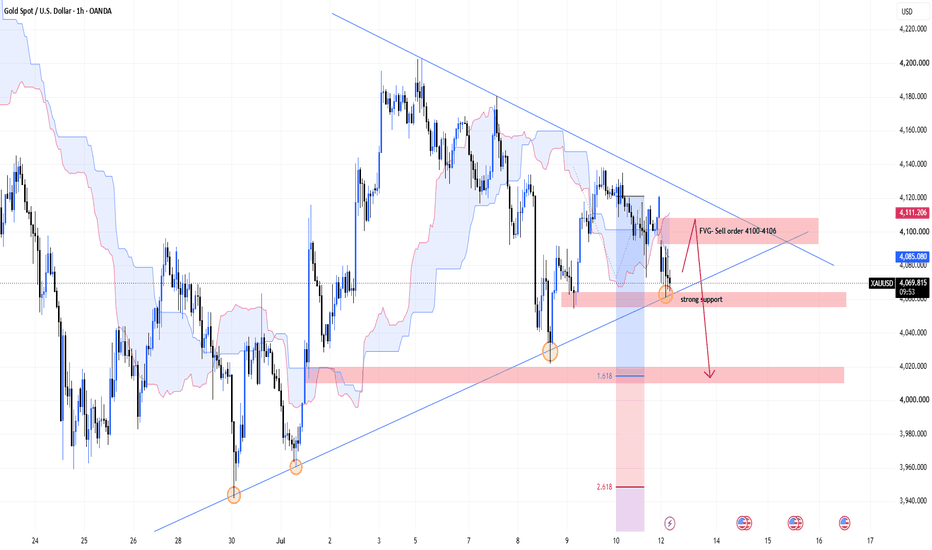
Peak to Flip: A 50% Story That RepeatedThis post is educational and observational in nature based on historical price action on a monthly timeframe. It is not a forecast or a trading recommendation.
1) Marked on this chart in white are three separate flip zones. A flip zone is a price level that once acted as resistance, and after being broken and sustained above, converted into support. Markets often revisit these levels later, and when they hold from above, it confirms the flip.
2) Each time one of these flip zones formed, a similar sequence followed. Price rallied from the flip zone, reached a peak, meaning the highest point of that particular move, and then fell back down. What stood out across all three instances is where that fall eventually found support.
In each of the three cases, the decline from peak to bottom landed close to a 50% retracement of that move, and in each case, the level where price stopped falling was the same flip zone that had originally supported the rally. The zone that launched the move also caught the fall.
3) This is not a rule, not a strategy and not a signal to act on. It is simply a repeated observation across this specific chart, on this specific timeframe, three separate times. Seeing the same relationship between a flip zone, a rally, a peak and a roughly 50% retracement recurring more than once is the kind of pattern recognition that comes only from spending time studying price history closely.  Long
Long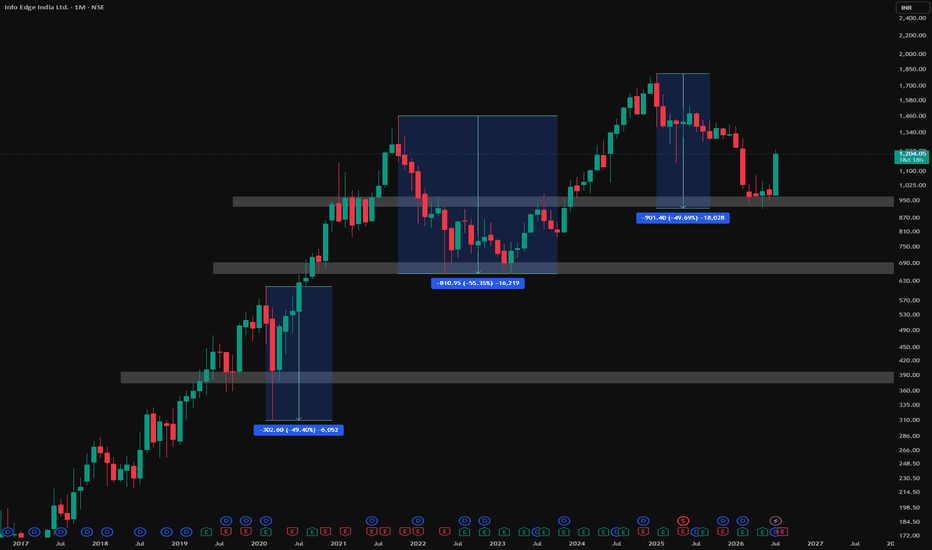
CDSL 3-Month Breakout with Strong Volume📊 CDSL: Daily Technical Snapshot – 3-Month Breakout with Strong Volume
📊 STWP Technical Analysis
________________________________________
MARKET STRUCTURE SNAPSHOT | NSE: CDSL | DAILY
Closing Price: 1,431.90 (+85.40 | +6.34%)
Core Trend: Strong Uptrend
Market State: Confirmed 3-Month Breakout
Price Structure: Price has broken above a three-month consolidation range with a powerful bullish candle, supported by exceptionally strong volume and broad market participation.
________________________________________
OPERATIONAL PRICE GRID & KEY REFERENCE LEVELS
Model Reference Level: 1,443.00
Hard Invalidation Level: 1,299.10
Structural Risk: 143.90 (9.97%)
Resistance Levels: R1 1,465.70 | R2 1,499.50 | R3 1,556.00
Support Levels: S1 1,375.40 | S2 1,318.90 | S3 1,285.10
Range Structure: Low 1,299.10 | High 1,556.00
Higher Timeframe Observation Zones: 1,586 | 1,730 | 1,874
________________________________________
MOMENTUM, PARTICIPATION & CPR DATA
Volume Profile: 9.18 Million Shares
Volume Character: Extremely High Relative Participation
RSI: 68.95 (Strong Momentum Zone)
ADX: 24.95 (Strengthening Trend)
ROC: +8.72%
MACD Status: Strong Positive Momentum with Fresh Bullish Crossover
CCI: +164.10 (Strong Bullish Momentum)
Stochastic Reading: 92.49 (Extended Momentum Zone)
Current Bias: BUY ON PULLBACKS
CPR State: Bullish Zone | CPR Moving Up (Wide)
Today's CPR: Pivot 1,339.05 | Top 1,342.75 | Base 1,335.30
Tomorrow's CPR (Projected): Pivot 1,409.20 | Top 1,420.55 | Base 1,397.85
________________________________________
📚 EDUCATIONAL OBSERVATION
Central Depository Services (India) Ltd. (CDSL) has delivered a decisive 3-month breakout, closing above a prolonged consolidation range with a strong bullish candle supported by exceptionally high trading volume. Such breakouts often indicate that demand has successfully absorbed supply over an extended period, allowing the stock to transition from consolidation into a potential expansion phase.
The breakout is reinforced by multiple technical confirmations, including a Three Inside Up candlestick pattern, a MACD bullish crossover, an RSI breakout, and Bollinger Band expansion. The sharp increase in trading volume further strengthens the breakout, suggesting broad market participation and improving institutional interest rather than a low-volume price move.
Several technical factors are currently aligned in support of the bullish structure:
Momentum indicators continue to support the prevailing trend. The RSI at 68.95 reflects strong bullish momentum while remaining just below the conventional overbought threshold. MACD has generated a fresh bullish crossover, signalling improving trend strength, while ADX at 24.95 indicates that the trend is becoming stronger. The ROC of +8.72% highlights healthy price acceleration, and the CCI reading of +164.10 confirms robust upside momentum. Meanwhile, the Stochastic reading of 92.49 suggests strong buying pressure, although traders should also be mindful that short-term consolidations can occur after sharp advances.
The projected Central Pivot Range (CPR) for the next trading session has shifted significantly higher, with the projected Pivot at 1,409.20. A rising and widening CPR generally reflects improving market acceptance of higher prices and often supports trend continuation when accompanied by strong participation.
The immediate technical focus remains on the resistance zone between 1,466 and 1,500. A sustained move above this area could strengthen the existing bullish structure and bring the higher-timeframe observation zone near 1,556 into focus. On the downside, 1,375 remains the first important support, while the structural invalidation level is positioned near 1,299.
From a business perspective, CDSL is one of India's leading securities depositories, providing electronic depository services, settlement infrastructure and related capital market solutions. Continued growth in retail investor participation, increasing demat account penetration and expanding digital capital market infrastructure provide a constructive long-term outlook for the company.
Support and resistance levels should be viewed as observation zones rather than predictive targets. Chart patterns, price action, volume analysis, momentum indicators and CPR are educational tools intended to help market participants understand evolving market structure within a disciplined risk-management framework.
________________________________________
⚠️ Disclaimer
This analysis is provided strictly for educational and informational purposes.
This is not financial, investment or trading advice and should not be considered a recommendation to buy or sell any security.
Stock market investments are subject to market risks, including the possible loss of capital.
Past performance, historical observations, chart patterns and technical indicators do not guarantee future results.
Please conduct your own research and consult a SEBI-registered investment adviser before making investment decisions.
STWP assumes no responsibility or liability for any financial loss arising directly or indirectly from the use of this information.
 Long
Long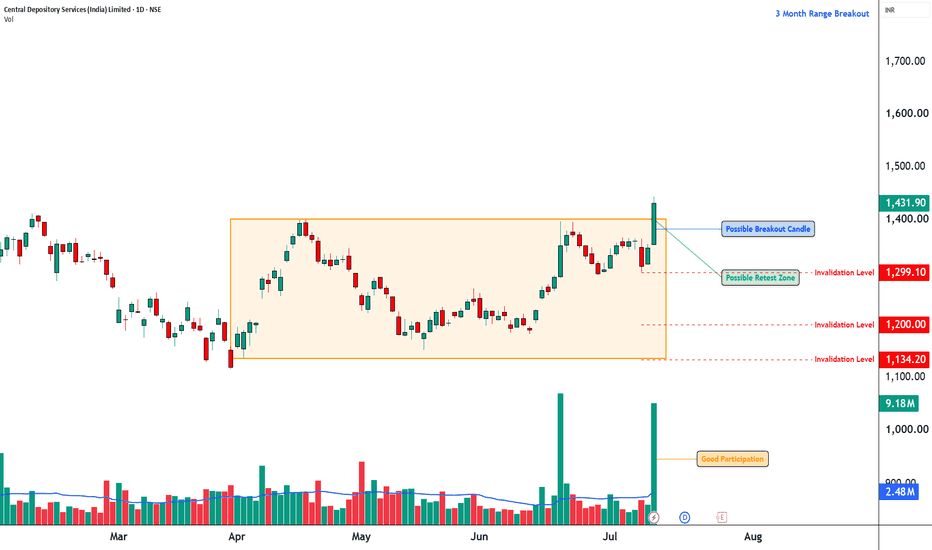
XAUUSD : Buying the Dip from Demand Zone to 4138📊 Market Context & Technical Analysis
Looking at the XAUUSD 30-minute chart, we can see a clear structural shift from bearish to bullish, providing a high-probability long setup.
Market Structure Shift: After a period of downside movement marked by a Break of Structure (BOS) and a Market Structure Shift (MSS), price found a solid bottom around the 4,020 area.
Change of Character (CHOCH): A powerful impulsive move to the upside broke previous minor swing highs, confirming a CHOCH and transitioning the local trend back to bullish.
Trendline Support: The market has established a clear ascending support line, which price has respected multiple times.
Demand Zone Confluence: Price is currently retracing and compressing right into a freshly formed Demand Zone (approx. 4,100 - 4,106). This zone perfectly aligns with the dynamic ascending trendline support, offering strong confluence for a long entry.
🏹 The Trade Execution Plan
We are looking for a bullish reaction within the identified demand zone to ride the next impulse wave upward.
Direction: Long 🟢
Entry Zone: 4,100 - 4,106 (Within the highlighted blue Demand Zone)
Invalidation / Stop Loss (SSL): Below the recent swing low structure around 4,073 (Sell-Side Liquidity level).
Take Profit / Target (BSL): 4,138 (Targeting the Buy-Side Liquidity sitting at the recent swing high).
⚠️ Risk Disclaimer
Always wait for lower timeframe confirmation (e.g., a 1m to 5m CHOCH or bullish engulfing candle) inside the demand zone before executing to minimize risk. Manage your risk properly and never risk more than your plan allows. Long 
XAUUSD 1H: Bullish MSS Confirms Demand ZoneTechnical Breakdown
Market Structure Shift (MSS): Following the initial bullish continuation (BOS), the market failed to sustain higher prices, putting in a distribution pattern. The aggressive push down violated the recent swing lows, confirming a bearish Market Structure Shift (MSS) on the hourly timeframe.
Liquidity Sweep (Line X): The downward expansion effectively swept sell-side liquidity resting below the key structural level marked as 'X'. This sweep successfully engineered the necessary liquidity to mitigate a deep demand pocket.
Demand Zone Mitigation: Price tapped cleanly into the 1H Demand Zone ($4,050 - $4,090) and immediate buying pressure stepped in, leaving a sharp rejection and a minor structural turnaround.
Upside Target (Supply Zone): The primary objective for this structural bounce is the unmitigated 1H Supply Zone resting around the $4,140 level, which aligns with the origin of the aggressive MSS drop.
Trading Plan
Bias: Bullish (Intraday Retracement)
Entry Range: Within the current 1H Demand Zone confirmation area ($4,080 - $4,100)
Invalidation: A clean hourly close below the demand zone low ($4,050)
Take Profit Target: $4,140 (1H Supply Zone) Long 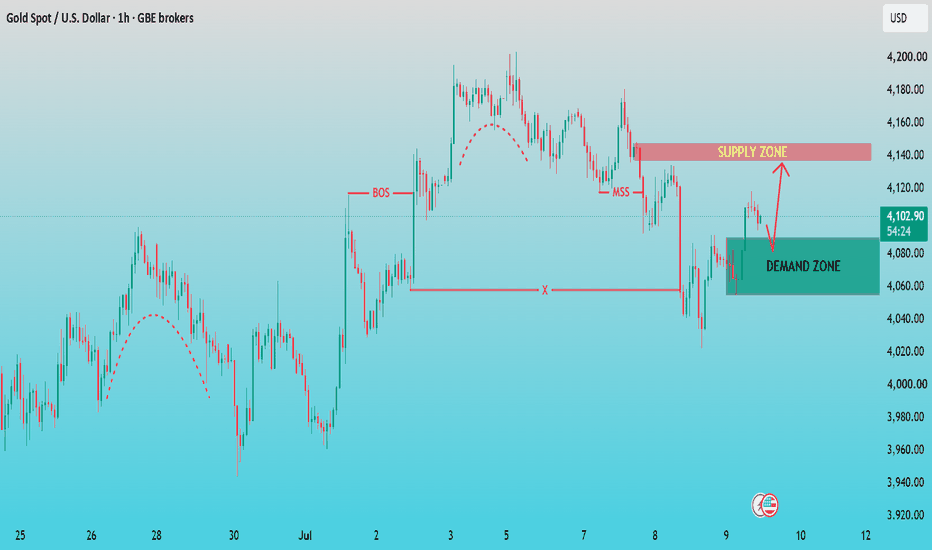
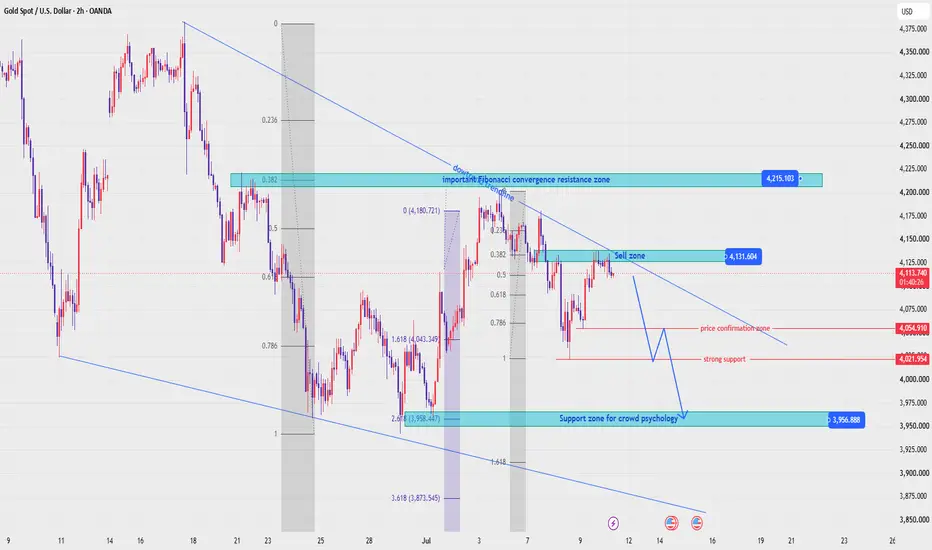
XAUUSD — Recovery First, Bearish Rejection Later
Fundamental Analysis
Gold remains sensitive to USD momentum, Treasury yields, and upcoming U.S. macro data. For next week, price may create a technical recovery first, but the larger structure still shows bearish pressure while gold stays below the main descending trendline.
Technical Analysis
On the 12H chart, XAUUSD is trading around 4,120 after holding above short-term support. The first upside area to watch is 4,204, which acts as strong resistance. If price continues higher, the major sell zone is around 4,300 - 4,310, where Fibonacci resistance, previous structure, and the descending trendline align. A rejection from this area could send gold back toward 3,942, then the deeper Fibonacci target near 3,754.
Important Key Levels
Current price: 4,120
Short-term resistance: 4,204
Main sell zone: 4,300 - 4,310
Strong support: 3,942
Main Fibonacci target: 3,754 - 3,751
Invalidation: above 4,310
Trading Scenario
Main Sell Setup
Entry: 4,300 - 4,310
Stop Loss: 4,360
Take Profit 1: 4,204
Take Profit 2: 3,942
Take Profit 3: 3,754 - 3,751
Sell Condition
Wait for gold to recover toward the 4,300 - 4,310 Fibonacci sell zone. A valid sell setup needs bearish rejection from this area, such as a long upper wick, failed breakout, or bearish candle close below the zone. If price rejects and breaks back below 4,204, the bearish continuation view becomes stronger. If price breaks and holds above 4,310, the sell setup is invalid.
Overall View
The main plan for next week is not to sell too early at the current price. Gold may rise first toward 4,204 or even 4,300 - 4,310 before sellers return. As long as price stays below the descending trendline and rejects the Fibonacci sell zone, the larger downside target remains 3,942 and 3,754.
Do you share the same view that gold may recover first before the next bearish move?
Short 
MASON XAUUSD – Accumulation Inside Bearish Channel
XAUUSD is trading around 4,120 while still moving inside the medium-term descending channel. Although the broader structure has not fully broken out yet, gold is showing strong accumulation around the lower-middle area of the channel.
The priority view is that gold may continue building a base above the 4,080–4,095 buy zone before attempting a stronger medium-term recovery toward the upper resistance zones.
Technical View
Gold is still inside a bearish price channel on the 6H structure. The upper trendline of the channel continues to act as the main resistance, so the market has not confirmed a full bullish reversal yet.
However, the recent price action shows a clear change in behaviour. Instead of continuing lower after reaching the lower channel area, gold started to form a stronger accumulation base. This means sellers are losing momentum, while buyers are slowly defending the market around the 4,080–4,095 area.
The 4,080–4,095 zone is the key buy zone on the chart. This area is important because price has reacted from it several times, and it also sits near the lower accumulation structure. As long as gold holds above this zone, the recovery scenario remains valid.
Ichimoku is still important here. Price is trying to recover around the Ichimoku structure, but it still needs a clean break above the short-term resistance around 4,162 to confirm stronger bullish momentum. If gold can break and hold above this level, the next move may target the descending channel resistance.
The first major upside area is around 4,300–4,330, marked as the market psychology sell zone. This area may create some reaction first. If buyers can absorb the selling pressure there, gold may continue toward 4,400–4,420 and later the Fibonacci resistance zone around 4,500–4,530.
Key Zones
Current price: 4,120
Main buy zone: 4,080–4,095
Short-term support: 4,033–4,050
Bullish confirmation: above 4,162
Channel resistance area: 4,280–4,330
Market psychology sell zone: 4,300–4,330
Price reaction zone: 4,400–4,420
Fibonacci resistance: 4,500–4,530
Invalidation: below 4,033
Trading Plan
Buy Priority: 4,080–4,095
Condition: wait for bullish rejection, higher low formation, or price holding above the buy zone and Ichimoku support.
SL: below 4,033
TP1: 4,162
TP2: 4,300–4,330
TP3: 4,400–4,420
Final target: 4,500–4,530
Alternative Scenario
If gold breaks above 4,162 directly, wait for a retest of this level as support before looking for buy continuation. A clean hold above 4,162 would confirm that accumulation is turning into a stronger bullish recovery phase.
Sell View
Sell is not the priority while price continues to hold above 4,080–4,095. A short-term sell reaction may appear around 4,300–4,330 because this is still channel resistance and a psychological supply zone. However, unless gold breaks below 4,033, any pullback from that area should be treated as correction inside a larger recovery attempt.
Final View
Overall, gold remains inside a medium-term bearish channel, but the price behaviour is no longer strongly bearish. The market is showing accumulation above the buy zone, and this may prepare for a stronger bullish move if 4,162 breaks cleanly. As long as 4,080–4,095 holds, the medium-term recovery path toward 4,300, 4,400, and 4,500 remains possible.
Will gold complete the accumulation phase and break the channel resistance, or retest the buy zone one more time before the next bullish leg?
Long 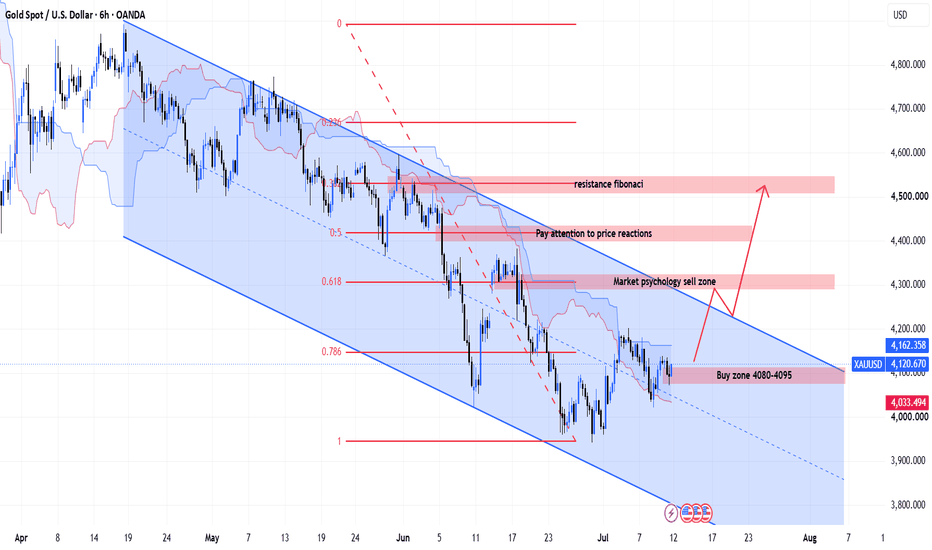
 Education
XAUUSD — Bullish Channel Holds Above Buy Zone
Fundamental Analysis
Gold is still reacting to USD momentum, Treasury yields, and upcoming U.S. macro data. For now, the short-term structure remains positive while price continues to hold inside the rising channel.
Technical Analysis
On the 2H chart, XAUUSD is trading around 4,142 and still respecting the bullish channel structure. The main buy order trendline zone is around 4,141 - 4,143. If price holds this area, buyers may continue to defend the trend and push gold toward the liquidity zone at 4,144, then the mid-channel resistance around 4,145 - 4,146. A stronger breakout above this area may open the way toward the main target around 4,152.
Important Key Levels
Current price: 4,142
Main buy zone: 4,141 - 4,143
Short-term support: 4,140
Liquidity resistance: 4,144
Mid-channel resistance: 4,145 - 4,146
Main target: 4,152
Invalidation: below 4,140
Trading Scenario
Main Buy Setup
Entry: 4,141 - 4,143
Stop Loss: 4,140
Take Profit 1: 4,144
Take Profit 2: 4,145 - 4,146
Take Profit 3: 4,152
Buy Condition
Wait for gold to retest the 4,141 - 4,143 buy zone and show bullish rejection. A clean hold above the trendline keeps the bullish setup valid. If price breaks above 4,144, upside momentum becomes stronger toward 4,145 - 4,146 and 4,152. If price breaks and holds below 4,140, the buy setup is invalid.
Overall View
XAUUSD remains bullish while price stays inside the rising channel and holds above the buy order trendline zone. The preferred plan is to wait for confirmation around 4,141 - 4,143, then look for continuation toward 4,144, 4,146, and 4,152.
Do you share the same bullish view on gold, or are you waiting for confirmation above the liquidity zone first?
Short 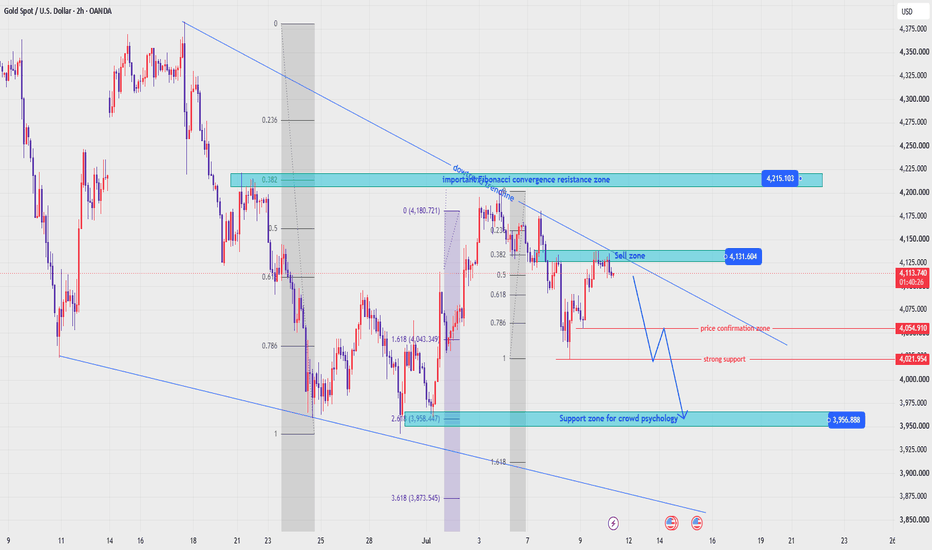
MASON XAUUSD – Bullish Pullback Before Mid-Term Rally
XAUUSD is trading around 4,123 after recovering from the short-term correction zone. Price is still holding above the main uptrend trendline, while the current pullback is moving around the Fibonacci reaction area.
The priority view remains bullish in the medium term, as long as gold continues to hold above the buy order zone and the rising trendline support.
Technical View
Gold is still moving inside a bullish recovery structure. The higher low formation from the previous support area shows that buyers are still defending the market, even though price is currently correcting below the short-term descending trendline.
The most important point on this chart is the uptrend trendline. Price has respected this trendline several times, which means the broader bullish structure remains valid while gold stays above it.
The 4,101–4,106 area is the main buy order zone. This zone is important because it aligns with the Fibonacci correction area, the rising trendline support, and the previous reaction zone. If gold pulls back into this area and holds, it may confirm another higher low before the next bullish leg.
Short term, price may still face resistance around 4,138 and 4,159. The 4,159 area is marked as a sell order zone, so some rejection or consolidation may appear there first. However, if gold breaks and holds above 4,159, the bullish structure may open a stronger move toward the 4,203 resistance.
Ichimoku also supports the idea that the market is trying to recover. Price has moved back near the Ichimoku structure, and if buyers can keep price above the cloud support, the next medium-term bullish continuation will become more convincing.
Key Zones
Current price: 4,123
Buy order zone: 4,101–4,106
Trendline support: 4,095–4,106
Short-term resistance: 4,138
Sell order reaction zone: 4,159
Major resistance: 4,203
Ichimoku support area: 4,067–4,101
Invalidation: below 4,067
Trading Plan
Buy Priority: 4,101–4,106
Condition: wait for bullish rejection, higher low formation, or price holding above the uptrend trendline and Fibonacci support area.
SL: below 4,067
TP1: 4,138
TP2: 4,159
TP3: 4,203
Alternative Scenario
If gold breaks above 4,159 directly, wait for a retest of this zone as support before looking for buy continuation toward 4,203. A clean hold above 4,159 would confirm stronger bullish momentum for the medium-term move.
Sell View
Sell is not the priority while price stays above the uptrend trendline and the 4,101–4,106 buy order zone. A short-term sell reaction may appear around 4,159, but it should only be treated as a correction unless gold breaks below 4,067.
Final View
Overall, gold remains in a bullish structure. The current movement looks more like a Fibonacci correction before continuation rather than a full bearish reversal. The cleaner plan is to wait for price to hold the 4,101–4,106 buy zone, then follow the next bullish leg toward 4,138, 4,159, and potentially 4,203.
Will gold respect the Fibonacci buy zone and start the next bullish leg, or retest the trendline support first?
Long 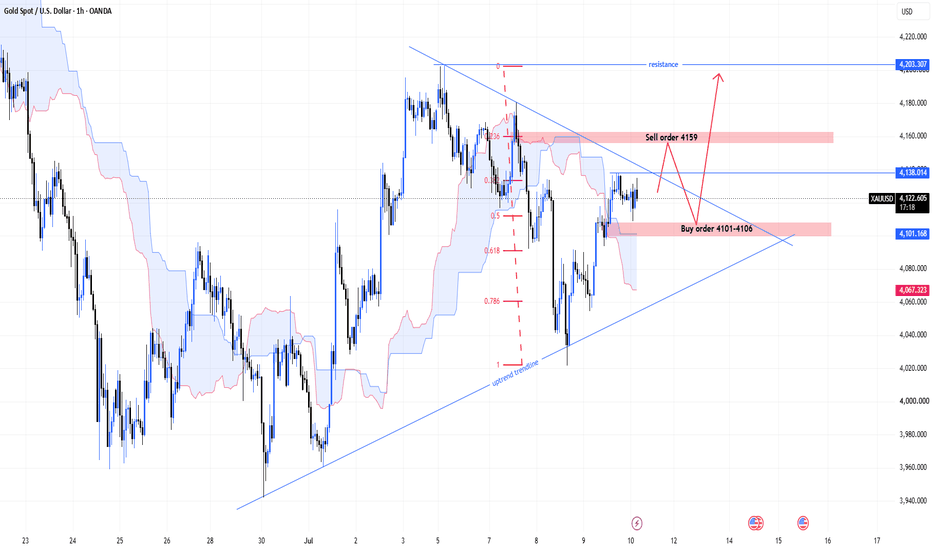
XAUUSD: Rebound to 4,193 May Be Just a Short-Term Bull TrapXAUUSD is holding above the short-term uptrend line near 4,130, leaving room for a potential rebound before sellers truly step back in. However, a strong supply zone lies overhead at 4,193–4,210, coinciding with a resistance area that has previously triggered price reversals.
With US yields remaining high and expectations of continued Fed tightening weighing on gold, the current rally lacks the basis to confirm a sustainable uptrend. The most likely scenario is a bounce from 4,130 to test the 4,193 zone, followed by profit-taking pressure.
Suggested Strategy:
Entry: Sell on rejection near 4,190–4,200
TP: 4,130
SL: Above 4,220 Short 
#NIFTY Intraday Support and Resistance Levels - 10/07/2026Nifty is expected to witness a flat opening with price likely to open around yesterday's closing range. The index is trading near an important support zone, indicating that the opening move could remain range-bound until a decisive breakout or breakdown occurs.
The immediate support is placed at 23950–23900. If Nifty slips below this zone, traders can consider short positions with downside targets of 23850, 23800, and 23750. A sustained breakdown below 23750 will confirm fresh bearish momentum and may extend the decline further.
On the upside, if Nifty sustains above 24050–24100, traders can consider long positions with targets of 24150, 24200, and 24250+. A decisive move above this resistance zone will indicate a stronger recovery and improve the short-term bullish outlook.
Overall, a flat opening is expected. The index is consolidating near a key support level, so traders should wait for confirmation before initiating fresh positions. A breakout above 24050 favors bullish momentum, while a breakdown below 23950 may trigger another round of selling. Follow strict stop-losses and book profits gradually at each target level. #BANKNIFTY Intraday PE & CE Levels(10/07/2026)Bank Nifty is expected to witness a flat opening with price likely to remain around yesterday's closing zone. The index has recovered from lower levels but is still trading below major resistance, indicating that traders should wait for confirmation before taking aggressive positions.
The immediate support is placed at 57450–57400. If Bank Nifty slips below this zone, traders can consider PE positions with downside targets of 57250, 57150, and 57050. A decisive breakdown below 56950 will strengthen the bearish trend and may extend the fall towards 56750, 56650, and 56550.
On the upside, if Bank Nifty sustains above 57550, traders can consider CE positions with targets of 57750, 57850, and 57950. A stronger bullish breakout above 58050 will confirm fresh buying momentum and may push the index towards 58250, 58350, and 58450.
Overall, a flat opening is expected. The index is trading in a recovery phase but remains below important resistance levels. Traders should wait for a confirmed breakout above 57550 for long positions or a breakdown below 57450 for fresh shorts. Follow strict stop-losses and book profits gradually at each target level. AZAD Ascending Triangle Breakout & 52-Week High📊 Azad Engineering: Daily Technical Snapshot – Ascending Triangle Breakout & 52-Week High
📊 STWP Technical Analysis
________________________________________
MARKET STRUCTURE SNAPSHOT | NSE: AZAD
Closing Price: ₹2,476.10 (+₹246.70 | +11.07%)
Core Trend: Strong Uptrend
Market State: Confirmed Breakout in Progress
Price Structure: Price has broken out of an Ascending Triangle after forming a series of higher lows against a declining resistance trendline. The breakout is accompanied by exceptional volume and a strong bullish Marubozu candle, signalling strong buying conviction.
________________________________________
OPERATIONAL PRICE GRID & KEY REFERENCE LEVELS
Model Reference Level: ₹2,491.50
Hard Invalidation Level: ₹2,191.15
Structural Risk: ₹300.35 (12.06%)
Resistance Levels: R1 ₹2,565.07 | R2 ₹2,654.03 | R3 ₹2,816.57
Support Levels: S1 ₹2,313.57 | S2 ₹2,151.03 | S3 ₹2,062.07
Range Structure: Low ₹2,191.15 | High ₹2,816.57
Higher Timeframe Observation Zones: ₹2,565 | ₹2,654 | ₹2,817
________________________________________
MOMENTUM, PARTICIPATION & CPR DATA
Volume Profile: 2.47 Million Shares
Volume Character: Extremely High Relative Participation
RSI: 71.88 (Strong Momentum Zone)
ADX: 21.59 (Trend Development Phase)
ROC: +13.38%
MACD Status: Strong Positive Momentum Structure
CCI: +258.87 (Extended Bullish Momentum)
Stochastic: 97.11 (Extended Momentum Zone)
Current Bias: BUY ON PULLBACKS
CPR State: Bullish Zone | Wide Projected CPR
Today's CPR: Pivot ₹2,257.75 | Top ₹2,243.55 | Base ₹2,271.90
Tomorrow's CPR (Projected): Pivot ₹2,402.55 | Top ₹2,439.30 | Base ₹2,365.75
________________________________________
📚 EDUCATIONAL OBSERVATION
Azad Engineering has delivered a decisive bullish breakout by moving above an Ascending Triangle, a continuation pattern that often reflects sustained accumulation before trend expansion.
The breakout is supported by an exceptionally strong Bullish Marubozu candle, indicating buyers remained in control throughout the trading session with very little selling pressure.
The breakout is further strengthened by exceptionally high trading volume, suggesting broad market participation and increasing conviction behind the move.
The stock has also registered a 52-week breakout, reinforcing the strength of the prevailing uptrend and indicating expanding institutional interest.
Several technical factors are currently aligned in support of the bullish structure.
Momentum indicators continue to remain firmly supportive. The RSI at 71.88 reflects powerful bullish momentum, although it also indicates that the stock has entered an extended momentum zone where short-term volatility may increase. The ROC of +13.38% highlights strong price acceleration, while MACD remains firmly positive. CCI at +258.87 and the Stochastic reading of 97.11 confirm aggressive upside momentum, suggesting that while the trend remains strong, brief consolidations or pullbacks should be considered a normal part of the price cycle. The projected Central Pivot Range (CPR) for the next trading session has shifted sharply higher, with the projected Pivot at ₹2,402.55. A rising and wide CPR generally reflects improving market acceptance of higher prices and often supports trend continuation when accompanied by strong participation. The immediate technical focus remains on the resistance cluster between ₹2,565 and ₹2,654. Sustained trading above these levels could strengthen the existing bullish structure and bring the higher-timeframe observation zone near ₹2,817 into focus. On the downside, ₹2,314 remains the first important support, while the structural invalidation level is positioned at ₹2,191.15. From a business perspective, Azad Engineering manufactures highly engineered precision components for the aerospace, defence, energy and oil & gas sectors. Its focus on high-value engineering products, increasing global customer base and expanding manufacturing capabilities provide a constructive long-term business outlook. Support and resistance levels should be viewed as observation zones rather than predictive targets. Chart patterns, price action, volume analysis, momentum indicators and CPR are educational tools intended to help market participants understand evolving market structure within a disciplined risk-management framework.
________________________________________
⚠️ Disclaimer
This analysis is provided strictly for educational and informational purposes.
This is not financial, investment or trading advice and should not be considered a recommendation to buy or sell any security.
Stock market investments are subject to market risks, including the possible loss of capital.
Past performance, historical observations, chart patterns and technical indicators do not guarantee future results.
Please conduct your own research and consult a SEBI-registered investment adviser before making investment decisions.
STWP assumes no responsibility or liability for any financial loss arising directly or indirectly from the use of this information.  Long
Long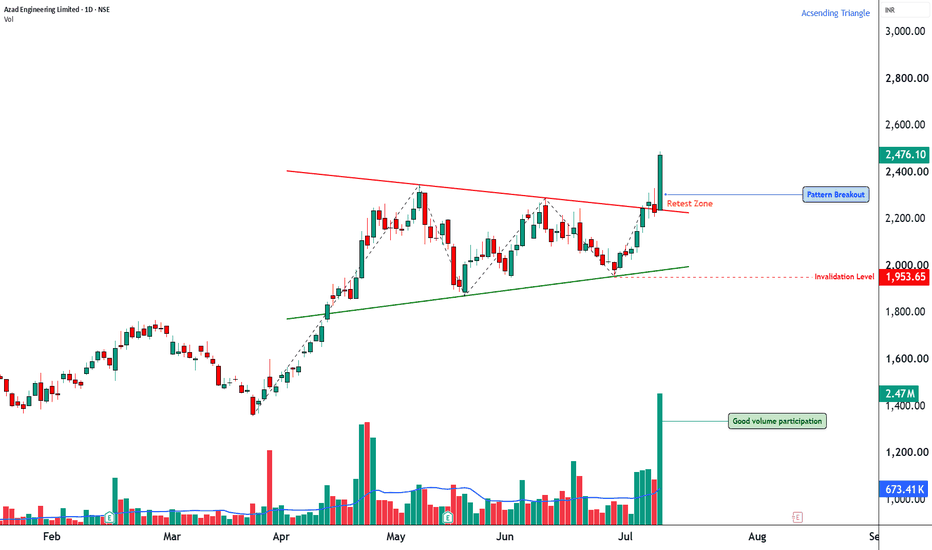
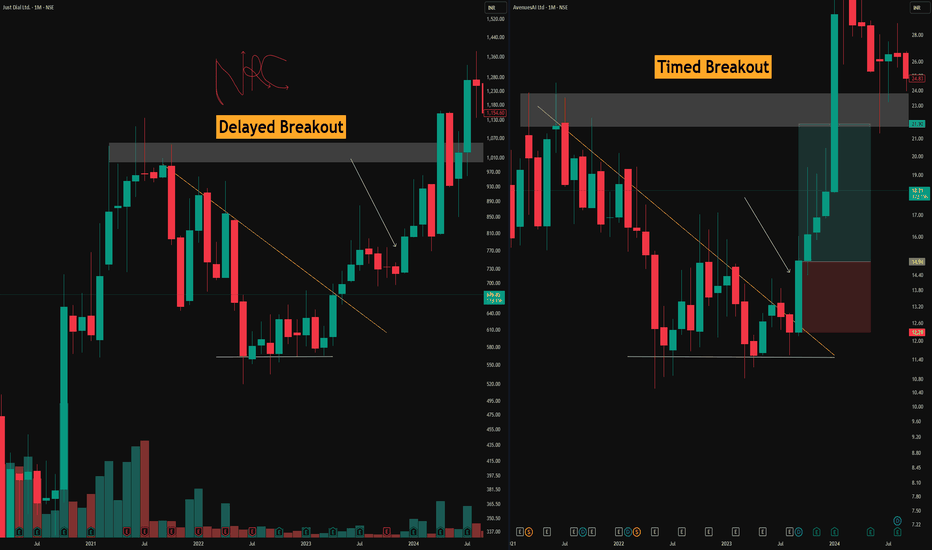
Order Blocks, Hidden Channels and the Base BreakoutsThis post is educational and observational in nature based on historical price action. It is not a forecast or a trading recommendation.
The Bullish Order Block
This is where the story gets interesting. The market fell in three consecutive red candles. The first, then the second, and then the third, which looked like the strongest continuation of selling pressure. But instead of extending the fall, that third candle reversed sharply, closing as a bullish candle that engulfed the range of all three prior red candles combined.
That sudden shift, from what looked like accelerating weakness to a powerful reversal, is what defines a bullish order block. The bottom of that entire sequence marks a major shift in market intent. It tells you that the last wave of aggressive selling was actually being absorbed by buyers the whole time. Whenever price returns to this zone in the future, it is likely to find support, since this is the origin point of the move that followed.
Hidden Parallel Channels
This is a concept I have developed through years of chart reading, and it has become something of a personal signature in how I read breakouts. Hidden channels are small, easily overlooked parallel structures that form directly around a breakout candle or breakout zone. They do not announce themselves, and most traders never notice them sitting there.
When a hidden channel exists around a breakout area, it significantly reduces the reliability of that breakout. Price may appear to break free, pull in buyers, and then get pulled right back inside the channel, turning what looked like a clean breakout into a fakeout.
The Bigger Framework
This is the core principle I follow. Never take a breakout at an all time high. Never take a horizontal breakout in isolation. Always look for a base breakout, meaning a breakout that originates from a demand zone or order block, since that is where genuine accumulation has occurred. And even then, always check for hidden parallel channels around that breakout area, because their presence alone can be enough to turn a high probability base breakout into a low probability fakeout.
 Long
Long
EURUSD — Bullish Channel Holding Above Buy Zone
Fundamental Analysis
EURUSD is still reacting to USD momentum and upcoming U.S. macro data. For now, the short-term structure remains positive while price continues to hold inside the rising channel.
Technical Analysis
On the 2H chart, EURUSD is trading around 1.1426 and still respecting the bullish channel structure. The key buy order trendline zone is around 1.1418 - 1.1426. If price holds this area, buyers may continue to defend the trend and push price toward the liquidity zone at 1.1448, then the mid-channel resistance around 1.1458. A stronger breakout above this area may open the way toward the main target at 1.1526.
Important Key Levels
Current price: 1.1426
Main buy zone: 1.1418 - 1.1426
Short-term support: 1.1400
Liquidity resistance: 1.1448
Mid-channel resistance: 1.1458
Main target: 1.1526
Invalidation: below 1.1400
Trading Scenario
Main Buy Setup
Entry: 1.1418 - 1.1426
Stop Loss: 1.1400
Take Profit 1: 1.1448
Take Profit 2: 1.1458
Take Profit 3: 1.1526
Buy Condition
Wait for price to retest the 1.1418 - 1.1426 buy zone and show bullish rejection. A clean hold above this trendline area keeps the bullish setup valid. If price breaks above 1.1448, upside momentum becomes stronger toward 1.1458 and 1.1526. If price breaks and holds below 1.1400, the buy setup is invalid.
Overall View
EURUSD remains bullish while price stays inside the rising channel and holds above the buy order trendline zone. The preferred plan is to wait for confirmation around 1.1418 - 1.1426, then look for continuation toward 1.1448, 1.1458, and 1.1526.
Do you share the same bullish view on EURUSD, or are you waiting for confirmation above 1.1448 first?