XAUUSD|Descending Triangle Signals Potential Continuation LowerGold remains under bearish pressure after a strong impulsive decline, with price now consolidating inside a descending triangle on the 30-minute timeframe. The pattern is characterized by a series of lower highs against a flat support base near the 3,960 area, indicating that sellers continue to absorb buying interest.
Multiple retests of support suggest weakening demand, while the descending trendline continues to cap recovery attempts. As long as price remains below the trendline and the nearby supply zone around 4,000–4,020, the broader short-term bias remains bearish.
A confirmed breakdown below triangle support could trigger fresh selling momentum, exposing the 3,900 level as the next key downside objective. If bearish momentum accelerates, further downside expansion may follow toward lower support levels.  Short
Short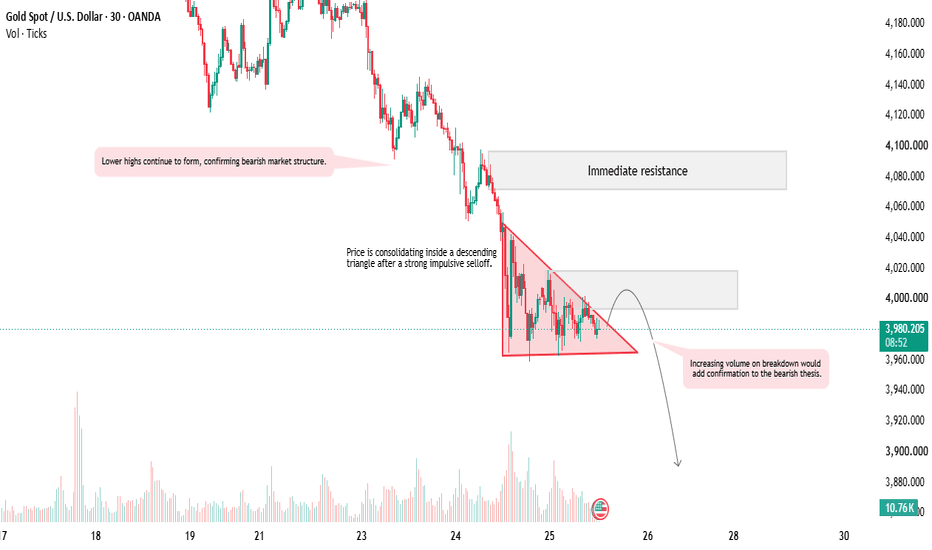
Gold (XAUUSD) Analysis: Market Structure Shift & H1 OB Re-testMarket OverviewGold ( OANDA:XAUUSD $) has undergone a classic market structure shift on the lower timeframes after finding a solid bottom around the $3,960$–$3,980$ region. Following a prolonged bearish trend marked by clear Break of Structure (BOS) levels to the downside, the asset has successfully shifted its character, breaking previous structural highs to the upside.
Technical Analysis & Key Confluences
Market Structure Shift: The chart highlights a recent bullish BOS (Break of Structure) to the upside, signaling that buyers are taking control and shifting the macro bearish momentum.
Bullish Flag/Channel: Following the upward expansion, price consolidated within a neat descending corrective channel (highlighted in red). This flag pattern served as liquidity generation before the strong bullish breakout.
H1 Order Block (H1-OB): Price has forcefully broken out of the flag and formed a Higher High. We are currently looking at a potential retest or continuation from the validated H1 Order Block (the blue zone marked around $4,030$ - $4,040$).
Trade Execution Strategy🚀 Trade Setup: Bullish ContinuationEntry Zone: Market execution near current levels ($4,046$) or on a minor pullback into the H1-OB zone ($4,035$ - $4,040$).Invalidation (Stop Loss): Below the H1 Order Block or the recent swing low (approx. $4,015$–$4,020$).Take Profit (Target): $4,080$ (The major liquidity pool and unmitigated structural high from the previous breakdown). Long 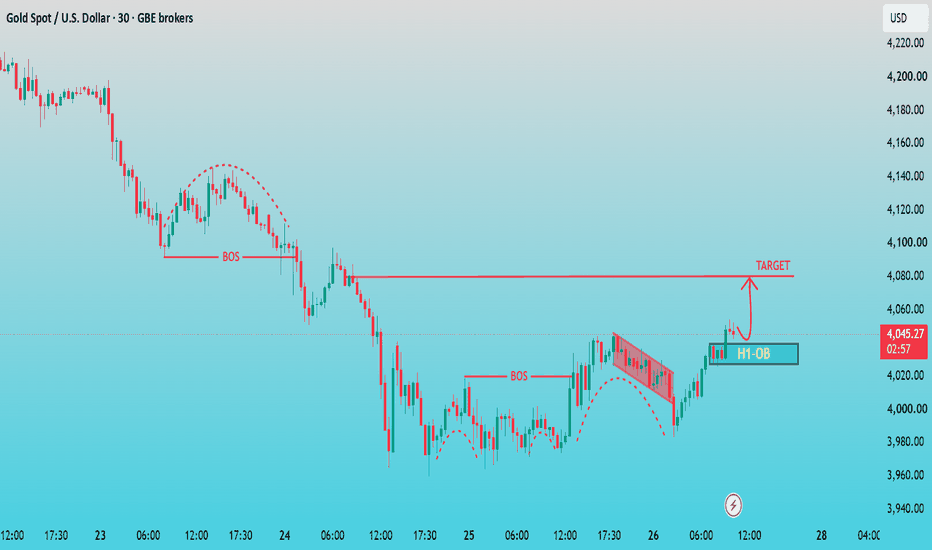
Short 
The Psychology Behind FibonacciAsk ten traders how they identify potential reversal zones, and chances are several of them will mention the Fibonacci Retracement tool.
Whether they trade stocks, forex, cryptocurrencies, or commodities, Fibonacci levels appear on charts across every financial market.
This naturally raises an interesting question.
Why do Fibonacci levels seem to work?
Is there something magical about the numbers?
Or is something else happening beneath the surface?
The truth is that Fibonacci is less about mathematics and more about human behavior.
Markets don't react because of the tool itself. They react because thousands of traders around the world are watching the same levels and making decisions based on them.
Fibonacci Is a Framework, Not a Prediction
Many beginners believe Fibonacci can predict exactly where price will reverse.
It can't.
Instead, Fibonacci helps traders identify areas where buyers and sellers may become active.
Levels such as 38.2%, 50%, and 61.8% are not guarantees.
They are simply zones where market participants often pause, take profits, or look for new opportunities.
Thinking of Fibonacci as a decision-making framework rather than a prediction tool changes the way you use it.
Why Everyone Watches the Same Levels
Financial markets are driven by expectations.
When enough traders expect price to react near a particular level, many of them place orders around that area.
Some traders look for buying opportunities.
Others take profits.
Some reduce risk, while others prepare for reversals.
As more orders gather around the same price zone, the probability of a reaction naturally increases.
In many ways, Fibonacci becomes a self-fulfilling concept.
It works not because markets obey mathematics, but because traders collectively pay attention to it.
The Role of Fear and Greed
Imagine a strong bullish trend.
Price begins pulling back.
Some traders become nervous and close profitable positions.
Others patiently wait for a retracement before buying.
When price reaches a commonly watched Fibonacci level, both groups become active.
One side is taking profits.
The other is entering new trades.
This interaction between fear and opportunity often creates the reactions traders observe on their charts.
The same emotional process occurs during bearish markets.
Fibonacci Works Best with Market Context
One of the biggest mistakes traders make is drawing Fibonacci on every price swing they see.
Without context, the tool loses much of its value.
Experienced traders rarely use Fibonacci in isolation.
Instead, they combine it with:
* Support and resistance
* Trend analysis
* Market structure
* Candlestick confirmation
* Volume
* Price action
When multiple factors point to the same area, confidence in the setup naturally increases.
This is known as confluence.
The Importance of Patience
Another common misconception is that price must reverse the moment it touches a Fibonacci level.
Markets are rarely that precise.
Sometimes price reacts immediately.
Other times it moves slightly beyond the level before reversing.
This is why patient traders wait for confirmation instead of blindly placing trades.
The Fibonacci level identifies an area of interest.
Price action confirms whether buyers or sellers are actually taking control.
Fibonacci Reflects Crowd Behavior
Perhaps the greatest strength of Fibonacci is not the numbers themselves.
It is what those numbers represent.
They reveal where traders are likely to become interested.
Where profits may be taken.
Where emotions begin to change.
And where the balance between buyers and sellers may temporarily shift.
Understanding this psychological perspective helps traders avoid treating Fibonacci as a magical indicator.
Instead, it becomes a tool for understanding market behavior.
Final words:
Fibonacci is not a secret formula for predicting the future.
It is a way of identifying areas where human decisions are most likely to influence price.
The levels themselves are only part of the story.
The real story is the psychology behind them.
Because every retracement, every bounce, and every reversal begins with traders making decisions.
And in the financial markets, understanding people is often more valuable than memorizing numbers.
 Education
XAUUSD - Bearish Structure Holds, Sell From OB Remains PriorityXAUUSD — Bearish Structure Holds, Sell From OB Remains Priority
Gold is trading around $4,008 after reacting from the lower range and retesting near the short-term supply area. Although price has shown a recovery attempt, the main structure is still bearish while gold remains below the day high around $4,044 and below the OB sell zone.
From an SMC perspective, gold created a BOS to the downside, then pulled back into a potential OB reaction area. This kind of movement often shows a bearish continuation setup, especially when price fails to reclaim the previous high and starts rejecting from the supply zone.
The main area to watch is $4,020–$4,030. If gold retests this OB zone and shows bearish rejection, sellers may push price back toward sell-side liquidity around $3,973. A clean break below that liquidity area could open the path toward the low near $3,958 and the deeper target zone around $3,930 before the end of the week.
Sell setup 1
Condition:
Gold retests the OB sell zone around $4,020–$4,030 and forms bearish rejection with lower timeframe MSS / CHOCH.
Entry: $4,020–$4,030
SL: above $4,045
TP1: $3,990
TP2: $3,973
TP3: $3,958
Sell setup 2
Condition:
If gold breaks below $3,973 and retests this level as resistance, bearish continuation remains valid.
Entry: below $3,973 after retest
SL: above $3,995
TP1: $3,958
TP2: $3,945
TP3: $3,930
Buy setup
Condition:
Buying is not the priority. A buy setup is only valid if gold breaks above $4,045, holds above the day high, and confirms bullish MSS / CHOCH.
Entry: above $4,045 after breakout retest
SL: below $4,015
TP1: $4,065
TP2: $4,085
TP3: $4,100
Key levels
Current price area: $4,008
OB sell zone: $4,020–$4,030
Day high: $4,044
Sell-side liquidity: $3,973
Low area: $3,958
Target zone: $3,930
Bearish continuation confirmation: clean break below $3,973
Bullish invalidation: clean 1H close above $4,045
My current view is that gold is still holding a bearish structure. The recovery is only a pullback as long as price stays below the OB and day high. The Prime Gold plan is to wait for price to retest the OB sell zone, confirm rejection, then follow the move toward lower liquidity.
No confirmation, no trade.
Short 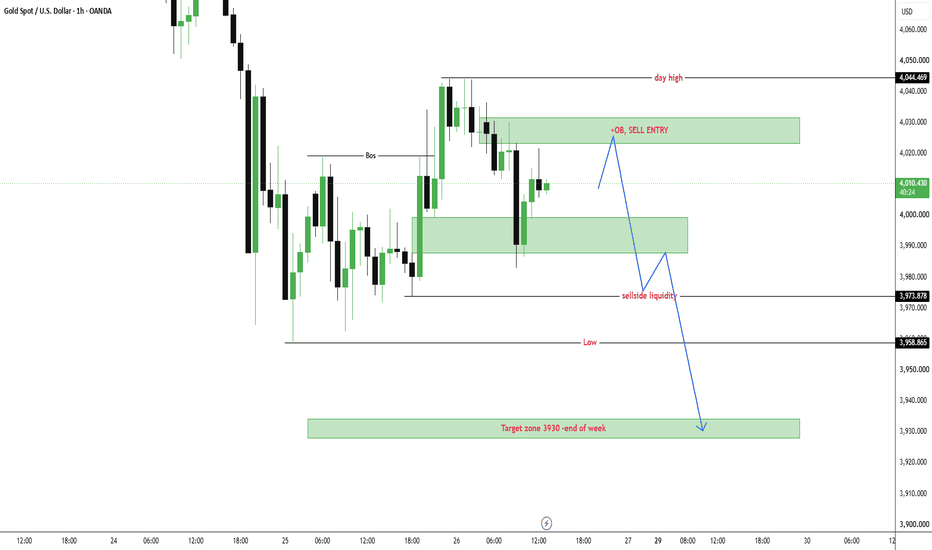
XAUUSD — EMA Downtrend, Waiting for a Value Pullback
Fundamental Analysis
Gold remains under bearish pressure as price continues to trade below the main EMA structure. Traders are still watching USD momentum, Treasury yields, and upcoming U.S. macro data.
For now, any short-term recovery should be treated as a technical pullback unless price can reclaim the EMA resistance zone with strong confirmation.
Technical Analysis
On the 2H chart, XAUUSD is still trading below EMA 34, EMA 89, and EMA 200. This confirms that the main trend remains bearish, with the EMA structure acting as dynamic resistance above price.
Price is currently around 4,003 after rejecting from the previous recovery area. The chart shows that gold may create a small corrective bounce toward the EMA value zone before continuing lower.
The first sell reaction area is around 4,045 - 4,060. A deeper pullback may reach the stronger sell swing zone around 4,078 - 4,088. If price rejects from these areas, sellers may continue to control the structure.
The main downside target is the psychological liquidity zone around 3,936 - 3,935.
Important Key Levels
Current price area: 4,003
EMA value zone: 4,045 - 4,060
Sell scalping zone: 4,059 - 4,078
Sell swing zone: 4,078 - 4,088
EMA resistance area: 4,044 - 4,126
Invalidation area: above 4,116 - 4,126
Main downside target: 3,936 - 3,935
Trading Scenario
Main Sell Scenario
Entry: 4,059 - 4,088
Stop Loss: 4,126
Take Profit 1: 4,003
Take Profit 2: 3,960
Take Profit 3: 3,936 - 3,935
Sell Condition
The preferred setup is to wait for gold to correct higher into the 4,059 - 4,088 value zone. This area aligns with the EMA reaction zone, Fibonacci structure, and previous sell pressure.
A sell setup becomes more valid if price forms bearish rejection from this zone, such as a long upper wick, bearish engulfing candle, failed breakout, or lower high below the EMA structure.
If price rejects from the sell zone and breaks back below 4,003, the bearish continuation view becomes stronger. The next downside focus would be 3,960, followed by the psychological liquidity target around 3,936 - 3,935.
Entry Conditions
Wait for price to pull back into 4,059 - 4,088.
Look for bearish rejection before entering sell.
Do not sell aggressively at the low without a pullback.
A break below 4,003 confirms stronger downside pressure.
If price breaks and holds above 4,126, the sell setup is invalid.
Overall, the main view remains bearish while XAUUSD trades below EMA 34, EMA 89, and EMA 200. Gold may create a light corrective bounce first, but the preferred plan is to wait for a reaction from the EMA value zone before looking for continuation toward 3,936 - 3,935.
Do you share the same bearish view on gold, or are you waiting for a cleaner pullback into the EMA value zone first?
Short 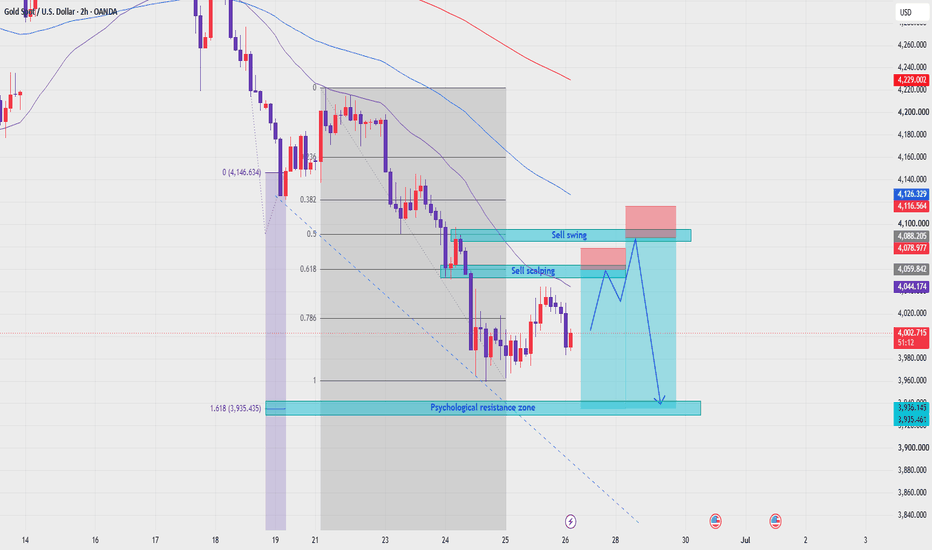
EURUSD — EMA Bearish Trend, Sell From Value Zone
Fundamental Analysis
EURUSD remains under bearish pressure as price continues to trade below the main EMA structure. Traders are still watching USD momentum, Fed expectations, and upcoming macro data.
For now, the technical structure still favours sellers while recovery attempts remain limited below EMA resistance.
Technical Analysis
On the 2H chart, EURUSD is trading below EMA 34, EMA 89, and EMA 200. This shows that the short-term trend remains bearish, with the EMA structure acting as dynamic resistance above price.
Price is currently around 1.1352 after a strong bearish move. The market is now consolidating below the previous breakdown area, but this reaction has not confirmed a bullish reversal.
The key sell value zone is around 1.1384 - 1.1405. This area aligns with the Fibonacci retracement zone, high liquidity area, and previous short-term structure. If price pulls back into this zone and rejects, sellers may continue to defend the downtrend.
The key support level is around 1.1325. If price breaks below this area with strong bearish momentum, the next downside target is the lower liquidity zone around 1.1229.
Important Key Levels
Current price area: 1.1352
Sell value zone: 1.1384 - 1.1405
Fibonacci + High Liquidity zone: 1.1384 - 1.1405
EMA resistance area: 1.1445 - 1.1533
Key support: 1.1325
Main downside target: 1.1229
Invalidation area: above 1.1405
Trading Scenario
Main Sell Scenario
Entry: 1.1384 - 1.1405
Stop Loss: 1.1533
Take Profit 1: 1.1325
Take Profit 2: 1.1280
Take Profit 3: 1.1229
Sell Condition
The preferred setup is to wait for EURUSD to pull back into the 1.1384 - 1.1405 sell value zone. This area combines Fibonacci retracement, high liquidity, and previous structure.
A sell setup becomes more valid if price forms bearish rejection from this zone, such as a long upper wick, bearish engulfing candle, failed breakout, or lower high below the EMA structure.
If price rejects from the sell zone and breaks below 1.1325, the bearish continuation view becomes stronger. The next downside focus would be 1.1280, followed by the main target around 1.1229.
Entry Conditions
Wait for price to retest 1.1384 - 1.1405.
Look for bearish rejection before entering sell.
A break below 1.1325 confirms stronger downside pressure.
If price breaks and holds above 1.1405, the short-term sell setup becomes weaker.
Overall, the main view remains bearish while EURUSD trades below EMA 34, EMA 89, and EMA 200. The preferred plan is to wait for a pullback into the Fibonacci and high-liquidity value zone, then look for sell confirmation toward 1.1325 and 1.1229.
Do you share the same bearish view on EURUSD, or are you waiting for a cleaner rejection from the value zone first?
TSLA Daily Bearish Continuation OutlookAs highlighted in my previous analysis, Tesla was expected to experience only a temporary bullish retracement, while the broader market structure remained bearish. The recent rebound toward the $415 level appears to have completed that corrective move, with price now resuming its primary bearish trajectory.
From a technical perspective, the downside targets remain unchanged, with the first target positioned at $356 and the second target at $322, as highlighted on the chart.
From a fundamental standpoint, Tesla continues to face mixed sentiment in the market. While the company is aggressively expanding its AI and autonomous driving initiatives, including the rollout of its Robotaxi service in Austin and increased investment in Full Self-Driving (FSD) technology, investors remain concerned about execution risks and growing competition in the autonomous vehicle space. Tesla's Robotaxi expansion has been slower than many expected, and competition from companies such as Waymo continues to intensify.
On the positive side, Tesla has recently reported improving vehicle sales in Europe, supported by stronger EV demand and progress toward broader FSD approvals across the region. However, the market is still closely monitoring whether Tesla can successfully deliver on its long-term AI and autonomous driving ambitions.
Overall, despite short-term bullish corrections, the higher timeframe structure continues to favor a bearish outlook unless price can reclaim and sustain levels above key resistance zones.  Short
Short
XAUUSD 1H Analysis: Bearish Structure
Gold remains under bearish pressure after sweeping buy-side liquidity near 4,378 and forming a strong rejection. The subsequent impulsive decline broke market structure around 4,220, confirming a bearish shift in order flow.
Price retraced into the 4,200–4,217 Fibonacci resistance zone (50%–61.8%) but failed to reclaim higher levels, reinforcing seller dominance. This area now acts as a bearish breaker block and remains the key zone to watch for continuation shorts.
The current structure is printing lower highs and lower lows, while price trades beneath the broken ascending trendline. As long as the market remains below 4,217, the path of least resistance favors further downside.
Key Levels
Major Resistance: 4,217 (0.618 Fib)
Secondary Resistance: 4,275–4,278 (Supply / Liquidity Zone)
Current Support: 4,155
Bearish Targets: 4,113 → 4,068
Bearish Outlook
A rejection from the 4,200–4,217 zone could trigger another leg lower toward 4,113, where sell-side liquidity rests beneath recent lows. A break below that level may expose the next demand zone around 4,068.
Invalidation
The bearish scenario weakens if buyers achieve a sustained hourly close above 4,217, with stronger bullish confirmation above 4,278.
Bias: Bearish 📉
Structure: Bearish BOS + Lower High Formation
Targets: 4,113 → 4,068
Invalidation: Above 4,217 / 4,278 Short 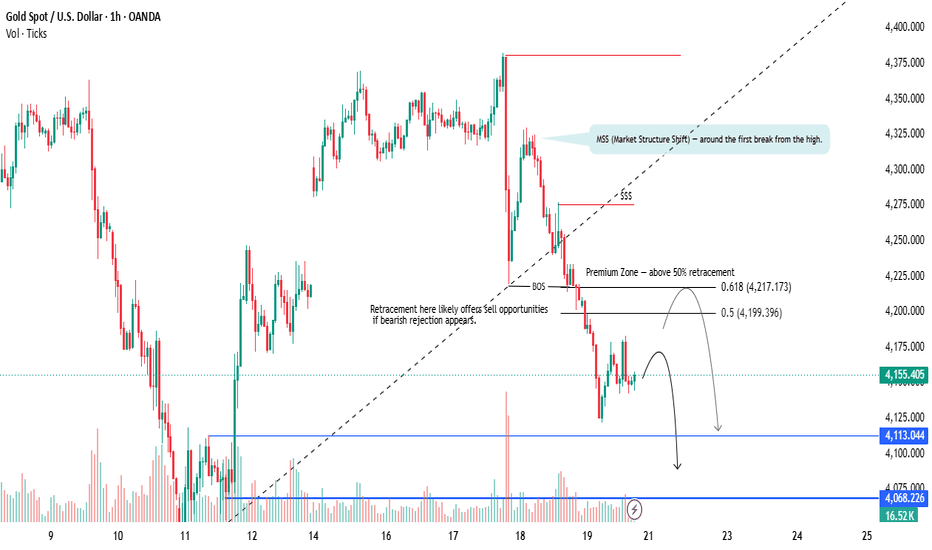
US GDP volatility — 4,040 FVG mitigation vs. 3,900 macro⚖️ Macro Backdrop: US GDP as the Ultimate Volume Catalyst
Gold markets enter a high-voltage consolidation phase hovering just under the 4,000 psychological barrier as global investors brace for the crucial U.S. GDP data release tonight. The persistent fundamental weight of elevated U.S. 10-Year Treasury yields and strong Dollar Index (DXY) traction continues to heavily cap bullion’s long-term recovery efforts. Institutional order flow is utilizing this pre-news quiet window to engineer strict liquidity traps. Tonight's macroeconomic release will serve as the volume trigger, but the primary smart money directive remains firmly locked into an aggressive premium distribution and markdown cycle.
📉 Technical Narrative: Imbalance Retest Within Aggressive Bearish Order Flow
The structural layout on the M30 chart showcases a textbook institutional distribution framework operating under a heavily dominant bearish trend:
1. Bearish Order Flow Control: XAUUSD maintains a clean structural markdown phase, verified by a definitive series of consecutive lower-timeframe Break of Structure (BOS) points down to the 3,994.630 floating zone.
2. The Premium FVG Ceiling (4,040 - 4,055 Area): Intraday price action is projected to deliver a quick pre-news corrective relief drive up into this unmitigated Fair Value Gap. This temporary bounce acts as a clean buy-side inducement designed to trap early retail breakout traders.
3. Liquidity Target Floor 1 (3,950 — 3,965 Area): Following the FVG premium mitigation, the pre-engineered black ziczac path maps a violent rejection down into this internal demand block to wash out weak long stops.
4. The Ultimate Destination Floor (3,890 — 3,905 Area): The ultimate magnet for this weekly cycle is the Major Sell-Side Liquidity (SSL) Pool resting at the deep HTF discount demand zone below. Smart money requires a complete sweep of this floor to accumulate major long inventory.
🔄 IF-THEN Playbook (Execution Scenarios):
• IF price expands into the 4,040 Premium FVG Ceiling and prints a clear lower-timeframe structural failure (M1/M5 CHoCH Rejection) -> THEN trigger premium short positions targeting the 3,955 intermediate support and the 3,900 ultimate macro bottom.
• IF price invalidates this setup by printing a solid M30 candle close above the 4,060 level -> THEN the immediate bearish expansion path is paused, and we step aside to wait for the GDP data stabilization.
🎯 Trading Metrics Summary:
• Current Floating Price: 3,994.630
• Premium Re-entry Zone: 4,040.000 — 4,055.000 (Waiting for LTF CHoCH)
• Intermediate Take Profit: 3,955.000 Area
• Ultimate Macro Target Floor: 3,890.000 — 3,905.000 (Major SSL Pool)
• Structural Invalidation Point: Solid M30 close above 4,060.000
💡 Trader Question:
Are you attempting to scalp long this pre-news rally up to the 4,040 FVG ceiling, or are you sitting on your hands waiting to short the premium rejection post-GDP? Let me know your playbook in the comments below! Long 
Gold Pre-GDP & PCE Blueprint—Final markdown to $3,800Market Overview
• Macro Driver: The global financial market enters a state of extreme compression ahead of tonight's high-impact US macro data sequence, featuring the Q1 GDP Preliminary report and the critical Core PCE Price Index. With Fed Chairman Kevin Warsh maintaining a highly hawkish "higher-for-longer" baseline, any hot data print will act as a major catalyst to catapult the US Dollar Index (DXY) upward, severely suffocating non-yielding assets like Gold.
• Market Condition: Institutional order flow remains firmly net-bearish. Smart money is actively defending macro supply barriers and using localized internal relief bounces solely as liquidity-engineering traps to accumulate heavy premium short exposure.
Technical Context
• Structure: Mid-Term Bearish Expansion. The 2H timeframe demonstrates a textbook bearish markdown cycle, strictly governed by a dominant descending Trendline. Following consecutive structural breakdowns (BOS) and local Change of Character (CHoCH) shifts, price has successfully mitigated an internal Fair Value Gap (FVG) around $4,040 - $4,060 and is initiating the next impulsive leg down.
• Liquidity & Imbalance: The algorithm is currently drawing price magnetically down to sweep the major Sell-Side Liquidity (SSL) pools resting at the $3,900 and $3,800 institutional demand targets. Retail buyers attempting to catch the falling knife are merely providing the necessary counter-liquidity for the next flush.
Key Zones
• Macro Trendline Resistance / FVG Floor: 4,040.000 - 4,060.000
• Immediate Pivot Price Level: 3,981.555
• Intermediate Support Target: 3,900.000 (Box Array)
• Ultimate Liquidity Pool: 3,800.000 (Major Demand Box)
Trading Plan (IF–THEN)
• IF price delivers a choppy intraday correction to test the current local pivot or the FVG zone at 4,040 before the high-impact news AND validates lower-timeframe bearish displacement (M15 order block rejection) -> THEN execute Short positions targeting the first support box at 3,900, with an extended expansion target down to the macro floor at 3,800.
• IF price completely invalidates the descending trendline by securing a strong, decisive 2H candle close above 4,060 -> THEN the immediate bearish continuation narrative is temporarily paused, shifting the local bias into a deeper corrective distribution phase.
MMFLOW View
• Bias: Corrective Bearish Bias. Trading against this heavy institutional markdown momentum is an uncalculated risk. Our mathematical edge heavily favors capitalizing on premium pullbacks or breakdown confirmations, targeting the massive unmitigated $3,800 liquidity pool as the ultimate target.
Are you shorting the pre-news consolidation toward $3,900, or do you think a dovish PCE surprise will trigger a massive short-squeeze above the trendline?
Drop your thoughts in the comments below! Like, Follow, and check out my Profile to lock into our real-time community tracking updates. XAUUSD — EMA Bearish Trend, Fibonacci Confluence Target in Focus
Fundamental Analysis
Gold remains under pressure as price continues to trade below the main EMA structure. Traders are still watching USD momentum, Treasury yields, and upcoming U.S. macro data.
For now, the technical structure still favours sellers while recovery attempts remain weak below EMA resistance.
Technical Analysis
On the 2H chart, XAUUSD is trading below EMA 34, EMA 89, and EMA 200. This confirms that the short-term trend remains bearish, with the EMA structure acting as dynamic resistance above price.
Price is currently around 3,983 after a strong bearish continuation move. The market has already broken below the previous support area and is now moving toward the lower Fibonacci liquidity zones.
The key value sell zone is around 4,054 - 4,068. This area aligns with the Fibonacci retracement level, previous structure, and EMA resistance. If gold pulls back into this zone and fails to break higher, sellers may continue to defend the trend.
Below current price, the first important target is around 3,936 - 3,934, which aligns with the Fibonacci 1.618 area. If bearish momentum continues, the deeper target is the Fibonacci confluence zone around 3,810 - 3,804.
Important Key Levels
Current price area: 3,983
Main sell value zone: 4,054 - 4,068
EMA resistance area: 4,054 - 4,099
Short-term invalidation: above 4,099
First Fibonacci target: 3,936 - 3,934
Deeper bearish target: 3,917
Fibonacci confluence target zone: 3,810 - 3,804
Trading Scenario
Main Sell Scenario
Entry: 4,054 - 4,068
Stop Loss: 4,099
Take Profit 1: 3,936
Take Profit 2: 3,917
Take Profit 3: 3,810 - 3,804
Sell Condition
The preferred setup is to wait for gold to pull back into the 4,054 - 4,068 Fibonacci and EMA value zone. This area is important because it aligns with the bearish EMA structure and the previous reaction zone.
A sell setup becomes more valid if price forms bearish rejection from this zone, such as a long upper wick, bearish engulfing candle, failed breakout, or lower high below the EMA range.
If price rejects from the sell zone and breaks back below 3,983, the bearish continuation view becomes stronger. The next downside focus would be 3,936 - 3,934, followed by 3,917 and the Fibonacci confluence target zone around 3,810 - 3,804.
Entry Conditions
Wait for price to retest 4,054 - 4,068.
Look for bearish rejection before entering sell.
Do not sell directly at the low without a pullback.
A break below 3,936 confirms stronger downside pressure.
If price breaks and holds above 4,099, the sell setup is invalid.
Overall, the main view remains bearish while XAUUSD trades below EMA 34, EMA 89, and EMA 200. The preferred plan is to wait for a pullback into the Fibonacci and EMA value zone, then look for sell confirmation toward 3,936, 3,917, and the Fibonacci confluence target around 3,810 - 3,804.
Do you share the same bearish view on gold, or are you waiting for a cleaner retest of the EMA value zone first?
Short 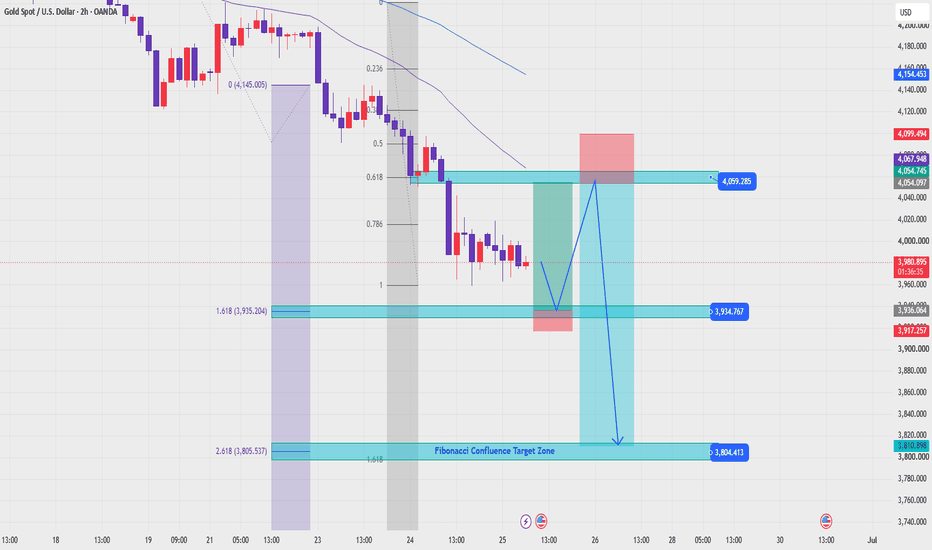
Liquidity and Market Movement:Many traders believe markets move randomly.
One day price breaks a resistance level and rallies. The next day it breaks the same type of level and immediately reverses. Sometimes a stop loss gets hit perfectly before the market moves exactly in the expected direction.
After experiencing this enough times, traders begin asking the same question:
Is the market really random, or is it moving toward something?
The answer often lies in one of the most important concepts in modern price action:
* Liquidity.
Understanding liquidity can completely change the way you view charts. Instead of seeing random candles and unpredictable movements, you begin to understand why price is attracted to certain areas and why some moves happen before the real move begins.
What Is Liquidity?
In simple terms, liquidity is where a large number of buy and sell orders exist.
Financial markets need liquidity to function.
Large institutions cannot simply place massive orders whenever they want. They need enough participants on the opposite side of the trade.
Because of this, price is often drawn toward areas where many orders are waiting.
Think of liquidity as fuel.
Without fuel, the market cannot make significant moves.
Why Stop Losses Attract Price
One of the biggest misconceptions among retail traders is that stop losses are hidden from the market.
In reality, stop-loss orders often gather around obvious chart levels.
For example:
Above major resistance
Below major support
Above previous highs
Below previous lows
Around trendline breaks
When many traders place stop losses in the same location, those areas become liquidity pools.
Price may move toward these zones because they contain the orders institutions need to fill larger positions.
This is why traders often feel like the market "hunted" their stop loss.
The market is not targeting individual traders.
It is seeking liquidity.
Equal Highs and Equal Lows
Equal highs and equal lows are among the clearest signs of potential liquidity.
When multiple highs form at the same level, many traders see resistance.
Short sellers enter positions.
Breakout traders place buy-stop orders above the highs.
At the same time, short sellers place stop losses above those highs.
All of these orders create liquidity.
As a result, price is often attracted to equal highs before making its next major decision.
The same principle applies to equal lows.
These areas act like magnets because of the concentration of orders sitting there.
The Truth About Breakout Traps
Every trader has experienced a breakout that looked perfect.
Price breaks resistance.
Volume increases.
Momentum appears strong.
Then suddenly the market reverses and moves in the opposite direction.
This is known as a breakout trap.
The breakout itself may have been enough to trigger buy orders and stop losses, providing liquidity for larger participants.
Once sufficient liquidity is collected, the market can move in its intended direction.
This is why experienced traders often wait for confirmation rather than entering immediately after every breakout.
Patience can be one of the best forms of risk management.
Institutional Movement and Market Behavior
Large institutions operate differently from retail traders.
They manage positions worth millions or even billions of dollars.
Because of their size, they cannot simply enter trades with a single click.
They need liquidity.
This is why institutional activity is often associated with:
Liquidity grabs
Stop-loss sweeps
False breakouts
Sharp reversals
Strong reactions at key levels
While retail traders focus on candles, institutions often focus on where orders are concentrated.
Understanding this difference helps explain many market movements that initially seem confusing.
Liquidity Before Direction
One of the most valuable lessons a trader can learn is that price often seeks liquidity before revealing its true direction.
A market may sweep highs before falling.
It may sweep lows before rallying.
It may trigger breakout traders before reversing.
The purpose is often the same:
To access liquidity.
Once that liquidity is available, the market can continue its larger move.
This idea helps traders avoid emotional decisions and encourages them to focus on the bigger picture.
Final words:
Liquidity is one of the hidden forces that drive financial markets.
It explains why price often moves toward obvious levels.
It explains many false breakouts and stop-loss sweeps.
And it helps traders understand that the market is not simply moving from one candle to the next.
It is constantly searching for liquidity.
When you begin looking at charts through the lens of liquidity, you stop asking why your stop loss was hit.
Instead, you start asking where liquidity is located and where price is most likely to go next.
That shift in perspective can completely change the way you understand market movement.
Gold under 4,000 for the First Time in 7 Months! What's next?🗺️ The Macro Blueprint: Mapping Gold's Higher-Timeframe Destination
Following up on our textbook $4,024 intraday target hit, it is time to zoom out to the Daily chart. Looking at the broader structural landscape, the institutional narrative is clear, and the bears are firmly in the driver's seat.
Now that near-term retail sell-stops have been thoroughly cleared, the market is turning its attention toward a much more significant, long-term pool of liquidity.
📉 Higher-Timeframe Structural Breakdown
The Ultimate Target: Major Higher-Timeframe Liquidity (Gold Bias: Long-Term Bearish)
As mapped out by the primary trend line on the Daily chart, a massive pool of untouched, major sell-side liquidity (XXX) is resting at the historical swing lows from late last year at 3888. In a sustained bearish expansion cycle, these long-term lows act like an absolute magnet for institutional algorithms. This remains our primary macro destination.
The Engineered Liquidity Path (The Zig-Zag) (Gold Bias: Short-Term Neutral/Consolidation)
Markets rarely expand to major daily targets in a single straight line. As drawn on the blueprint, expect the market to begin engineering liquidity over the coming weeks. This means we will likely see a corrective, choppy zig-zag sub-structure play out first. This process traps late breakout shorts and builds fresh buyer inducement before the next real drop.
The Premium Daily POI Mitigation (Gold Bias: Premium Shorting Zone)
During this corrective phase, a pullback to test the premium supply block at the Daily POI remains highly probable from 4137 to 4221 zone. A shallow or deep test of this zone will allow large institutions to mitigate remaining buy orders and distribute fresh short positions at premium prices before launching the final flush toward our major macro targets.
⚠️ Execution Disclaimer & Catalyst Warning
The macro path is set, but immediate timing will depend heavily on tomorrow's US Core PCE Price Index release. High-impact macro data can easily accelerate these structural phases.
Why Gold Remains Super Bearish in the Short Term:
Behind this technical chart layout sits a heavy fundamental weight that is aggressively punishing buyers. The combination of a relentlessly rising US Dollar and strong rumors of another Fed interest rate hike by December means the opportunity cost of holding non-yielding gold is simply too high for big funds. Simultaneously, as money rushes directly back into stocks due to easing geopolitical tensions, the defensive demand for gold has completely dried up.
Do not chase the market at these immediate lows. Let the structural engineering play out, manage your risk, and wait for premium prices at the structural turn to present your entries.
Disclaimer: Educational purposes only. No tips or financial advice. XAUUSD — Bearish Structure Holds, Sell Bias Below 4018
Gold is trading around $3,982 after forming a light accumulation phase near the lower range. Price has slowed down after the recent sell-off, but the main structure is still bearish as long as gold remains below the descending trendline and below the $4,018 invalidation area.
From an SMC perspective, gold has already created multiple MSS confirmations to the downside. The current sideways movement looks more like liquidity accumulation than a clear bullish reversal. This means sellers may still defend the $4,000–$4,018 area if price retests it and fails to break structure.
The key level for today is $4,018. As long as price stays below this level, the sell bias remains valid. A clean break above $4,018 and especially above the descending trendline would be the first signal that gold may shift into a short-term bullish reversal structure.
Sell setup 1
Condition:
Gold retests the liquidity accumulation zone around $4,000–$4,018 and shows bearish rejection with lower timeframe MSS / CHOCH.
Entry: $4,000–$4,018
SL: above $4,035
TP1: $3,950
TP2: $3,925
TP3: $3,886
Sell setup 2
Condition:
If gold breaks below $3,950 and retests this area as resistance, bearish continuation remains valid.
Entry: below $3,950 after retest
SL: above $3,985
TP1: $3,925
TP2: $3,900
TP3: $3,886
Buy setup
Condition:
Buying is not the priority. A buy setup is only valid if gold breaks above $4,018, closes above the descending trendline, and confirms bullish MSS / CHOCH.
Entry: above $4,018 after breakout retest
SL: below $3,980
TP1: $4,050
TP2: $4,085
TP3: $4,120
Key levels
Current price area: $3,982
Liquidity accumulation zone: $3,960–$4,018
Main sell reaction area: $4,000–$4,018
Sell-side liquidity H4: $3,925–$3,935
Key support zone: $3,886
Bearish continuation confirmation: clean break below $3,950
Bullish reversal confirmation: clean break above $4,018 and above the trendline
Bearish invalidation: clean 2H close above $4,018
My current view is that gold is still in a bearish structure while price trades below $4,018. The current accumulation may create short-term noise, but unless price breaks the trendline and confirms a bullish shift, the priority remains selling from resistance toward the lower liquidity zones.
No confirmation, no trade.
Short 
 Long
Long
XAUUSD: Main Trend Still BearishXAUUSD: Main Trend Still Bearish, Waiting for Confirmation Around 4,008
Market Context
Gold remains under strong bearish pressure after continuing to trade inside a clear downward structure. The latest price action shows that sellers are still controlling the market, while buyers are only trying to build a corrective rebound from the lower liquidity area.
At the moment, the key question is not whether gold has reversed, but whether price can hold above the 4,008 trendline area long enough to create a valid recovery. Without confirmation, any bounce should still be treated as corrective.
Technical Structure
Gold is currently trading around 3,989 after reacting from the strong liquidity zone near 3,964. The main trend remains deeply bearish, supported by the descending trendline and multiple BOS signals on the chart.
The 3,964 area is the major downside level to watch. If price breaks below this zone with strength, bearish continuation may open toward lower liquidity levels.
However, if gold holds above the 4,008 trendline area and forms bullish confirmation, a corrective rebound can happen first. The nearest upside reaction zone is 4,036, followed by the next target around 4,083.
The key sell area above remains the OB zone around 4,180 - 4,200. If price recovers into this zone and rejects, sellers may return again for the next bearish leg.
Key Levels
Current Price: 3,989
Strong Liquidity Support: 3,964
Trendline Confirmation Area: 4,008
Buy-side Liquidity / Sell Order Zone: 4,036
Corrective Rebound Target: 4,083
Major Sell Swing OB Zone: 4,180 - 4,200
Bearish Continuation Level: Below 3,964
Trading Plan
Buy Scenario: Corrective Rebound
Entry: Above 4,008 after bullish confirmation
Stop Loss: Below 3,964
Take Profit 1: 4,036
Take Profit 2: 4,083
Take Profit 3: 4,120
Conditions: Price must hold above the 4,008 trendline area. Bullish rejection or CHOCH appears on the lower timeframe. Price reclaims 4,018 with strength. Buyers defend the 3,964 liquidity zone. Avoid buying if price breaks below 3,964.
Sell Scenario: Trend Continuation
Entry: Below 3,964 after confirmed breakdown and retest
Stop Loss: Above 4,008
Take Profit 1: 3,940
Take Profit 2: 3,920
Take Profit 3: 3,900
Conditions: Price breaks below the 3,964 strong liquidity zone. Retest of the broken level fails. Bearish momentum continues after breakdown. Price remains below the descending trendline. Sellers continue to create lower highs.
Alternative Sell Scenario: Sell From OB Zone
Entry: 4,180 - 4,200 after bearish confirmation
Stop Loss: Above 4,220
Take Profit 1: 4,083
Take Profit 2: 4,036
Take Profit 3: 3,964
Conditions: Price recovers into the OB sell zone. Strong bearish rejection appears. Price fails to hold above the OB zone. Market structure remains bearish.
Overall Bias
The main trend is still bearish. Gold is only attempting a corrective rebound from the lower liquidity area, but the recovery needs confirmation above the 4,008 trendline.
If price holds above 4,008, a short-term rebound toward 4,036 and 4,083 may appear. If price breaks below 3,964, bearish continuation becomes the priority again.
For now, the best approach is to wait for confirmation around 4,008 and 3,964 instead of chasing price in the middle.
What do you think — will gold hold above 4,008 for a corrective rebound, or break below 3,964 and continue the main bearish trend?
Long 
XAUUSD – Bearish Structure Remains Strong Below IchimokuMASON XAUUSD – Bearish Structure Remains Strong Below Ichimoku
XAUUSD is trading around 3,971 after a strong bearish continuation. Price remains inside the descending channel and below the Ichimoku cloud, so the main structure is still bearish.
The priority view remains sell setups, especially if price retests the short-term sell zone.
Technical View
Gold is still moving in a clear downtrend channel. The market continues to create lower highs and lower lows, showing that sellers are controlling the short-term structure.
Price has broken below the important support area around 4,030–4,052. This broken support can now act as resistance if gold tries to recover.
Ichimoku also supports the bearish view. Price is trading below the cloud, and the cloud above price is acting as dynamic resistance. As long as gold stays below the cloud, recovery attempts should be treated as pullbacks.
The sell order zone around 3,982–3,992 is the nearest area to watch. If price pulls back into this zone and shows bearish rejection, the downside move may continue toward the Fibonacci target area near 3,904.
The 4,018 level is important for short-term recovery confirmation. If gold breaks and holds above this level, sellers may need to wait for a deeper retest before entering again.
Key Zones
Current price: 3,971
Sell order zone: 3,982–3,992
Recovery confirmation: 4,018
Broken support / resistance: 4,030–4,052
Fibonacci target area: 3,904
Invalidation: above 4,052
Trading Plan
Sell Priority: 3,982–3,992
Condition: wait for bearish rejection, lower high, or failed recovery above 4,018.
SL: above 4,018
TP1: 3,940
TP2: 3,904
TP3: lower channel area
Alternative Scenario
If gold breaks above 4,018 and holds, wait for a deeper retest around 4,030–4,052 before looking for the next sell confirmation.
Buy View
Buy is not the priority while price stays below the Ichimoku cloud and inside the descending channel. A short-term buy reaction may appear near 3,904, but it needs clear bullish confirmation first.
Final View
Overall, gold remains under strong bearish pressure. As long as price stays below 4,018–4,052, sell continuation remains the cleaner setup, with the Fibonacci target around 3,904 as the next key area.
Will gold retest the sell zone first, or continue directly toward the Fibonacci target?
Short 
YES Bank at a Decisive Resistance: Breakout or Another RejectionYES Bank has rallied strongly from its long-term ascending support trendline and is now approaching a critical resistance zone near ₹25–26. This trendline has acted as a major supply area over the past several months, with multiple price rejections preventing a sustained uptrend. The current price action suggests that the stock is once again testing this key level, making the coming weeks crucial for its next directional move.
Bullish Scenario
If YES Bank manages to break above the rising resistance trendline with strong weekly closing volumes, it would signal a structural breakout after a prolonged consolidation. Such a move could attract fresh buying interest and open the door for an advance toward the ₹28 zone initially, followed by a medium-term target near ₹32. A successful breakout would also confirm a higher high, strengthening the overall bullish trend.
Bearish Scenario
If the resistance once again holds and buyers fail to push the price above ₹26, profit booking may emerge. In this case, the stock could retrace toward the rising support trendline near ₹19–20, where buyers are expected to step in again. A breakdown below this support would weaken the current structure and delay any bullish breakout expectations.
Technical View
The chart currently reflects a compression pattern, with rising support meeting rising resistance. Such structures often lead to sharp directional moves once the breakout occurs. Traders should avoid anticipating the breakout and instead wait for price confirmation before initiating fresh positions.
Key Levels
Resistance: ₹25–26
Breakout Target 1: ₹28
Breakout Target 2: ₹32
Major Support: ₹19–20
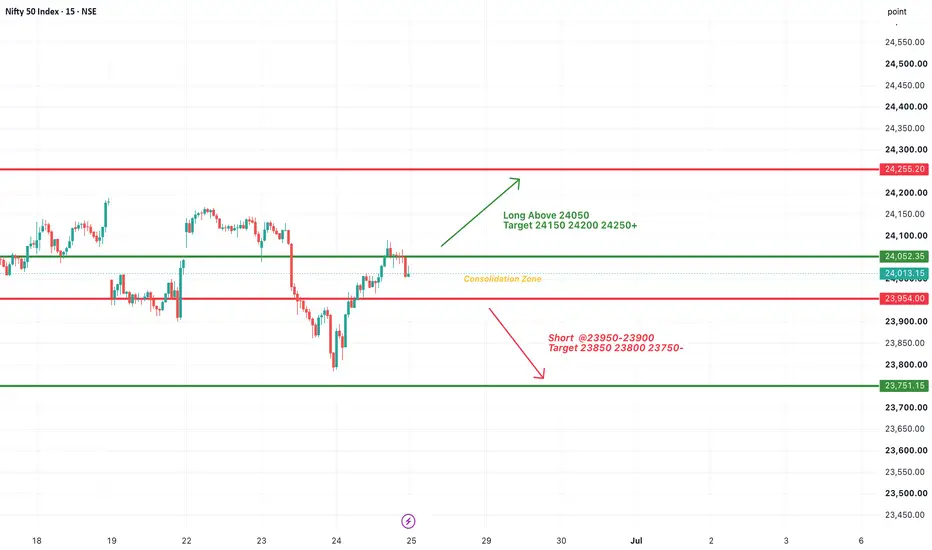
YES Bank is approaching a make-or-break zone where both buyers and sellers are expected to become highly active. A confirmed breakout above resistance could mark the beginning of a fresh medium-term rally, while another rejection may lead to a healthy pullback toward the rising support trendline before the next major move. #NIFTY Intraday Support and Resistance Levels - 25/06/2026Nifty is expected to open with a gap-up bias around the 24025–24050 zone after witnessing a strong recovery from lower levels in the previous session. The index has reclaimed its immediate support zone and is consolidating just below a crucial breakout level, indicating that bullish momentum is gradually building.
For today's session, 24050 remains the immediate breakout level to watch. A sustained move above 24050 can trigger fresh buying momentum towards 24150, 24200, and 24250+ levels. The index is currently trading in a consolidation range near resistance, and a decisive breakout above this zone could lead to a fresh upside rally.
On the downside, 23950–23900 remains the key support zone for intraday traders. Any weakness below this range may invite profit booking towards 23850, 23800, and 23750 levels. However, as long as Nifty holds above the 23950 support area, the overall trend continues to favor the bulls. #BANKNIFTY Intraday PE & CE Levels(25/06/2026)Bank Nifty is expected to open with a gap-up bias around the 58150–58200 zone, supported by strong buying momentum after a sharp recovery from lower levels in the previous session. The index has reclaimed key support zones and is now trading near an important breakout area, indicating that bullish sentiment remains intact.
For today's session, 58050 remains the immediate breakout level to watch. A sustained move above 58050 can trigger fresh buying momentum towards 58250, 58350, and 58450+ levels. If Bank Nifty manages to cross and sustain above 58550, the rally may extend further towards 58750, 58850, and 58950+ levels.
On the downside, 57950–57900 remains the key support zone for intraday traders. Any weakness below this range may invite profit booking towards 57750, 57650, and 57550 levels. However, as long as the index remains above 58050 and the immediate support zone, the overall trend continues to favor the bulls. MASON XAUUSD – Downtrend Still Dominates, Rebound Is Secondary
XAUUSD is trading around 4,062 after another strong bearish move. Price remains below the Ichimoku cloud and below the broken trendline, so the main structure is still bearish.
The primary view is sell continuation, while the secondary scenario is a short technical rebound before the next confirmation.
Technical View
Gold is still moving under clear bearish pressure after breaking the previous trendline support. The latest reaction around 4,054 shows that price is testing a strong liquidity area, but buyers have not confirmed a real reversal yet.
Price Action is still forming lower highs and lower lows. This means any recovery should be treated as a pullback unless gold can break back above the confirmation level at 4,145.
Ichimoku also supports the bearish structure. Price is below the cloud, and the cloud above price is acting as resistance. As long as gold stays below the cloud, sellers still have better control.
The 4,106–4,111 area is the first sell zone. If price rebounds into this zone and rejects, the downside move may continue toward 4,054 and 4,024.
The second sell area is around 4,175–4,195. This zone is stronger but needs clear bearish rejection before any sell setup.
Key Zones
Current price: 4,062
Strong liquidity: 4,054
Medium-term downtrend confirmation: 4,024
Sell zone 1: 4,106–4,111
Buy recovery confirmation: 4,145
Sell zone 2: 4,175–4,195
Resistance: 4,221
Psychological target: 3,960–3,975
Invalidation: above 4,221
Trading Plan
Sell Priority: 4,106–4,111
Condition: wait for bearish rejection, lower high, or failed recovery above the broken trendline.
SL: above 4,145
TP1: 4,054
TP2: 4,024
TP3: 3,960–3,975
Second Sell Setup
Sell Zone: 4,175–4,195
Condition: only consider this zone if gold rebounds deeper and rejects below the Ichimoku cloud.
SL: above 4,221
TP1: 4,106
TP2: 4,054
TP3: 4,024
Alternative Scenario
If gold breaks and holds above 4,145, a short recovery wave may appear toward 4,175–4,195. However, this is still only a rebound unless price breaks above 4,221.
Buy View
Buy is not the priority while price stays below the Ichimoku cloud. A buy setup only becomes safer if gold holds above 4,145 and confirms strength back into the cloud.
Final View
Overall, gold is still in a bearish structure. The cleaner plan is to wait for a rebound into resistance, then look for sell confirmation. If 4,054 and 4,024 fail, the psychological target around 3,960–3,975 may become the next focus.
Will gold rebound into the sell zone first, or continue straight toward the psychological target?
Short 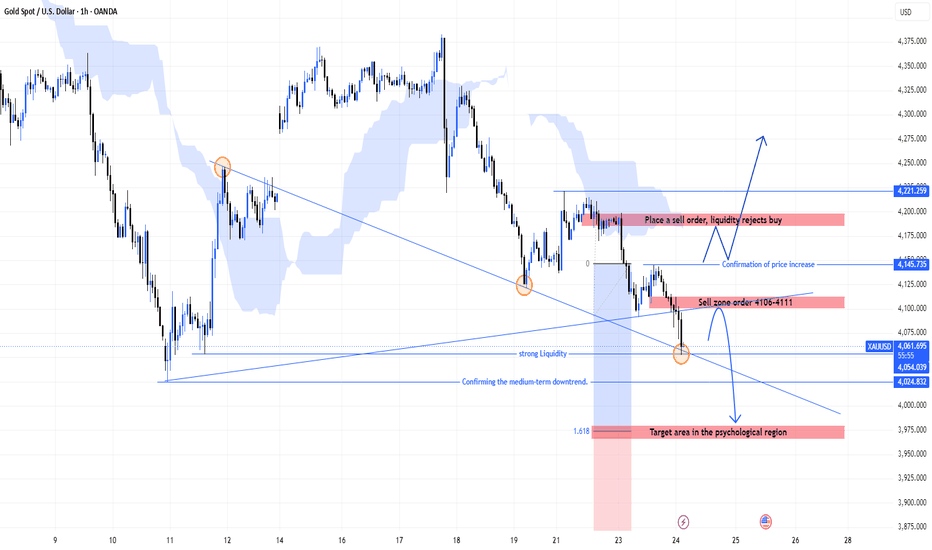
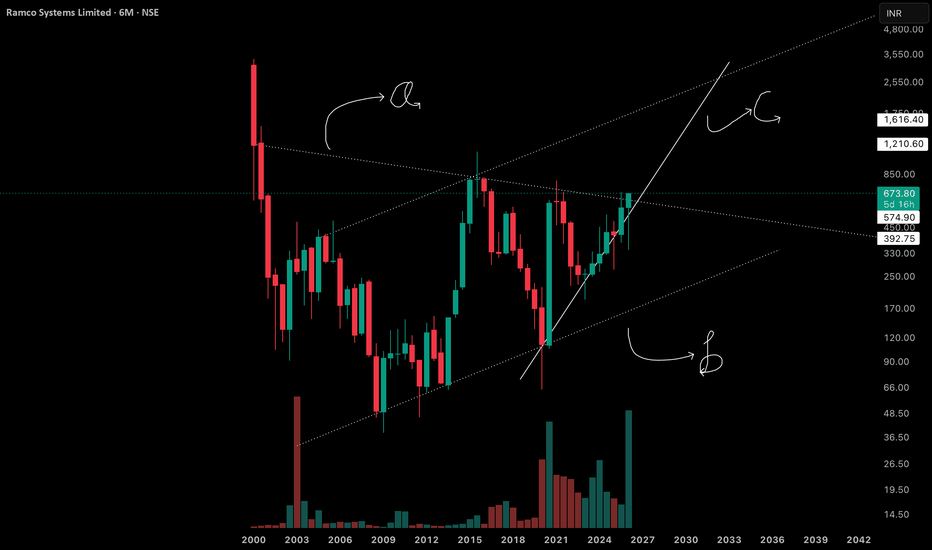
One Chart, Multi Patterns: Reading the Layers Hidden on 6MEvery candle on this chart represents six months — so what you’re looking at isn’t days or weeks of behavior, it’s years compressed into a single structure
A — The Symmetrical Triangle
Marked at point A is the upper resistance line of a symmetrical triangle, drawn as a dotted line converging downward.A symmetrical triangle forms when buyers and sellers gradually compress price into a tightening range — highs get lower, lows get higher, and volatility contracts. On a six-month-per-candle chart, this isn’t a short-term squeeze; it’s a multi-year contraction, which makes the eventual resolution of this pattern far more significant than it would be on a lower timeframe.
B — The Lower Support, and the Hidden Parallel Channel
Point B marks the lower boundlary of that same symmetrical triangle — but here’s the layer most people miss. Running parallel to this support line is a separate ascending channel, climbing alongside it. This is the real lesson of this chart: markets rarely respect just one pattern at a time. A symmetrical triangle and a parallel ascending channel can coexist within the same price structure, and recognizing both means you’re reading the chart’s full context, not just the most obvious shape on it. Location and structure layering matter more than spotting a single textbook pattern in isolation.
C — The Steep Trendline Beneath It All
Point C is a separate, much steeper trendline — a solid line acting as a foundational support for the entire structure above it.
Disclaimer: This post is for educational and informational purposes only. It does not constitute financial advice, a forecast, or a recommendation to buy, sell, or hold any security  Long
Long