Support and Resistance BasicsIf you ask experienced traders what they look at first on a chart, many will give the same answer:
Support and Resistance.
These are not magical lines that predict the future. Instead, they represent areas where buyers and sellers have previously shown strong interest. They are levels where emotions, decisions, and market psychology become visible on the chart.
Have you ever noticed how price often stops falling at a certain area and suddenly bounces back? Or how an uptrend pauses near a previous high and struggles to move further?
That is support and resistance in action.
Horizontal Support and Resistance
The easiest way to identify these levels is by looking at previous highs and lows.
A support level is an area where buyers step in and prevent prices from falling further.
A resistance level is an area where sellers become active and prevent prices from moving higher.
These zones are important because traders remember them. Institutions remember them. The market remembers them.
And when price returns to these areas, reactions often occur again.
Dynamic Support and Resistance
Support and resistance are not always horizontal.
Moving averages, trendlines, and channels can also act as dynamic support and resistance.
During strong uptrends, price may repeatedly bounce from a rising trendline.
During downtrends, a moving average can act as resistance and push price lower.
These levels move with the market and help traders understand the strength of a trend.
Breakout or Fakeout?
One of the most exciting moments in trading is a breakout.
Price finally breaks above resistance or below support.
But not every breakout is real.
Sometimes price moves beyond a level only to reverse quickly and trap traders who entered too early.
This is known as a fakeout.
The difference between a breakout and a fakeout often comes down to patience.
Waiting for confirmation can save traders from many unnecessary losses.
Retest Entries: Let the Market Confirm First
Professional traders rarely chase price.
Instead, they often wait for a breakout and then look for a retest.
For example:
Price breaks resistance.
Later, it comes back to test the same level.
If buyers defend that area and price starts rising again, the old resistance may become new support.
This approach allows traders to enter with more confidence and better risk management.
Stop Loss Placement Matters
Even the best support or resistance level can fail.
That is why stop losses are essential.
A stop loss should not be placed randomly.
It should be placed at a level where your trading idea becomes invalid.
Because trading is not about being right every time.
It is about protecting capital while allowing winning trades to grow.
Final words:
Support and resistance are among the simplest concepts in trading, yet they remain some of the most powerful.
They reveal where buyers and sellers are active.
They help traders identify opportunities.
And most importantly, they teach an important lesson:
The market does not react because of lines on a chart.
It reacts because of human behavior.
 Education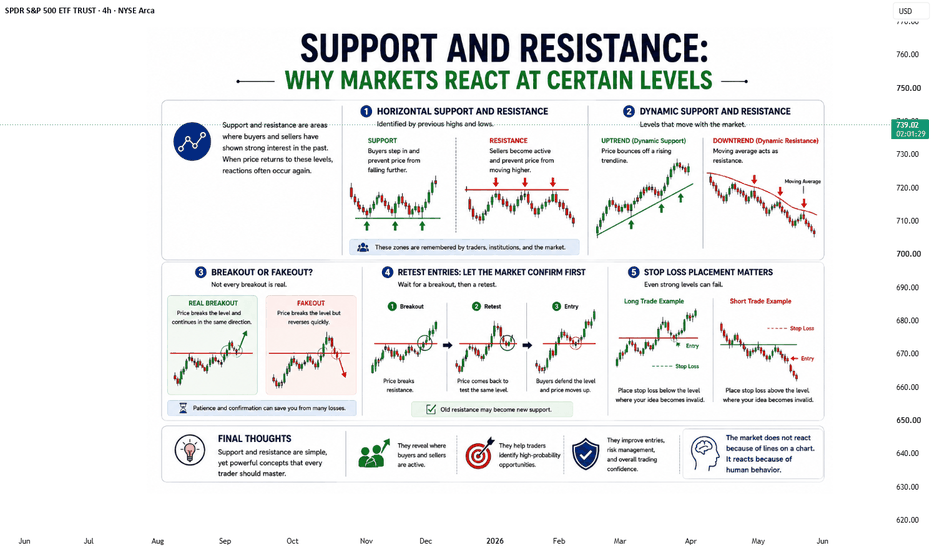
 Short
Short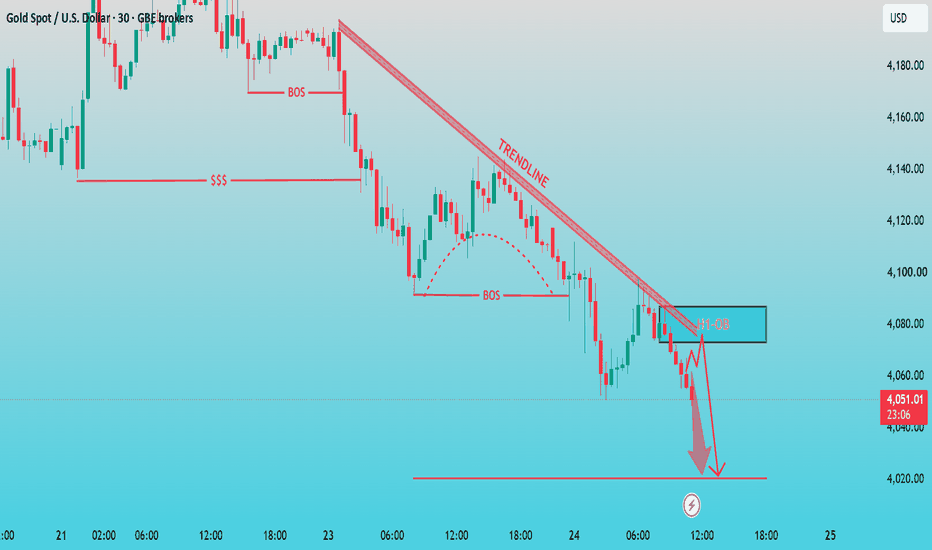
Long 
Long 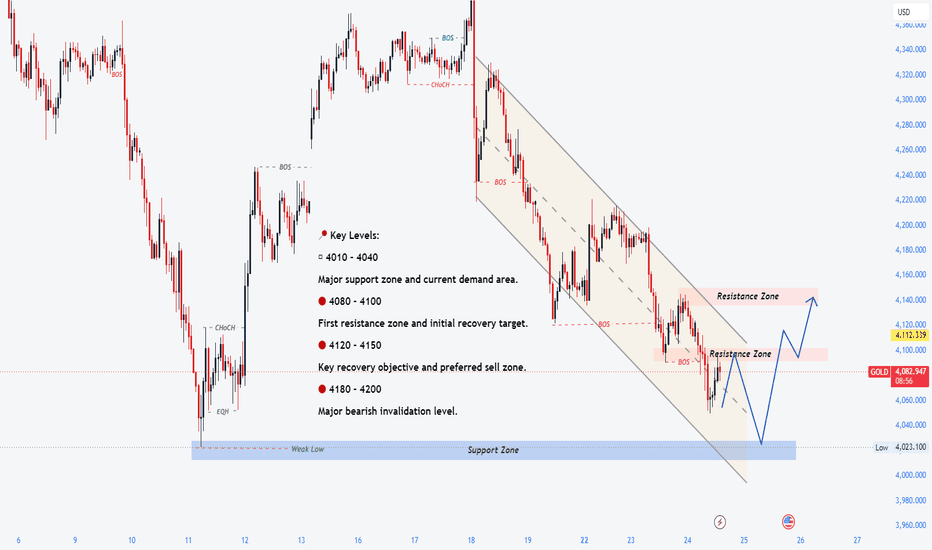
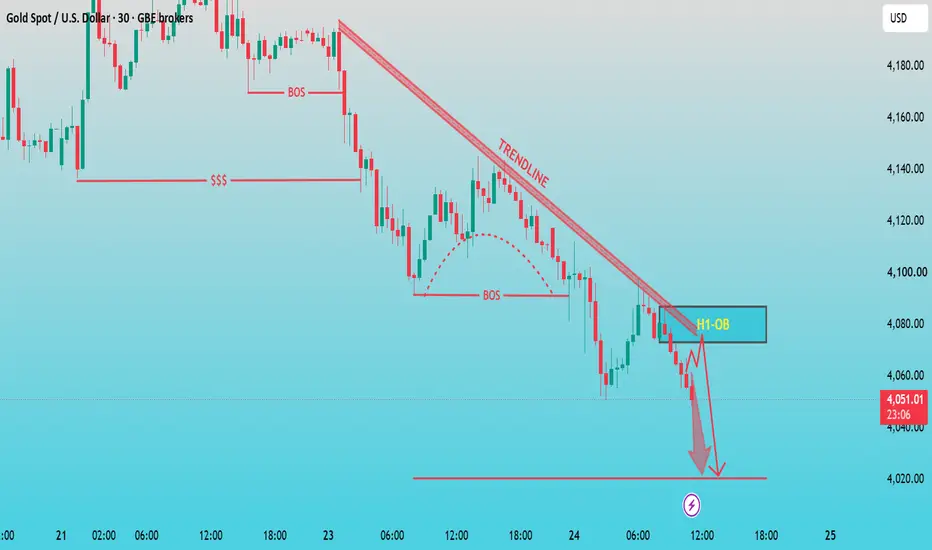
XAUUSD: Bearish CHOCH Confirms Supply Rejection – Target 4,060Market Overview
Gold (XAUUSD) has shifted its structure back to a bearish narrative on the 30-minute timeframe. After a period of corrective upward movement that established a short-term Market Structure Shift (MSS), price found strong rejection at the $4,200 Resistance level, forming a prominent Supply Zone between $4,155 and $4,190.
The recent aggressive sell-off has broken below the key demand pivot, confirming a CHOCH (Change of Character) to the downside.
Technical Breakdown
The Catalyst (CHOCH): The decisive break below the $4,140 level shifts our intraday bias heavily to the sell side. This invalidates the brief bullish structure and aligns the lower timeframes with the broader bearish momentum.
Supply Zone: A well-defined supply block sits right above current prices ($4,155 – $4,190). Any corrective pullbacks into this region will look highly attractive for short entries.
Price Action: Price is currently trading around $4,115. We anticipate a potential minor correction/retest of the broken structure or the lower boundary of the supply zone before the next major leg down.
Trading Plan
Bias: Bearish / Short on rallies
Entry Zone: Look for short setups on a retracement back into the Supply Zone ($4,155 - $4,185) or on a bearish continuation pattern following the CHOCH.
Invalidation / Stop Loss: A daily close above the $4,200 Resistance level invalidates this bearish setup.
Take Profit Target: $4,060 (Major liquidity pool / structural support level). Short 
#NIFTY Intraday Support and Resistance Levels - 24/06/2026Nifty is expected to open with a flat bias around the 23750–23800 zone after witnessing sharp profit booking in the previous session. The index has slipped towards a crucial support area, and today's price action around this zone will be important in determining whether buyers can regain control or sellers continue to dominate.
For today's session, 23750–23800 remains the immediate reversal buying zone. A sustained hold above this support area can trigger a recovery move towards 23850, 23900, and 23950+ levels. If Nifty manages to reclaim and sustain above 24050, fresh bullish momentum may emerge, pushing the index towards 24150, 24200, and 24250+ levels.
On the downside, 23950–23900 remains the key resistance-based selling zone for intraday traders. Any weakness below 23750 may attract fresh selling pressure towards 23650, 23600, and 23550 levels. A decisive breakdown below this support zone could accelerate bearish momentum and extend the corrective move.
Overall, the market structure has turned cautious after the recent decline, but the index is currently approaching a strong demand zone near 23750. Traders should closely monitor price action around this level, as a sustained hold may offer reversal buying opportunities, while a breakdown below 23750 could trigger further downside pressure. Strict stop-loss and disciplined risk management are advised amid increased volatility. XAUUSD: Wave 5 targets medium-term support.Gold is still moving inside the final bearish wave 5 structure after losing the short-term recovery channel. From Kelly’s view, the market remains under pressure, and the latest breakdown suggests sellers are still controlling the next directional move.
The key idea is simple: gold has broken support, and the cleaner sell continuation may come when price retests the broken zone.
⟡ Market structure
Price previously tried to recover inside a small rising channel, but that structure has now failed. Gold broke below the channel support and is trading back near the FVG area, showing that bullish momentum has weakened.
The broken support around 4,120–4,140 now becomes the main retest zone. If price returns to this area and sellers defend it, the wave 5 continuation scenario remains active.
The downside target remains the medium-term support zone near 4,031, where the chart marks the Elliott Wave end area.
➤ Key levels
◌ 4,120–4,140: broken support and sell retest zone
◌ 4,112: current reaction area
◌ 4,071: first downside support
◌ 4,031: medium-term support and Elliott Wave end zone
◌ Above 4,141: area where the immediate sell setup weakens
⌁ Elliott Wave view
From an Elliott Wave perspective, gold appears to be developing the final part of wave 5 after completing the earlier 1–2–3–4 sequence.
Wave 4 formed as a short recovery channel, but the break below that channel suggests wave 5 has started. If the wave count remains valid, price may continue moving lower towards the 4,071 area first, then 4,031 as the final medium-term support target.
A retest of 4,120–4,140 would fit well as a sell continuation structure before the final downside leg expands.
▸ Trading scenario
Preferred scenario: wait for price to retest the broken support zone and show bearish confirmation.
Sell retest zone: 4,120–4,140
Stop loss: above 4,141 or above the confirmed rejection high
Take profit 1: 4,071
Take profit 2: 4,031
Take profit 3: 4,000 if selling pressure expands
Alternative scenario: if gold breaks back above 4,141 and holds with strength, the immediate wave 5 sell setup loses quality and the chart may need a short-term reassessment.
⌁ Kelly’s view
For Kelly, this is a sell-the-retest structure. The market already broke the recovery channel, so the better plan is not to chase the low, but to wait for a clean reaction from the broken support area.
If sellers defend 4,120–4,140, wave 5 may continue towards the medium-term support zone.
Gold is still under downside pressure. The next important reaction may come from the retest before the final wave 5 target is reached.
Share your view below. Short 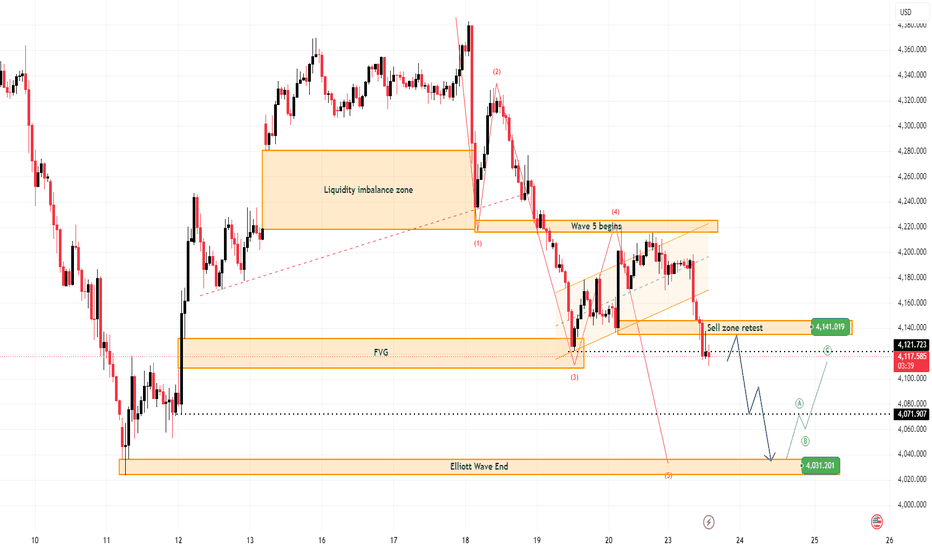
Gold below supply — liquidity sweep to 3,922?Market Overview
• Macro Driver: The US Dollar Index (DXY) consolidates firmly near its recent local highs as macro participants digest yesterday's cautious commentary from Fed Governor Christopher Waller. With the Fed's "higher-for-longer" monetary policy backed by structural inflation variables, Treasury yields remain anchored at elevated peaks. Furthermore, localized diplomatic progress regarding the Strait of Hormuz has triggered a sharp cooling of safe-haven premium arrays, forcing institutional capital to rotate out of Gold and accelerate immediate liquidation waves.
• Market Condition: Institutional order flow remains locked in a high-velocity markdown continuation phase. Large-scale smart money volume has cleanly breached short-term consolidation boundaries, converting old accumulation arrays into heavily protected supply ceilings.
Technical Context
• Structure: Acute Bearish Markdown Leg. The H1 timeframe indicates a flawless sequence of consecutive Break of Structure (BOS) market shifts. Price delivery is capped perfectly under dynamic descending supply, proving that sellers retain absolute algorithmic control and leaving zero room for weak retail buyers.
• Liquidity & Imbalance: The sharp post-FOMC descent has left multiple unmitigated Fair Value Gaps (FVGs) and premium supply blocks above. Currently, price is consolidating within a tight bearish flag, engineering minor buy-side liquidity (BSL) just to serve as fuel for a deeper structural flush into deep historical discount demand pools.
Key Zones
• Upper Premium Supply Ceiling (Major H1 FVG): 4,155.000
• Immediate Intermediate Supply (Broken Support / FVG Box): 4,070.000
• Current Market Pivot Handle: 4,028.163
• Near-Term Support / Sweep Target: 3,965.000
• Ultimate Macro Demand Floor (Major Target Box): 3,922.000
Trading Plan (IF–THEN)
• IF price delivers a minor corrective relief pop to mitigate the immediate intermediate supply near 4,070.000 AND validates lower-timeframe (M5/M15) bearish displacement -> THEN look to execute Short positions targeting the 3,965.000 sweep handle, expanding aggressively directly down to the Ultimate Macro Demand Floor at 3,922.000.
• IF price invalidates this dominant expansion vector by printing a strong, decisive H1 candle close completely above the 4,070.000 supply array -> THEN the immediate markdown momentum is temporarily paused, opening the door for an internal range consolidation.
MMFLOW View
• Bias: Heavily Bearish Continuation Bias. Chasing shorts at the absolute bottom of this current consolidation handle carries poor risk-to-reward metrics. Our mathematical edge heavily favors adopting a strict "Sell-the-rally" execution matrix, waiting for engineered liquidity pullbacks into internal supply arrays before riding the markdown leg down to the macro floor.
---
Are you looking to short the corrective relief pop toward the 4,070 FVG array, or do you expect the market to flush Gold straight to 3,922 without a breather? Drop your thoughts in the comments below! Remember to like, follow, and visit my profile to catch the real-time tracking of this setup. Forex Basics: 2. Understanding Orders and Market BehaviorBefore starting, make sure to check out Part 1, where we covered the basics of Forex, including currency pairs, pips, spreads, lot sizes, and leverage.
Part 1:Forex Basics Every Beginner Must Know!
1. Types of Orders?
-------------------
In Forex, an order is simply an instruction given to your broker to buy or sell a currency pair. Some orders are executed immediately, while others are executed only when the price reaches a specific level.
Orders are mainly divided into two categories:
Market Orders
Pending Orders
1. Market Order: A Market Order means buying or selling immediately at the current market price. As soon as you place the order, your trade is executed instantly. Market orders are used when you want to enter the market right away.
A. Buy Market Order: When you place a Buy Market Order, you expect the price to rise.
B. Sell Market Order: When you place a Sell Market Order, you expect the price to fall.
2. Pending Orders: Sometimes traders do not want to enter the market immediately. Instead, they want the trade to open automatically when the price reaches a certain level. These orders are called Pending Orders.
There are four types of pending orders:
Buy Limit
Sell Limit
Buy Stop
Sell Stop
1. Buy Limit Order
———————
A Buy Limit Order is placed below the current market price. It is used when you expect the price to fall first and then move upward.
Example
Suppose EUR/USD is currently trading at 1.1000.
You believe the price may drop to 1.0950 and then continue rising.
Instead of buying immediately, you place a Buy Limit Order at 1.0950.
If the price falls to 1.0950, the trade opens automatically.
If the market then rises to 1.1050, you make a profit.
In simple words:
Current Price = 1.1000
Buy Limit = 1.0950
Expectation:
Price goes down first and then moves up.
2. Sell Limit Order
————————
A Sell Limit Order is placed above the current market price. It is used when you expect the price to rise first and then move downward.
Example
Suppose EUR/USD is trading at 1.1000.
You believe the price may rise to 1.1050 before falling.
Instead of selling immediately, you place a Sell Limit Order at 1.1050.
If the price reaches 1.1050, the trade opens automatically.
If the market then falls to 1.1000, you make a profit.
In simple words:
Current Price = 1.1000
Sell Limit = 1.1050
Expectation:
Price goes up first, then down.
3. Buy Stop Order
————————
A Buy Stop Order is placed above the current market price.
It is used when you expect the price to continue rising after breaking a certain level.
Example:
Suppose EUR/USD is trading at 1.1000.
You believe that if the price breaks above 1.1050, it will continue moving upward.
You place a Buy Stop Order at 1.1050.
If the price reaches 1.1050, your trade opens automatically.
If the market later rises to 1.1100, you make a profit.
In simple words:
Current Price = 1.1000
Buy Stop = 1.1050
Expectation:
Price goes up and continues moving higher.
4. Sell Stop Order:
————————
A Sell Stop Order is placed below the current market price.
It is used when you expect the price to continue falling after breaking a certain level.
Example:
Suppose EUR/USD is trading at 1.1000.
You believe that if the price breaks below 1.0950, it will continue moving downward.
You place a Sell Stop Order at 1.0950.
If the price reaches 1.0950, your trade opens automatically.
If the market later falls to 1.0900, you make a profit.
In simple words:
Current Price = 1.1000
Sell Stop = 1.0950
Expectation:
Price goes down and continues moving lower.
Note:
A. Limit Orders expect a reversal.
B. Stop Orders expect a breakout.
2. Bid Price and Ask Price?
------------------------
When you look at a Forex pair, you will always see two prices.
Bid Price → The price at which you can sell.
Ask Price → The price at which you can buy.
The difference between these two prices is called the Spread.
Example:
Bid Price = 1.1000
Ask Price = 1.1002
Spread = 2 pips
This means every trade starts with a small cost, which is the spread.
3. Trading Sessions:
-------------------
The Forex market operates 24 hours a day because different countries open and close at different times.
There are four major trading sessions:
Sydney Session
Tokyo Session
London Session
New York Session
However, each session behaves differently. Some sessions are calm, while others are highly volatile.
Understanding these sessions helps traders know when the market is likely to move the most.
1. Sydney Session:
The Sydney Session is the first session to open after the weekend.
Generally, this session is quiet and has lower volatility because fewer traders are active.
Price movements are usually smaller compared to other sessions.
Because of this, many traders use this time to observe the market rather than look for large moves.
2. Tokyo Session (Asian Session)
The Tokyo Session is also known as the Asian Session.
Compared to the Sydney Session, trading activity increases, but volatility is still relatively low.
Currency pairs involving the Japanese Yen (JPY), Australian Dollar (AUD), and New Zealand Dollar (NZD) are usually more active during this period.
Example: USD/JPY, EUR/JPY, AUD/USD, NZD/USD
During this session, prices often move within a range and trends are generally slower.
3. London Session
The London Session is considered one of the most important sessions in Forex.
This session has very high trading volume because many banks, institutions, and traders participate in the market.
As a result, price movements become larger and volatility increases.
Many strong trends begin during the London Session.
Currency pairs such as:
EUR/USD, GBP/USD, EUR/GBP, USD/CHF
often experience significant movement during this period.
Because of the high volatility, this session is preferred by many day traders and scalpers.
4. New York Session
The New York Session is another highly active session. Major economic news releases from the United States are often announced during this time. As a result, volatility can increase rapidly.
Currency pairs containing the US Dollar usually experience strong price movements.
Examples: EUR/USD, GBP/USD, USD/CAD, USD/JPY
The first half of the New York Session is generally more active than the second half.
As the session approaches closing time, market activity gradually decreases.
Important Topic: London and New York Overlap
When the London Session and New York Session are open at the same time, trading activity reaches its peak.
This period is considered one of the busiest times in the Forex market.
During this overlap:
Trading volume is highest.
Volatility increases.
Spreads are usually lower.
Strong price movements are common.
Because of these reasons, many traders prefer trading during this period.
Session Comparison:
4. Margin Call
-----------------
A Margin Call happens when the funds available in your trading account become too low to support your open positions. In simple words, it is a warning from your broker that your losses are increasing and your account does not have enough money to maintain the trades. This usually happens when the market moves against your position and your account equity falls below a certain level required by the broker.
If losses continue to increase, the broker may automatically close some or all of your open trades to prevent your account balance from going negative. This process is known as a Stop Out.
For example, suppose you have $100 in your account and open a large position using leverage. If the market moves against you and your losses become too large, your available margin will decrease. Once it reaches the broker's minimum requirement, a Margin Call occurs, and if the losses continue, the broker may close your trades automatically to protect both you and the broker from further losses.
5. Stop Loss and Take Profit
---------------------------------
Whenever traders open a trade, they can set two important price levels:
1. Stop Loss (SL)
2. Take Profit (TP)
These levels help traders manage risk and profits automatically.
1. Stop Loss:
A Stop Loss is a price level where your trade automatically closes to limit your losses.
In simple words, it acts as a safety net that prevents small losses from becoming very large losses.
Example:
Suppose you buy EUR/USD at 1.1000.
You set your Stop Loss at 1.0950.
If the market falls to 1.0950, your trade will close automatically.
Loss = 50 pips.
2. Take Profit:
A Take Profit is a price level where your trade automatically closes after reaching your desired profit.
Example:
Suppose you buy EUR/USD at 1.1000.
You set your Take Profit at 1.1100.
If the price rises to 1.1100, your trade closes automatically.
Profit = 100 pips.
In simple words:
Stop Loss protects your capital.
Take Profit locks in your profits.
6. Profit and Loss Calculation
----------------------------------
Profit and loss in Forex mainly depend on three things:
Lot size.
Number of pips moved.
Direction of your trade.
Example:
Suppose you buy EUR/USD.
Lot Size = 0.10 lot.
Price moves from 1.1000 to 1.1020.
Difference = 20 pips.
Profit = $20.
Similarly, if the market moves down by 20 pips,
Loss = $20.
The larger the lot size, the larger the profit and loss.
7. Why Beginners Should Use a Demo Account
--------------------------------------------------
Before risking real money, many traders start with a Demo Account.
A Demo Account allows you to trade using virtual money while experiencing real market conditions.
This helps beginners understand:
How to place orders.
How leverage works.
How profits and losses change.
How to manage risk.
Because no real money is involved, traders can learn without fear of losing capital. However, emotions are different when trading with real money. Therefore, many traders move from a Demo Account to a Live Account only after gaining enough experience.
Holy Grail Note: Learning Forex is not only about making profits. Understanding risk management and protecting your capital is equally important. Many beginners focus only on profits, but experienced traders focus first on controlling losses.
In Part 3, we will move from how trades work to how traders analyze the market using candlesticks, timeframes, trends, support and resistance, and basic market structure.
On @TradingView By @BrightRally_Research Nifty Bank Analysis [For 24.06.2026: Wednesday]Probable Scenario Analysis of Nifty Bank for the 24th of June, 2026. The day is Wednesday.
🟢 Bullish Scenario
There is no observable bullish scenario. Doubt every up move. Think of a bullish trade only if the price trades and sustains above the level of 58000. The probable bullish targets above the level of 58000 would be - 58250 and 58500.
🔴 Bearish Scenario
Presently, the price is in a bearish zone. If the price stays below the level of 57500, then stay bearish only. Doubt every up move. The probable bearish targets below the level of 57500 would be - 57250, 57000, and 56750. The price would fill an unfilled gap (at 56800 approx.) and take support at 56750. Next, if the price decisively trades below the level of 56750, then the probable bearish target would be 56500. The price would receive good support at the level of 56500.
🟡 No Trading Zone (NTZ): (58000 - 57500)
⏺ Range of Consolidation (ROC): (57500 - 56500).
Here, the level of 57000 is the median of the ROC. The median works like a sentiment. The price trading above the median would offer bullish sentiment, while the price trading below the median would trigger bearish sentiment.
🟧 Technical Pattern: Double Top Pattern as a Trend Reversal Pattern
It is observed that the price has formed a double top at the level of 58000. Here, the level of 57500 is the neckline of the double top pattern. The neckline is decisively broken. Presently, there is no sign of bullishness. Doubt every up move. Look for bearish trades only.
● Event
There are no high-impact events on Wednesday. On Thursday, there will be SENSEX monthly expiry. Thus, Thursday will be a very critical day. Lastly, Friday is a national holiday (Muharram). We have only two trading days left.
● Intraday Bias
Establish intraday bias with respect to the opening price. If the price sustains above the opening price, then don't think of shorting. Look for bullish trades only. On the contrary, if the price sustains below the opening price, then don't think of going long. Look for bearish trades in that case.
● Top-Down Analysis:
- Monthly TF: A green spinning top candle is formed. The level of 58000 is a major resistance level. The level of 57000 is a weak support. Lastly, the level of 56500 is a major support. The view is bullish to indecision.
- Weekly TF: A red marubozu is formed that has engulfed the movement of the previous doji candle. It looks like a sign of reversal. Strong resistance at 58000. Weak support at 57000. The level of 56750 seems to be achievable due to the availability of a GAP. Strong support is at 56500. The view is bullish, with signs of trend reversal.
- Daily TF: A big red marubozu. Doubt every up move. Weak support at 57000. Major support at 56500. There is a high chance of GAP filling till the level of 56750.
- 30-minute TF: The previous structure of higher-highs and lower-lows is exhausted. There is a clear sign of trend reversal (bullish to bearish). The view is bearish.
● Disclaimer + End Note
- All the analyses would fail in the case of a major gap up, gap down, or price structure anomaly. Thus, practice PRAGMATISM in the live session.
- Trade only if there is a set-up. Remember, not trading is an extension of the trading activity.
- Mark your points. Trade your points. Price is GOD. Anything can happen in the markets. Thus, trade what you see, not what you believe.
- Always PRACTICE RISK MANAGEMENT. Always PROTECT YOUR CAPITAL. Be RESPONSIBLE.
- Be Strategic. Be Courageous. Be Patient. Be Wise.
- Every day is a new day. Thus, do not carry the baggage of past successes or failures. Leave the gardens of winning and losing. Establish yourself in equanimity. Always think from a new perspective.
- Let the joy of trading drive your effectiveness, not greed or fear. Believe in Possibilities.
Happy Trading! BSE: Formation of The H&S Pattern [Clear Sign of Weakness]Probable Scenario Analysis of BSE.
🟢 Bullish Scenario
There is no sign of bullishness. Doubt every up move. There is strong resistance in the zone (4100 - 4000). However, in case the price sustains above the level of 4100, then there might be a weak (or underconfident) bullish move till 4200. But this move should be doubted and played with caution. Next, if the price decisively trades above the level of 4200, then the target is 4300. However, these probable bullish scenarios seem unachievable.
🔴 Bearish Scenario
The price is presently in a bearish structure. The level of 4000 is a crucial point. If the price stays below the level of 4000, then try to identify only bearish trades. Doubt every up move. Firstly, the level of 3900 is easily reachable as there is an unfilled gap. Next, if the price decisively breaks down below the level of 3900, then the probable bearish targets would be - 3800, 3700, and 3600.
🟡 No Trading Zone (NTZ): (4200 - 4000).
In case the price starts to trade in this region, it is recommended not to trade.
🟧 Hypothesis: Evidence of Potential Head-&-Shoulder (H&S) Pattern Formation
If we observe the price action since May 2026 until now, we can observe that BSE has been forming a head-&-shoulder (H&S) pattern. It is a clear sign of weakness. The level of 3900 is a critical level, as it seems to be the NECKLINE of the H&S pattern. If the price decisively trades below the level of 3900, then we can expect at least a 400-point fall (as per the technical analysis study of the H&S pattern).
🔵 Availability of Multiple Unfilled GAPs
If the H&S pattern hypothesis is confirmed, there is a high chance that price will go lower to fill the available gaps. It can be observed that there are multiple unfilled gaps at the levels - 3738 and 3633.
● Insight:
Doubt every up move. Look for bearish trades only. Beware of dead cat bounce.
● Top-Down Analysis:
- Monthly TF: A red hanging man formed at the top of the trend. Major resistance is 4200. Weak support is at 3800. The view is indecision to a sign of trend reversal.
- Weekly TF: It looks like BSE is forming a pole and flag pattern since the last week of May 2026. There is a sign of trend exhaustion. Major resistance is 4200. Weak support is at 3800. If the level of 3800 is broken, then the price might test the lower level of 3640 (an unfilled gap). The view is indecision to a sign of trend exhaustion.
- Daily TF: BSE has formed a lower-lows and lower-highs structure since the last week of May 2026. Bullish strength would only be seen if the price breaks out above the level of 4200 and sustains. The level of 3800 is the final support. If the level of 3800 is broken, then the price might test the lower level of 3640 (an unfilled gap). The view is indecision to a sign of trend exhaustion.
- 30-minute TF: Multiple H&S patterns can be observed. There is no sign of strength; rather, there are clear signs of trend exhaustion. Bullish strength would only be seen if the price breaks out above the level of 4200 and sustains. The level of 3800 is the final support. If the level of 3800 is broken, then the price might test the lower level of 3640 (an unfilled gap). The view is indecision to a sign of trend exhaustion.
Disclaimer:
(i) The post is purely based on technical and chart analysis. The author has not studied the fundamentals. Thus, any fundamental or macroeconomic event can disrupt chart analysis.
(ii) The author has no intention to promote buy or sell recommendations.
(iii) The post is only for educational purposes.
(iv) The intent of the post surrounds trading levels only and not investment ideas.
(v) Novice traders should stick to the cash segment for swing trading instead of F&O. This post has no intention to promote F&O trading.
(vi) Please be mindful during trading and investment decisions. Be Responsible.
Happy Trading!  Short
Short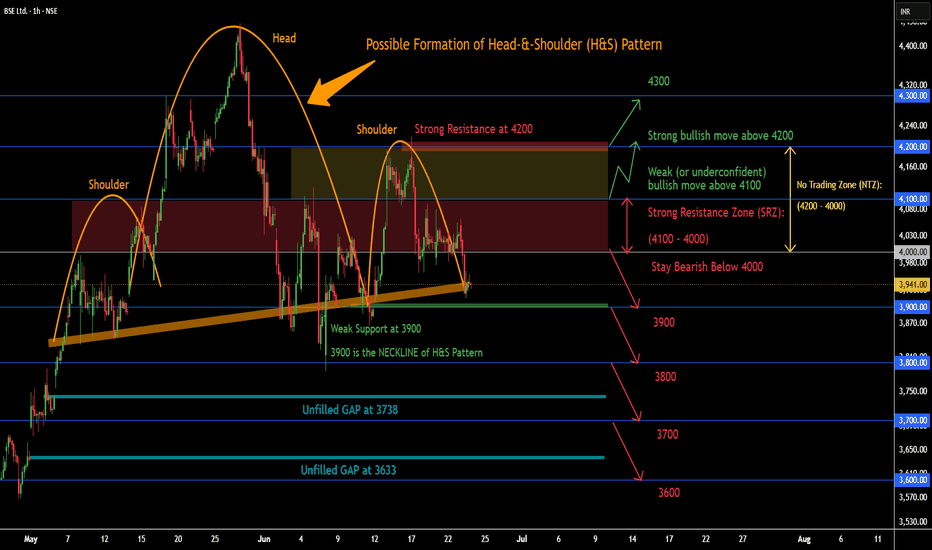
Understanding Buyer and Seller Psychology Behind Every candleMost traders begin their journey by learning candlestick patterns, indicators, and trading strategies. They memorize names like Hammer, Engulfing, Doji, and Morning Star, hoping these patterns will reveal the market's next move. But after spending enough time in the market, one question becomes far more important:
Why does price move at all?
The answer is surprisingly simple. Price moves because buyers and sellers constantly disagree on value. Every candle on the chart is the result of this ongoing battle. Behind every green candle, there are buyers willing to pay a higher price. Behind every red candle, there are sellers who believe the price should be lower.
Once you start seeing candles as stories of human behavior rather than just shapes on a chart, the market begins to make much more sense.
Every Candle Tells a Story:
A candlestick is not just an open, high, low, and close. It is a visual representation of emotions.
Imagine a strong bullish candle. Buyers entered with confidence and kept pushing the price higher. Sellers tried to resist, but demand was stronger. The result is a large green candle that shows optimism and strength.
Now think about a long bearish candle. Fear enters the market. Traders rush to exit their positions, sellers become aggressive, and buyers hesitate. The market falls quickly because emotions change faster than most people expect.
This is why experienced traders do not simply look at candles. They ask:
Who is in control?
Are buyers confident?
Are sellers becoming weaker?
Is this move driven by fear or greed?
The answers to these questions often matter more than the pattern itself.
The Real Engine of Price: Supply and Demand
At its core, the market is simply an auction.
When more people want to buy than sell, prices rise.
When more people want to sell than buy, prices fall.
This principle applies everywhere—stocks, forex, cryptocurrencies, commodities, and indices. No indicator can override supply and demand.
Many traders search for complicated formulas, but the market often moves for very simple reasons. Buyers become more aggressive, sellers become more aggressive, or one side temporarily gives up.
Understanding this concept helps traders focus on what actually drives the market instead of chasing every signal they see.
Fear and Greed Move Markets Faster Than Logic:
Markets are made of people, and people are emotional.
When prices rise quickly, greed takes over. Traders fear missing out and start buying simply because others are buying. This creates momentum and pushes prices even higher.
On the other hand, when prices fall sharply, fear spreads. Traders rush to protect their capital, and selling becomes emotional rather than rational.
This is why markets often move farther than people expect.
A strong trend is not only a technical event. It is a reflection of collective emotions.
Understanding this psychology can help traders stay calm when others become emotional.
Why Some Candles Have Long Wicks
One of the most interesting parts of a chart is the wick.
A long lower wick often means sellers pushed the price down, but buyers rejected those lower prices and regained control.
A long upper wick tells the opposite story. Buyers tried to move higher, but sellers stepped in aggressively and forced the price back down.
These rejections are important because they reveal where the market accepts or rejects price.
In many cases, wicks provide a deeper understanding of market sentiment than the candle body itself.
Liquidity and the Bigger Players
Many traders wonder why price sometimes breaks a level, triggers stop losses, and then suddenly reverses.
The reason often lies in liquidity.
Large institutions cannot enter huge positions instantly. They need enough buyers and sellers on the other side of their trades.
Because of this, price is naturally attracted to areas where many orders exist:
Previous highs
Previous lows
Equal highs and lows
Major support and resistance levels
Psychological price levels
What appears to be a fake breakout is sometimes the market searching for liquidity before making its real move.
Stop Memorizing Patterns. Start Understanding Behavior.
Candlestick patterns are useful.
But understanding the emotions behind those patterns is far more powerful.
A Hammer is not just a Hammer.
It represents rejection.
An Engulfing candle is not simply a shape.
It represents a shift in control between buyers and sellers.
Every candle is evidence of what market participants are thinking and feeling.
And that is where true price action begins.
Final words:
Price does not move randomly.
Behind every candle are thousands of decisions made by traders reacting to fear, greed, confidence, uncertainty, hope, and panic.
When you stop focusing only on patterns and begin understanding the psychology behind them, charts become easier to read.
You stop seeing candles as shapes.
You start seeing emotions.
You start seeing battles.
And most importantly, you start understanding "why price moves before trying to predict where it will go next."
 Education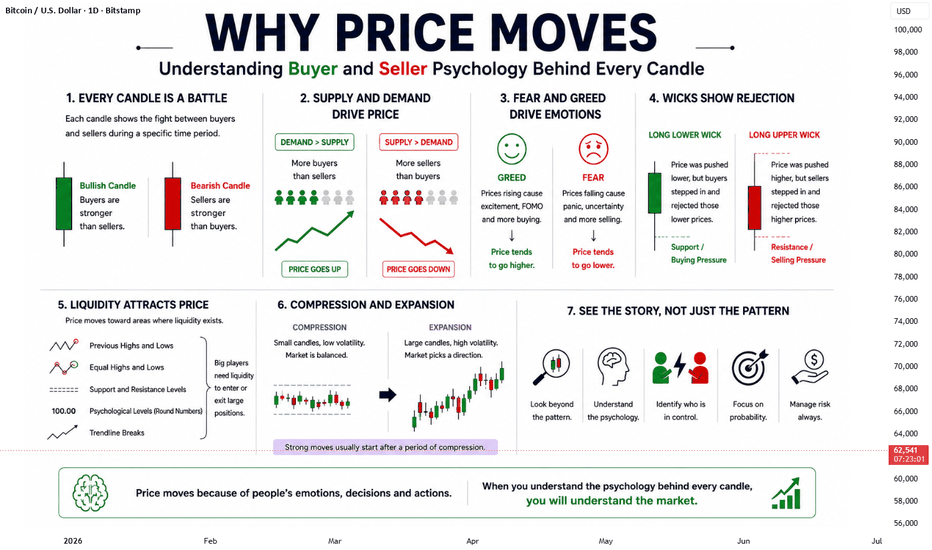
XAUUSD: Fed Hawks & War De-escalation Trigger 4HR Structure🧵 The Macro Shift: Connecting Yesterday's Relief to Today's Trend
In yesterday’s analysis, we mapped out a brief bullish relief rally for XAUUSD, which was heavily supported by a sharp plunge in crude oil prices. As energy costs temporarily fell, immediate market pressure eased, allowing gold to catch a minor bid and retest premium structural zones.
Today, however, the dynamic has completely flipped, and the primary bearish trend has resumed. Crude oil has stabilized, while two powerful fundamental catalysts have stepped in to drive institutional order flow:
Hawkish Fed & Rising Opportunity Cost (Gold Bias: Bearish)
Rumors of a potential interest rate hike by December have heavily repriced market expectations. Because gold pays no yield, the threat of "higher-for-longer" rates makes holding cash or buying the surging US Dollar much more attractive to big funds.
Geopolitical Premium Unwinding (Gold Bias: Bearish)
During periods of sudden global tension, institutions rush to buy gold as a "safe haven" because it has no counterparty risk, creating an artificially high price inflation known as a risk premium. Now, with reports of an unexpected 60-day preliminary ceasefire framework between the US and Iran, that immediate fear is leaving the market. When fear drops, institutional investors immediately pull their capital out of protective defensive assets like gold and reallocate those billions back into riskier, high-yielding assets. As this defensive demand completely dries up, it leaves a massive vacuum of buyers, causing XAUUSD to fall rapidly.
📉 Technical Convergence & Strategy
Liquidity Sweeps & Distribution (Gold Bias: Bearish)
This macro shift aligns perfectly with the 4-hour market structure. Yesterday's relief rally did exactly what it was supposed to do: it trapped early buyers and pulled price right into premium supply imbalances. With the buy-side liquidity officially swept at the recent structural highs, the path of least resistance remains heavily downward.
The Demand Zone Block ($4,054–$4,095) (Gold Bias: Short-Term Next/Bullish Bounce)
As price expands downward, the massive 4-hour POI demand zone sitting between $4,054 and $4,095 will act as key short-term structural support. Because major institutional buy orders rest here, expect a temporary demand reaction and a short-term bounce back from this block.
The Ultimate Target ($4,024) (Gold Bias: Medium-Term Bearish)
While the $4,054–$4,095 POI offers a temporary pit-stop, any short-term bounce is viewed purely as a lower-high sub-structure mitigation. The primary objective for this bearish expansion remains the major sell-side liquidity resting at the $4,024 swing low. We expect price to ultimately sweep this level once short-term demand is exhausted.
⚠️ Absolute Risk Warning
Disclaimer: This analysis is for educational purposes only and does not constitute financial advice. Geopolitical milestones and central bank decisions carry extreme financial risk. Protect your capital, monitor structural closes on the higher timeframes, and manage your risk defensively. XAUUSD — Medium-Term Buy Zone, Waiting For Liquidity Sweep
Gold is trading around $4,118 after rejecting from the short-term OB sell entry zone near $4,185–$4,198. Price has pulled back sharply, but the bigger focus is now shifting to the lower liquidity area.
From an SMC perspective, gold is moving toward a major demand zone where sell-side liquidity and the OB buy zone are sitting together. This area around $4,052–$4,085 is important because it was the origin of the previous bullish reaction and also sits above the strong low near $4,022.
The main plan is not to chase the current move. I prefer to wait for gold to sweep liquidity below $4,052, tap the OB buy zone, then look for bullish confirmation. If buyers defend this zone, gold can build a medium-term recovery back toward $4,198, $4,222, and higher FVG liquidity.
Buy setup 1
Condition:
Gold sweeps sell-side liquidity near $4,052 and reacts from the OB buy zone with bullish MSS / CHOCH confirmation.
Entry: $4,052–$4,085
SL: below $4,020
TP1: $4,118
TP2: $4,198
TP3: $4,222
Buy setup 2
Condition:
If gold holds the OB buy zone and breaks back above $4,198, wait for a retest before looking for continuation.
Entry: $4,185–$4,198 after breakout retest
SL: below $4,150
TP1: $4,222
TP2: $4,260
TP3: $4,285–$4,300
Sell setup
Condition:
Selling is not the priority. A sell setup is only valid if gold rejects again from $4,185–$4,198 and fails to reclaim the buy-side liquidity area.
Entry: $4,185–$4,198 after rejection
SL: above $4,222
TP1: $4,118
TP2: $4,085
TP3: $4,052
Key levels
Current price area: $4,118
OB buy zone: $4,052–$4,085
Strong low: $4,022
OB sell entry: $4,185–$4,198
Week high: $4,222
Upper FVG target: $4,260–$4,300
Bullish invalidation: clean 2H close below $4,020
My current view is that gold may create a stronger medium-term buy opportunity if price returns into the major OB and liquidity zone. The best Prime Gold plan is to wait for liquidity to be taken first, then enter only after bullish structure confirms.
No confirmation, no trade.
Long 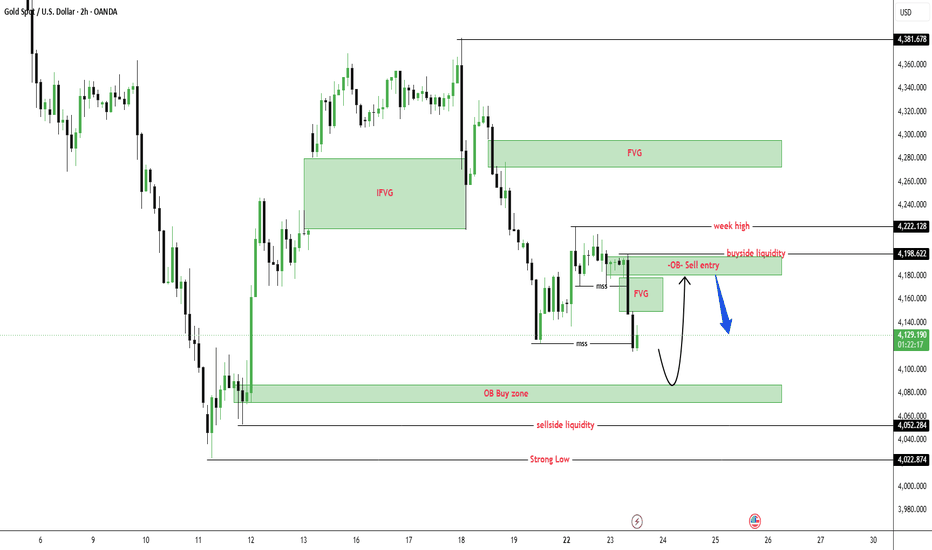
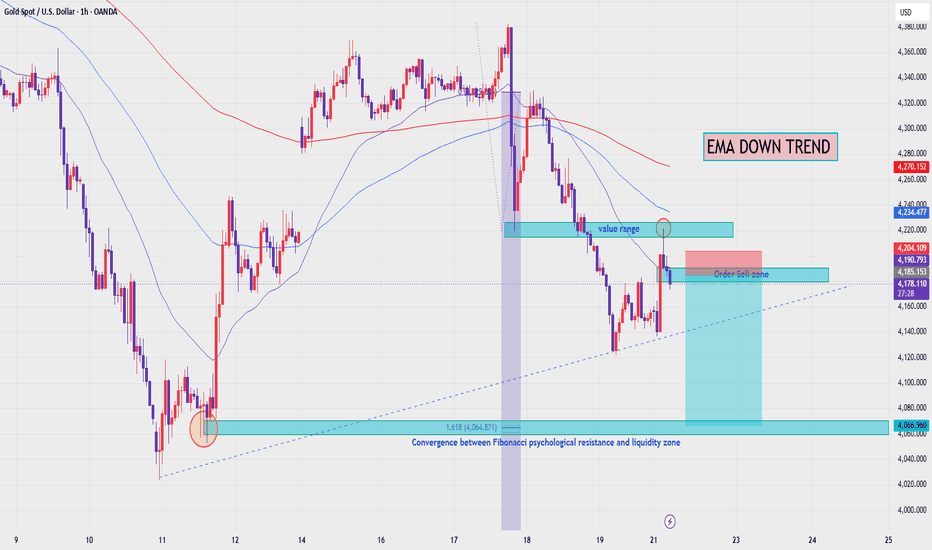
XAUUSD — EMA Downtrend Holds, Sell Position Remains Active
Fundamental Analysis
Gold remains under pressure as price continues to trade below the main EMA structure. Traders are still watching USD strength, Treasury yields, and upcoming U.S. macro data.
For now, the technical structure still favours sellers while recovery attempts are rejected from the value sell zone.
Technical Analysis
On the 1H chart, XAUUSD is trading below EMA 34, EMA 89, and EMA 200. The EMA structure is still pointing lower, showing that the short-term trend remains bearish.
Price recently tested the value range around 4,210 - 4,225 but failed to break higher. This rejection shows that buyers are still weak, while sellers continue to defend the EMA downtrend.
The order sell zone around 4,185 - 4,204 has also reacted well. After touching this area, price rejected and moved lower again, confirming that the sell zone is still valid.
As long as gold stays below 4,204 - 4,225, the bearish continuation setup remains active. The main downside target is the Fibonacci and liquidity convergence zone around 4,066.
Important Key Levels
Current price area: 4,177
Order sell zone: 4,185 - 4,204
Value range resistance: 4,210 - 4,225
EMA resistance area: 4,234 - 4,270
Short-term support: 4,140 - 4,120
Fibonacci liquidity target: 4,066 - 4,064
Invalidation area: above 4,225
Trading Scenario
Main Sell Scenario
Entry: 4,185 - 4,204
Stop Loss: 4,225
Take Profit 1: 4,140
Take Profit 2: 4,100
Take Profit 3: 4,066 - 4,064
Sell Condition
The preferred setup is to continue focusing on sell positions while price stays below the value range and EMA resistance.
The sell zone has already reacted well, showing rejection from 4,185 - 4,204. If price retests this area and forms another bearish rejection, the sell continuation setup remains valid.
A break below 4,140 would strengthen bearish momentum and open the way toward 4,100, then the Fibonacci liquidity target around 4,066 - 4,064.
Entry Conditions
Wait for price to stay below 4,204.
Look for bearish rejection on any retest.
A break below 4,140 confirms stronger downside pressure.
If price breaks and holds above 4,225, the sell setup is invalid.
Overall, the main view remains bearish while XAUUSD trades below EMA 34, EMA 89, EMA 200, and the value range resistance. The sell zone has already rejected price, so the preferred plan is to continue focusing on bearish continuation toward 4,140, 4,100, and 4,066.
Do you share the same bearish view on gold, or are you waiting for another retest of the order sell zone?
Short