 Long
Long

XAUUSD — Bearish Trend, Waiting for the PullbackMarket Pulse
Gold remains under pressure ahead of the Fed decision.
Higher Treasury yields, a firmer U.S. dollar and strong rate-hike expectations continue to limit the upside. High oil prices are also keeping inflation concerns alive, so volatility may stay elevated.
What the Chart Says
XAUUSD remains bearish on H1.
Price continues to form lower highs and lower lows, while the latest breakdown has pushed Gold back toward the lower support structure around 4,255–4,265.
The current price near 4,283 is already close to support, so I would not chase fresh shorts here.
A corrective rebound could first reach 4,307–4,318, which is the nearest broken structure and first resistance.
If price recovers further, the more important area sits around 4,345–4,357. This is the main rejection zone on the chart and a cleaner place to watch for sellers to return.
If that area holds, another bearish wave could develop toward 4,255–4,265, followed by the deeper 4,225–4,240 demand zone.
Levels That Matter
4,425–4,435 — Major upper resistance
4,345–4,357 — Main rejection area
4,307–4,318 — First resistance
4,255–4,265 — Support zone
4,225–4,240 — Main demand zone
My Main Plan
The main plan remains bearish.
I prefer waiting for price to recover toward 4,307–4,318 first.
If the rebound becomes stronger, 4,345–4,357 is the better sell area to watch.
A clear bearish reaction from resistance could bring Gold back toward 4,255–4,265 and later the deeper demand zone.
What I Need to See
I want the rebound to form another lower high and fail below the marked resistance areas.
A sustained H1 move above 4,357 would weaken the immediate bearish setup. A stronger recovery above the major upper resistance would suggest a larger structure change.
Final Read
The H1 trend still favors sellers, but price is already near support.
For now, I prefer waiting for the pullback and selling from resistance rather than chasing the move lower, especially with the Fed decision likely to create sharp two-way volatility  Short
Short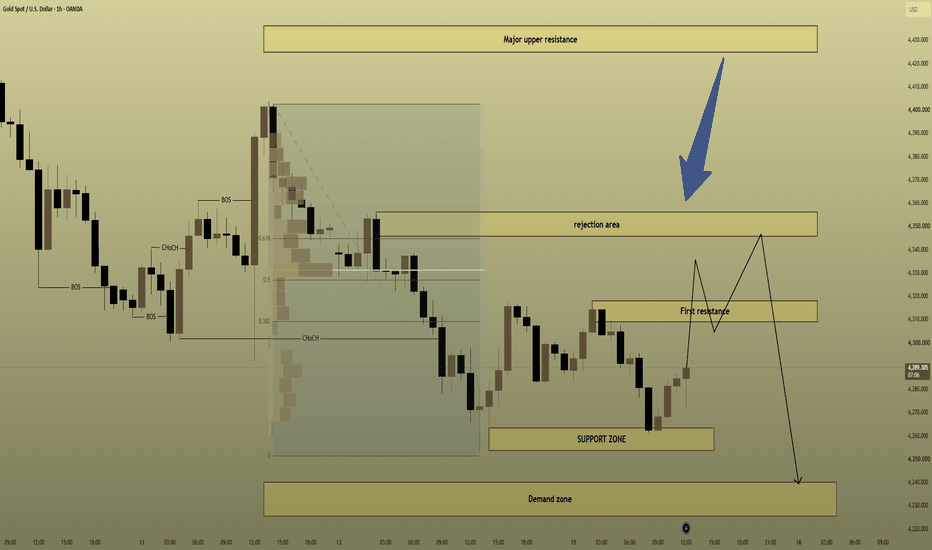
XAUUSD — Sell the H1 Fibonacci RetestFundamental Analysis
Gold remains under pressure ahead of the September 15–16 Fed meeting. Markets are pricing roughly a 92% probability of a 25 bp rate hike, while a firmer U.S. dollar and rising Treasury yields continue to raise the opportunity cost of holding gold.
The macro backdrop is also being complicated by oil prices above $100 and renewed Middle East supply concerns. U.S. Treasury yields have pushed to fresh multi-year highs, with the 10-year recently moving above 5%, reinforcing the higher-for-longer pressure on precious metals.
Technical Analysis
On the H1 chart, XAUUSD is trading near 4,277 after rebounding from the 4,253.64 low but failing to establish a sustained bullish structure.
Price remains below the broader bearish structure, while the latest Fibonacci retracement identifies 4,293–4,305 as the most attractive short-term sell area. This zone combines the 0.618–0.786 retracement, previous structure, and nearby H1 imbalance.
A deeper recovery could test 4,318, but acceptance above that level would weaken the immediate bearish setup.
If sellers defend the Fibonacci zone, price may rotate back toward 4,278, followed by 4,268–4,270 and eventually the 4,253–4,255 liquidity low.
Important Key Levels
4,378–4,390 — Major H1 FVG
4,305–4,318 — Upper resistance
4,293–4,305 — Main sell zone
4,278 — First downside pivot
4,268–4,270 — Lower demand
4,253–4,255 — Main liquidity target
Trading Scenario
Main Sell Setup
Entry: 4,293–4,305
Stop Loss: 4,322
Take Profit 1: 4,278
Take Profit 2: 4,268–4,270
Take Profit 3: 4,253–4,255
Sell Condition
Wait for price to retrace into 4,293–4,305 and show bearish confirmation. A rejection wick, bearish engulfing candle, failed reclaim above 4,305, or H1 close back below 4,293 may confirm renewed seller pressure.
A sustained break above 4,318–4,322 would invalidate the immediate sell idea.
Overall View
The H1 bias remains bearish while XAUUSD trades below 4,318. With price already near lower support, chasing shorts around 4,277 offers poor positioning. The preferred plan is to wait for a corrective rebound into 4,293–4,305, then look for confirmation toward 4,278, 4,268, and potentially a retest of the 4,253 liquidity low.
The Fed decision is now the main volatility risk, and the tone of the policy statement may be as important as the expected rate hike itself.
Do you expect gold to retest 4,293–4,305 before sellers attack 4,253 again? Short 
 Education

 Education

 Education

Education

Global Financial MarketsGlobal financial markets are systems where people, companies, and governments buy and sell financial assets across the world. They help move money from those who have extra funds to those who need funds.
Main Types of Global Financial Markets:
Stock Markets – Buying and selling shares of companies (e.g., NYSE, NSE).
Bond Markets – Governments and companies borrow money by issuing bonds.
Foreign Exchange (Forex) Markets – Trading currencies like USD, EUR, INR.
Commodity Markets – Trading gold, oil, wheat, etc.
Money Markets – Short-term borrowing and lending.
Derivatives Markets – Contracts based on assets like stocks or currencies.
Importance:
Provide funds for business growth
Support international trade
Create investment opportunities
Help manage financial risks
Affect global economies
Example:
If the US stock market falls sharply, markets in Asia and Europe may also be affected because markets are connected globally.
 Education

 Education

Trading Masterclass #1Institutional trading means trading like hedge funds, banks, prop firms, and professional desks. They do not trade based on emotions, random tips, or gambling. They use systems, probabilities, risk control, position sizing, discipline, and psychology.
Retail traders often lose because they focus only on “entry.” Institutions focus on:
Risk Management
Capital Protection
Position Sizing
Probability
Psychology
Consistency
Repeatable Edge
In options trading, if you think like institutions, your results can improve significantly Education

Not All Gaps Are Created Equal. Some You Buy, Some You FadeNot All Price Gaps Are Created Equal. Some You Buy, Some You Fade, Some You Simply Ignore.
The strategies 'Gap and go' and 'Gap fill' are opposite each other. One of the fastest ways of blowing your portfolio of money on gap day is to trade the wrong strategy at wrong time.
A gap occurs when the stock price opens up appreciably above or below the close of the preceding day, often due to overnight news or earnings or a general cue from overseas. A gap is not necessarily a good or bad thing, but where it falls in the overall structure of the chart makes a big difference.
The Four Types of Gaps
Breakaway gap: Occurs following consolidation over an extended period of time, break out of consolidation range with large volume, and are often the beginning of a trend and rarely filled quickly.
Continuation gap (runaway gap): Occurs in the middle of an established trend to confirm that the existing move still has strong momentum behind it.
Exhaustion gap: Occurs following a prolonged, extended trend, frequently on a final burst of euphoric buying or panic selling, and is often quickly filled as the trend reverses.
Common gap: A small, insignificant gap within the range of a trading range (filled during the same session).
How to Tell Them Apart in Real Time
Where is the gap occurring — start of a fresh move, middle of a trend, or after an extended run? Context is everything
Is the gap accompanied by unusually high volume, or is it a low-conviction move?
Does price hold the gap through the first 30-60 minutes, or does it immediately start filling back?
Practical Rule of Thumb: Breakaway and continuation gaps that hold through the opening session can provide stronger evidence of sustained directional momentum. Exhaustion gaps, especially after an extended trend, may create potential reversal opportunities once the initial momentum stalls and reversal confirmation appears.
Important caveat: Gap behaviour varies by stock liquidity and the nature of the news driving it. Earnings-driven gaps behave differently from purely technical or sentiment-driven gaps. Education 
 Long
Long
XAUUSD — 4,257 Hold or 4,214 Sweep?
Gold is trading around 4,273 after extending the M30 decline below yesterday’s reaction support.
Price remains under the descending trendline, while the latest recovery attempt failed to create a meaningful structure shift.
Macro pressure is also still heavy ahead of the Fed decision, with elevated yields, a firm dollar and higher oil prices keeping Gold under pressure.
But price is now moving closer to the lower reaction zones.
And this is where chasing the sell becomes less attractive.
The reaction is the signal.
The simple read
M30 structure remains bearish below the descending trendline.
The latest bounce reached the 4,31x area but failed below the major resistance zone around 4,319.
Price has now moved back below the 0.618 Fibonacci level near 4,277 and is approaching the 0.786 area around 4,267.
The first important support sits around 4,253–4,257.
This area combines the previous swing low, Fib completion and visible reaction demand.
A clean buyer response here could create a temporary recovery.
But support is not an automatic buy.
If 4,257 fails, the chart leaves room for a deeper liquidity sweep toward 4,214.
That lower zone aligns closely with the 1.618 Fibonacci extension and is the stronger downside reaction area on this M30 structure.
On the upside, 4,285 is the first small recovery test.
The bigger level is still 4,319.
This area combines resistance with the descending trendline and remains the key seller decision zone.
Key price zones
Current price area: 4,273
Immediate Fibonacci reaction: 4,267–4,277
Main support / buy reaction zone: 4,253–4,257
Deeper liquidity zone: around 4,214
First recovery resistance: around 4,285
Main resistance + trendline: around 4,319
Major upper supply: around 4,398
Trading plan
Buy reaction scenario
If Gold reaches 4,253–4,257:
I will watch for sellers to lose momentum and buyers to show a clear reaction.
A confirmed recovery can first reopen 4,277–4,285.
If price then breaks the descending trendline, 4,319 becomes the next important test.
But I will not buy simply because price touches support.
Sell reaction scenario
If Gold recovers toward 4,285 or especially 4,319 and rejects:
The bearish M30 structure can remain intact.
A failed recovery may send price back toward 4,257.
Breakout scenario
If Gold breaks the trendline and can hold above 4,319:
The short-term structure changes significantly.
That would improve the recovery case and shift attention toward the higher resistance zones.
Breakdown scenario
If 4,257 cannot hold:
I would watch for the deeper liquidity move rather than chase the breakdown.
The next major reaction zone becomes 4,214.
A sweep into that area followed by a strong reclaim could create a much cleaner recovery structure.
The trend is still bearish.
But price is getting closer to support.
4,257 is the first buyer test.
4,214 is the deeper liquidity test.
4,319 is the real recovery confirmation level. Long 
#NIFTY Intraday Support and Resistance Levels - 16/09/2026Nifty 50 is expected to open flat near the 23250 level. The index is currently trading below the important 23200–23,250 support zone, after witnessing selling pressure in the previous session. The opening around this zone makes it an important area to watch for the next directional move.
On the bullish side, if Nifty sustains above 23250, a recovery toward 23350, 23400 and 23450 can be seen. A sustained move above 23500 would indicate stronger buying momentum and could further improve the short-term structure.
On the bearish side, if the index fails to reclaim 23200 and sustains below this level, selling pressure may increase toward 23100, 23050 and 23000. The 23000 region is the next major support visible on the chart.
With a flat opening near 23250, traders should closely monitor the 23200–23250 zone. A clear breakout above resistance or breakdown below support can provide better confirmation for directional trades, while movement within this range may remain volatile and range-bound. H4 Recovery From Lower Structural Support
XAUUSD is trading around 4,297 after extending the bearish H4 sequence into the lower part of the current structure. Price remains below the descending resistance trendline, so the broader bias is still defensive, but the market is approaching an area where a corrective recovery may develop.
The macro environment remains difficult for gold. The Fed begins its September meeting today, with a 25 bp hike widely expected after hotter inflation data. Gold has fallen to a fresh one-month low, while Brent has surged above $108 and the U.S. 10-year Treasury yield has traded around 5%, reinforcing inflation and higher-rate pressure on non-yielding gold.
Technical View
The H4 structure remains bearish after consecutive BOS signals and continued rejection beneath the descending resistance trendline.
Price is now trading close to the lower structural area around 4,225–4,260. Although the chart labels this lower box differently, technically it is the main reaction/support area for the projected recovery path.
A liquidity sweep into this region followed by bullish rejection, H4 reclaim or MSS confirmation could trigger a corrective rebound.
The first meaningful upside objective is the 4,405–4,440 Recovery Resistance zone.
If buyers regain acceptance above this structure, the next recovery target sits at 4,525–4,560 OB / Key Resistance.
The higher 4,640–4,665 area remains a larger HTF objective, but it should not be assumed reachable while the broader descending structure remains intact.
Key Zones
Current Price: 4,297
Lower Structural Support: 4,225–4,260
Recovery Resistance: 4,405–4,440
OB / Key Resistance: 4,525–4,560
Upper HTF Zone: 4,640–4,665
Major Swing High: 4,699.106
Trading Plan
Buy Priority: 4,225–4,260
Condition: wait for an H4 liquidity sweep followed by bullish rejection, reclaim, MSS or clear higher-low confirmation.
TP1: 4,405–4,440
TP2: 4,525–4,560
Invalidation: sustained H4 acceptance below 4,225 would weaken the recovery setup.
Buy/Sell View
This is a counter-trend recovery plan, not confirmation that the H4 downtrend has ended.
With the Fed decision approaching and rate-hike expectations extremely elevated, buying blindly around current price offers poor confirmation. The cleaner setup is to let price test lower structural support and show that sellers are losing control first.
If 4,225–4,260 fails, the bullish recovery thesis should be reassessed rather than forcing a long position.
Final View
Gold remains under strong macro and technical pressure ahead of the Fed, but H4 is approaching an important lower reaction area after an extended decline.
The main scenario is a liquidity sweep into 4,225–4,260 followed by confirmed recovery, targeting 4,405–4,440 first and 4,525–4,560 if momentum strengthens.
The Fed decision and guidance will likely determine whether this lower H4 structure can produce a genuine recovery or simply another temporary bounce. Long 
XAUUSD — Sell Pressure Below 4,300XAUUSD — Sell Pressure Below 4,300
Gold is still trading with a bearish intraday structure after failing to reclaim the upper liquidity zone. From Kelly’s view, the chart suggests that XAUUSD remains under selling pressure, and the current rebound is likely just a temporary pause before price continues lower.
The key idea is simple: as long as gold stays capped below the 4,290–4,300 sell zone, the market may continue rotating down toward the 4,254 support, then extend lower into the 4,235 area and possibly the final wave target near 4,160–4,170.
⟡ Market structure
Gold is currently trading around 4,290, right below the short-term liquidity sell zone. The recent price action keeps printing lower highs, which tells us that sellers still control the structure.
The area around 4,290–4,300 is important because it acts as immediate resistance. If price continues rejecting from this zone, the market may retest 4,254 first. A break below that support would likely expose the next reaction zone around 4,235–4,245.
From the Elliott Wave view, the chart still supports a bearish continuation. The current movement looks like a corrective wave before another downside leg develops. If sellers stay in control, the market may complete the next push lower toward the 4,160–4,170 target zone.
➤ Key levels
◌ Current price area: 4,290
◌ Sell zone liquidity: 4,288–4,300
◌ Intraday resistance: 4,300–4,310
◌ Strong support: 4,254
◌ Buy scalping wave 4 zone: 4,235–4,245
◌ Main bearish target: 4,160–4,170
◌ Bearish invalidation: above 4,310
⌁ Elliott Wave view
The chart shows a bearish Elliott Wave continuation structure.
Price is struggling below the sell liquidity zone, which may be the ceiling for the current recovery attempt.
If gold cannot break above 4,300, the next move may be a decline toward 4,254.
After that, a short rebound from the 4,235–4,245 wave 4 support zone may appear.
But if the broader bearish structure stays intact, the next selling leg could extend toward 4,160–4,170 to complete the downside wave sequence.
This is why Kelly is still prioritizing the bearish scenario while price remains below resistance.
▸ Trading scenario
Preferred bearish scenario
Entry: Sell around 4,288–4,300 if price shows bearish rejection
Stop Loss: Above 4,310
Take Profit 1: 4,254
Take Profit 2: 4,235–4,245
Take Profit 3: 4,160–4,170
Alternative scenario
If gold breaks above 4,300 and holds above that zone, short-term downside pressure may weaken. In that case, price could recover higher first before sellers return.
◌ Confirmation
Bearish confirmation comes if price continues rejecting below 4,300 and breaks down through 4,254.
◌ Invalidation
The bearish view becomes weaker if gold closes above 4,310 with strong momentum. That would suggest the market is no longer respecting the current sell zone.
⌁ Kelly’s view
Kelly’s main view remains bearish while gold stays below the 4,288–4,300 liquidity zone. The chart still favors selling rallies rather than chasing buys at the current level.
If sellers defend resistance, gold may continue lower toward 4,254, then 4,235–4,245. A deeper extension could later complete near 4,160–4,170.
Do you think gold will reject directly from this sell zone, or make one more small bounce before the next leg down? Short 
H2 Rebound Into POC Before Lower Liquidity
Fundamental Analysis
Gold is caught between two opposing forces. August U.S. CPI rose 0.4% MoM and 3.4% YoY, lifting expectations for a Fed rate hike next week to around 85%–87%. At the same time, renewed Middle East tensions continue to support safe-haven demand, keeping volatility elevated.
Technical Analysis
On H2, Gold remains inside a broader bearish structure after the recent CHoCH and BOS.
Price is now near 4,349, above the lower liquidity area. A corrective rebound could first develop toward the 4,420–4,450 POC zone, where previous structure and Volume Profile resistance overlap.
If sellers defend this area, the next bearish wave could target the 4,280–4,310 SSL.
Important Key Levels
4,601 — Major POI
4,510 — OB / Resistance
4,420–4,450 — POC / Sell Zone
4,280–4,310 — SSL / Main Liquidity
Trading Scenario
Sell priority remains on a rebound into 4,420–4,450 followed by bearish H2 confirmation.
Target: 4,280–4,310 SSL.
Invalidation: H2 acceptance above the POC zone and continued bullish structure.
Overall View
The H2 bias remains bearish, but price is already near lower levels. The cleaner setup is to wait for a corrective rebound into the POC before looking for the next move toward SSL.
Will Gold retest 4,440 before sweeping the liquidity below 4,300? Short 
XAUUSD — 4,293 Hold or 4,261 Sweep?
Gold is trading around 4,321 after another weak M30 rotation inside the descending channel.
The short-term bounce has lost momentum below the nearby resistance area, while sellers are still controlling the broader structure under the falling dynamic resistance.
Macro conditions also remain difficult for Gold. Markets are heavily pricing a Fed rate hike this week, Treasury yields remain elevated, and higher oil prices are keeping inflation concerns alive.
But this is also why the lower zones matter.
A bearish trend does not mean price falls in a straight line.
The reaction is the signal.
The simple read
M30 structure is still moving inside a clear descending channel.
Price continues to form lower reaction highs, while the upper channel resistance has repeatedly limited recovery attempts.
The first area I am watching is around 4,293.
This zone sits near the lower channel structure and can create the first buyer reaction if price reaches it with slowing bearish momentum.
However, 4,293 is not an automatic buy.
If sellers push through this level, the stronger support sits around 4,261.
That area combines channel support with visible demand, making it the more important liquidity reaction zone on this chart.
On the upside, 4,340–4,350 is the first short-term resistance.
Above that, the larger 4,398–4,410 area around 4,404 combines supply with descending channel resistance.
That remains the main seller test.
Key price zones
Current price area: 4,321
Short-term resistance: 4,340–4,350
Reaction support: around 4,293
Channel support + demand: around 4,261
Major supply + channel resistance: 4,398–4,410
Bullish pressure improves above: 4,350
Broader recovery improves above: 4,404
Bearish pressure strengthens below: 4,293
Trading plan
Buy reaction scenario
If Gold reaches the 4,293 reaction support:
I will first watch how sellers behave inside the zone.
A clean rejection or strong buyer response may create a short-term recovery toward 4,340–4,350.
But I will not treat the first touch as confirmation.
If 4,293 fails, the deeper 4,261 demand area becomes more interesting.
A liquidity sweep into 4,261 followed by a clear recovery could offer a stronger reaction structure back toward the upper side of the channel.
Sell reaction scenario
If Gold rebounds into 4,340–4,350 and buyers cannot hold above it:
This can remain the first sell reaction area.
Price may rotate back toward 4,293 and potentially the deeper 4,261 support.
Breakout scenario
If Gold breaks 4,350 and holds the retest:
The short-term recovery becomes stronger.
The next important target becomes the descending dynamic resistance, followed by the 4,398–4,410 supply area.
A sustained hold above 4,404 would be the stronger signal that the current M30 bearish channel is losing control.
Breakdown scenario
If Gold loses 4,293 with clean bearish continuation:
I would not chase the breakdown.
The next important reaction area becomes 4,261, where channel support and demand meet.
The M30 trend is still bearish.
4,293 is the first buyer test.
4,261 is the stronger demand test.
4,340–4,350 is the first seller test.
4,404 remains the major resistance decision zone. Long 
JSWENERGY: Powerful Breakout From Multi-Month Accumulation BaseThe Setup (Bias): I am taking a LONG bias on JSW Energy Limited (JSWENERGY) on the weekly timeframe.
The "Why" (Technical Reasons): 1. Major Base Breakout: After a deep correction from its macro highs (the red line at 792.30), the stock spent nearly a year chopping sideways and building a massive structural base. The price has now forcefully broken out, cleanly slicing through the heavy intermediate resistance ceiling at 552.70.
2. Shift in Market Structure: The breakout is confirmed by a strong, full-bodied green weekly candle closing near its highs. This impulsive price action proves that institutional accumulation is likely complete, sellers have been absorbed, and a new bullish trend is taking over.
Trade Plan (Entry & Exits): * Entry: Momentum traders can look for entries near the current market price of 580.90 to capture the immediate phase transition. A safer, lower-risk approach would be placing limit orders to catch a potential weekly pullback or retest of the 552.70 breakout zone, letting the old multi-month ceiling prove itself as a new support floor.
Take Profit (Target): With the stock breaking out of this base, there is a large void of resistance above. The first major psychological target is 650.00, followed by an ultimate macro swing target back up to the all-time high resistance zone at 792.30.
Stop Loss: Placed safely below the right side of the consolidation base, around the 480.00 to 500.00 level. A weekly close back below the 552.70 structural level would be an early warning sign of a false breakout.
Duration: Because this analysis is built on a 1-Week chart capturing a major base breakout, this is a medium-to-longer-term position trade designed to play out over the coming weeks to months.  Long
Long
Long 


