ZOMATO Ltd.Zomato stock price projection Buy when the stock traded near 60 levels, for the target of 100, put stop loss below 55 levels.ZLongby Pro_Trader_Club1
💎 GALAUSDT : 1012% Profit Potential in Next 8 Months💣💣💣💣last week we seen huge buying in GALA coin, in upcoming months its going pump very hard. entry and targets are given on the chart. Please Like and comment if there are any queries. Longby Rohit_Shinde2
MINDTREEWait And Watch ?? Look for Low risk, High reward, and High Probability setups- Things to Remember while Trading with the Trend 1. Know what the trend is. 2. The best trades are made in the direction of the trend. 3. Assume that the main trendline or moving average will hold. 4. The longer the moving average is, the better it defines the trend. 5. Wait for the pullback. 6. Don’t chase the market. 7. Don’t fight the market. 8. Even in the strongest trends there should be some retracement. 9. The closer the market is to the trendline, the better the risk/reward ratio is. 10. Use ADX to determine the strength of the trend. 11. Higher the level of ADX , the stronger the trend, below 20 consider the market to be choppy 12. Hold trades longer in a strong trend. 13. Wait for confirmation of a trendline breaking before reversing position. 14. Know where the Support levels are. 15. Place stops outside the Support levels. Thank You..MLongby Rvkachhadiya6
JPINFRATECH : 110% ACHIEVED This is a trade taken on 5th December. Within a month its 100% up now. Target is more than 200% and the time duration calculated is 2to 3 months. Details are in the chart. My charts are very clear and easy to understand. You'll not see lots of support and resistance drawn or any complications. What do you feel about my charts and drawings? Please give feedback in the comment section. Jby Cruoso4u333
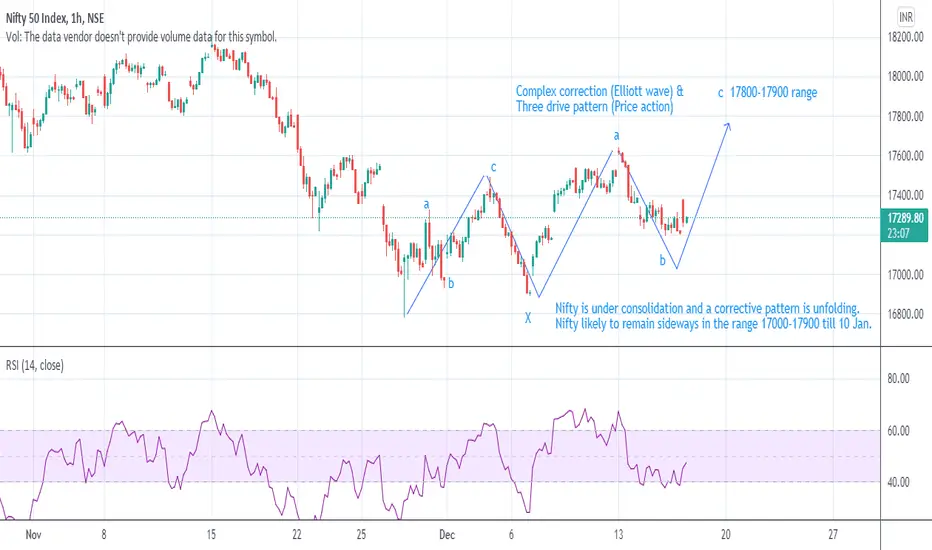
Nifty under consolidationNifty will remain sideways in the range 17000-17900 for some time based on the EW pattern. by abhinav10011
INVERTED HEAD & HOLDER PATTERN ON GLENMARKBUY : 515 TO 525 TARGET : 691 TO 810 Reason For Buying This Script : In this script it is forming inverted head & shoulder patter in monthly time frame . Now the price is in right shoulder. Try to accumulate every dip. Don't miss this opportunity. Note : Above given levels are based on monthly & weekly time frame . So be patience it will take some days to achieve the target. ALL THE BEST .. Longby dayanithi5553
Mahindra and Mahindra LtdWait And Watch ?? Look for Low risk, High reward, and High Probability setups- Things to Remember while Trading with the Trend 1. Know what the trend is. 2. The best trades are made in the direction of the trend. 3. Assume that the main trendline or moving average will hold. 4. The longer the moving average is, the better it defines the trend. 5. Wait for the pullback. 6. Don’t chase the market. 7. Don’t fight the market. 8. Even in the strongest trends there should be some retracement. 9. The closer the market is to the trendline, the better the risk/reward ratio is. 10. Use ADX to determine the strength of the trend. 11. Higher the level of ADX , the stronger the trend, below 20 consider the market to be choppy 12. Hold trades longer in a strong trend. 13. Wait for confirmation of a trendline breaking before reversing position. 14. Know where the Support levels are. 15. Place stops outside the Support levels. Thank You..Longby Rvkachhadiya1
Am I Reading This Correctly???Three Pattern Movement seen on a 3 year chart of Reliance. Am I reading this correctly?? Is Reliance ready for its next big upmove of around 500-600/-??? Disclaimer: This is not a buying or selling recommendation. Just sharing it for self education purpose and taking opinions from experienced analysts.by KushOnTheRocks223
TRANGLE & ELLIOTE WAVE PATTERN IN SNOWMAN LOGESTICS 16.08.21BUY : 45 TARGET : 89 TO 109 Reason For Buying This Script : In this script it forming triangle pattern & Elliott wave in monthly time frame. But still triangle pattern is not broken. Aggressive trader can take the trade before the breakout or else wait for breakout. Don't miss this 105% profit opportunity. Note : Above given levels are based on monthly & weekly time frame . So be patience it will take some days to achieve the target. ALL THE BEST .. Longby dayanithi555110
L&TFHL&TFH Let's wait for it ........!!!! Accumulate at supports marked in green Exit if fall below super support - red line breaking three drive in upward direction hold the fib targets. Longby Market_Crux4
Bullish Three Drives Pattern in NIFTYAccording to bullish three drives pattern nifty indicating reversal of previous downtrend. Today we got the breakout of its resistance trend line if nifty sustain above this level one more trading session then we will get confirmation about the uptrend in market. According to pattern there was a good entry near 14150 level. It was also 100 Day's EMA level support. Also, Can take breakout entry of downtrend parallel channel of this pattern for target of each swing high. This breakout can give movement upto first swing high 15425+. Educationby TradZoo2236
Nifty Levels to watch Nifty can go down after the selling started at resistance level 14700. Level to watch is next fib level .618 14526 and can extend to 14402 in intraday level on monday. 14490 is good level to watch for safe traders to head toward 14400. In 15 min a trendline break can be seen as weakness confirmation. After 14400 a pull back is expected till 14530-80 before heading towards 14200-14000 On Daily chart nifty is heading toward 14040. Long pattern 3 driver in forming and target is 14040 this month. Chart is self explanatory. DISCLAIMER:There is no guarantee of profits or no exceptions from losses. The study provided is solely the personal views of my research. You are advised to rely on your judgment while investing/Trading decisions. Past performance is not an indicator of future returns. Investment is subject to market risks. Seek help of your financial advisors before investing/trading.Shortby sketchitesh224
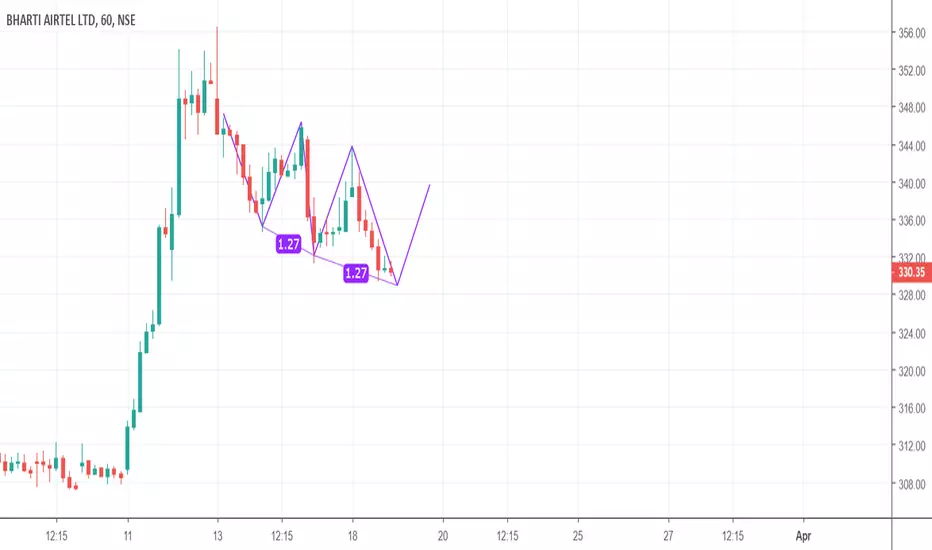
USD/INR (target 79+): ABCD & Three Drives PatternHere, AC and CE are 0.52 . BD is 1.27 . By using ABCD & Three Drives Pattern, USD/INR will test 79 levels in the 2021 year. Afterward, its trend will change. We may see 75 levels as a correction. Short-term investors can buy here for 74.4 - 76 - 78+ levels. ABCD Pattern shows that the C point is a stepping stool towards the level of 79.44 ( 1.27 retracement level ), and the D point is a reversal zone. Like and comment on my articles, and follow me for regular updates & new trading ideas.ULongby forextidingsUpdated 7723
3 Drive at bottom with Divergence REVERSALBank Nifty has clearly formed the 3 Drive at bottom pattern and showing Divergence. Those who prefer to take risk can put it the index on radar and initiate a long trade. Disclaimer : All ideas are my personnel view. Please take financial consultancy for trading decision.Longby praveen.bhatiya2
Important resistance zone and probable three drive formationShort sell if it does not breach the resistance by 20th April 2019, i expect a three drive formationShortby shreyansh.sancheti33
Three drives pattern formationI expect another upmove followed by a range bound down move the stock posseses good fundamentals. buy for both short and long term.Longby shreyansh.sancheti31
Jindal Steel_Three Drives Pattern_BearishJindal Steel may fall from the current level, immediate resistance and support levels are 167 & 162 respectively. Educationby RockyNaru0
Three drives pattern---- go all BULLsThree drives formation is observed here expecing a target of 389/390.Longby shreyansh.sancheti32
3 Drives Reversal with good Risk to Reward.Prices have formed nicely "3 Drives Reversal" pattern and offering a good trade at current level. Entry 74 SL 72.5 Target 79 Risk/Reward Ratio above 3 Disclaimer : All ideas are my personnel view. Please take financial consultancy for trading decision.Longby praveen.bhatiyaUpdated 12
Repetitive patterns The share has seen a repetitive sequential of session highs and lows (time range 3-6 months), forming two new highs- B in the chart after every low A in the chart. As this is followed we see a predictive range of 595 - 1st Resistance and the 2nd B(Resistance) - 658 Time period - 3 -6 months Longby RajGorateal0
BCHZ18 looking for an long opportunity forming three drive pattern 3 will end between in this range 0.0370-0.0354 ladder your position between that range expecting target upto 18%Bby S6H7861
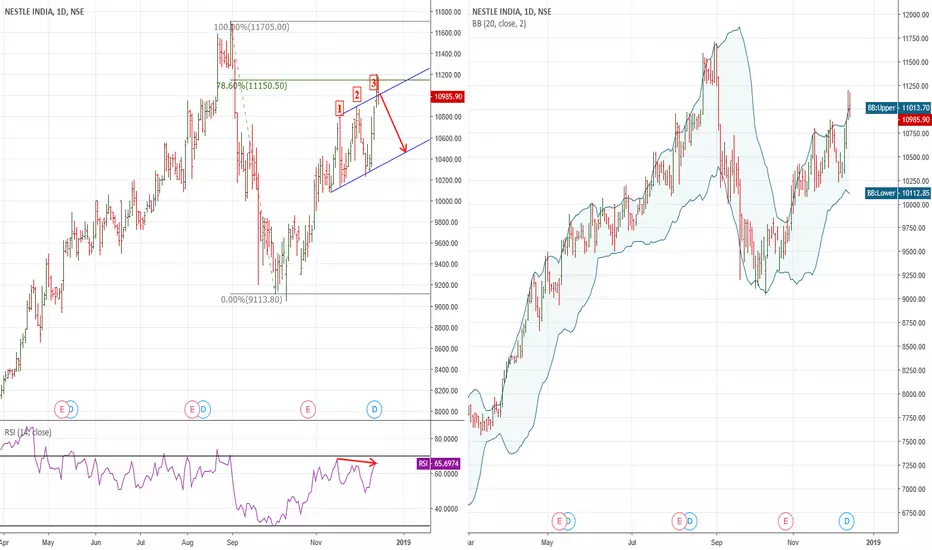
3 Drive on Top/RSI Divergence The stock has formed a 3 Drive on Top reversal pattern at the 78.6 fib level of last swing. RSI is not supporting the 3rd top and showing divergence. It has came back to Bollinger Band so it seems to be a good short trading is possible here. One can shot below the 10890 with small SL of recent made high and expect the target of 10500/10100. Disclaimer : All ideas are my personnel view. Please take financial consultancy for trading decision. Shortby praveen.bhatiyaUpdated 4413