UNO MINDA - A GOOD BET ?We’ve seen a significant move in UNO Minda over the last couple of sessions. The move seems to have been supported by the company’s recent capex announcement, followed by investor meetings, which have brought fresh attention to the stock.
The chart is also showing good strength, with the recent move accompanied by higher volumes. This suggests that there could still be some room for further upside. That said, it’s important to keep an eye on the previous intraday highs around ₹1,297 (10th Aug) and ₹1,309 (1st Sept).
The 18th Sept candle was particularly strong — a solid bullish candle with virtually no upper wick and noticeably higher volumes. If the stock manages to sustain above the ₹1,309–₹1,320 zone, it could potentially trigger another leg of momentum.
For now, UNO Minda is definitely a stock worth keeping on the radar and watching closely around these resistance levels.
 Long
Long
NIFTY 50 – WEEKLY CHART ANALYSIS🔻 Key observations
Inverted Cup & Handle: The rounded top followed by the handle structure has broken on the downside.
Breakdown + Retest: The broken trendline/neckline has been retested and price is currently moving lower.
Current zone: NIFTY is around 23,346, below the broken structure.
Bearish Order Block (Red Zone) : 25,600–26,400 — major supply/resistance zone.
Bullish Order Block (Green Zone which is by mistakenly written Blue zone) : 22,200–22,650 — important demand/support zone.
Structure: Lower highs are developing after rejection from the 24,000–24,400 region.
📉 Downside scenario
If NIFTY continues to sustain below the broken structure, the 22,650–22,200 bullish order block becomes the key area to watch.
A decisive breakdown below 22,200 would weaken the bullish order-block structure further and could expose lower levels.
🔄 What would invalidate the bearish structure?
A sustained recovery back above the 24,000–24,400 region would require reassessment of the inverted Cup & Handle breakdown. A stronger reversal signal would come if price subsequently reclaims the broken trendline and forms higher highs.
For the weekly chart, the 22,200–22,650 zone is the major area to watch for a potential reaction, while 24,000–24,400 is the important recovery zone.
DISCLAIMER :
This content is based solely on my personal technical analysis and study of the chart. It is shared for educational and informational purposes only.
This is not financial, investment, or trading advice, and it is not a recommendation to buy or sell any security, index, futures, or options contract.
Please do your own research and analysis before taking any trade. Market conditions can change rapidly, and the levels, patterns, targets, and scenarios may become invalid as price action develops.
Trading involves substantial risk, including the possibility of losing your invested capital. Past performance does not guarantee future results.
Do not trade solely based on this analysis. Consider consulting a qualified financial advisor before making investment decisions.
Trade with logic. Risk with discipline.
Logic Trade Room
GOLD (XAUUSD) – DAILY CHART🔥 CHANNEL BREAKOUT + RETEST COMPLETE
Gold has broken out of the descending channel and the breakout/retest appears complete. Price is holding above the channel resistance, creating a chart-based setup for a potential upside move.
🎯 TRADE LEVELS:
🟢 Entry: Above $4,400
🛑 Stop Loss: $4,280
🎯 Target 1: $4,480
🎯 Target 2: $4,560
🎯 Target 3: $4,665
📌 Wait for daily candle confirmation above the breakout zone. Trail SL as price moves in your favor.
💬 Like • Comment • Follow for more setups!
DISCLAIMER :
This content is created by Logic Trade Room for educational and informational purposes only.
It is not financial advice, investment advice, trading advice, or a recommendation to buy or sell any security, index, futures contract, or options contract.
Trading and investing in the stock market involve substantial risk, including the risk of losing your entire invested capital. Past performance does not guarantee future results.
The entry, stop-loss, and target levels mentioned are illustrative chart-based levels and may change with market conditions. No trade setup or market prediction is guaranteed to be accurate.
Always conduct your own research, verify live market prices, and consult a qualified financial advisor before making investment decisions.
Trade with logic. Risk with discipline.
Logic Trade Room  Long
Long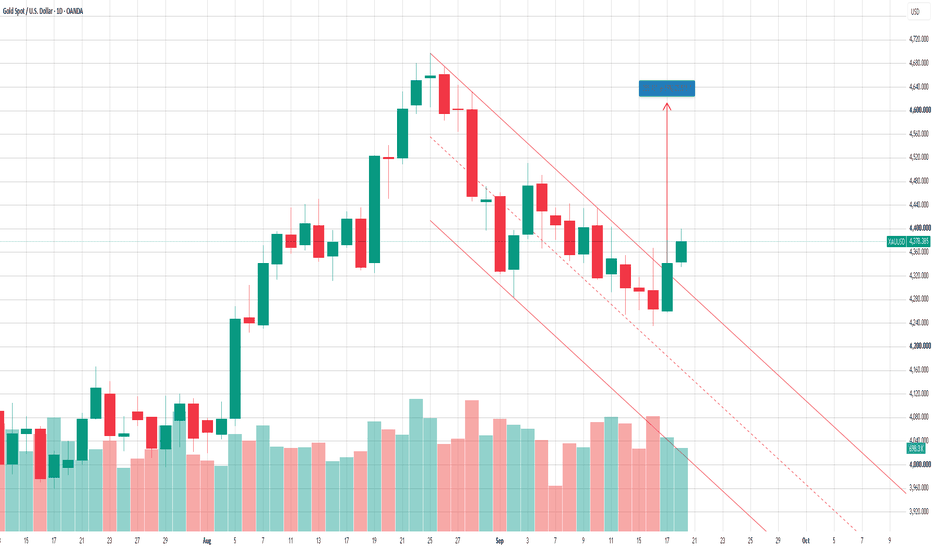
GOLD (XAUUSD) – WEEKLY FIBONACCI ANALYSISBased on the Fibonacci levels marked on your chart, Gold is currently around $4,378, positioned between the 0.786 and 0.618 Fibonacci retracement levels.
🔎 Current Structure
Gold made a strong advance and then entered a correction. The price is now recovering from the $4,000–$4,200 region and is holding above the 0.786 Fib at $4,297.
However, the 0.618 level at $4,576 is the immediate hurdle. The descending trendline shown on your chart is also approaching this area, making $4,576–$4,600 an important confirmation zone.
🟢 Bullish Scenario
A sustained weekly move above $4,576 could open the way toward:
$4,727 → $4,968 → $5,210
The $4,727 (0.5 Fib) level would be the next major resistance after $4,576.
🔴 Bearish Scenario
If Gold gets rejected around $4,576 and falls below $4,297, the correction could extend toward:
$3,942 (Fib 1.0)
A decisive break below $3,942 would significantly weaken the current recovery structure and bring the $2,916 (1.618 extension) into the longer-term Fibonacci picture.
📈 Momentum
RSI is around 50, which is essentially neutral. This means momentum has recovered from the previous weak zone but has not yet established strong bullish momentum.
🎯 My chart-based setup
Bullish confirmation: Weekly close above $4,576
Upside levels: $4,727 → $4,968 → $5,210
Key support: $4,297
Major support: $3,942
So, from the Fibonacci perspective, $4,297–$4,576 is the key decision zone. Holding $4,297 keeps the recovery structure intact, while reclaiming $4,576 would provide stronger bullish confirmation.
💬 Like • Comment • Follow for more setups!
DISCLAIMER:
For educational and informational purposes only. This is my personal technical analysis, not financial or trading advice or a recommendation to buy/sell. Do your own research before trading. Markets involve substantial risk, and all levels, targets and setups are illustrative and not guaranteed. Trade with proper risk management and never rely solely on this analysis.
Trade with logic. Risk with discipline.
Logic Trade Room Long 
XAUUSD – Bearish Structure Broken, But 4,447 Is Key XAUUSD – Bearish Structure Broken, But 4,447 Is Key
Gold is starting to show a more constructive recovery after breaking the short-term bearish market structure.
Price is trading around 4,378 after reacting strongly from the lower support area near 4,240 – 4,260. The chart shows that the previous bearish trendline has been violated, and price is now holding above the buy order zone around 4,349. This is an important change because sellers no longer have the same clean control they had during the earlier decline.
However, gold is not fully bullish yet. The market is now entering a confirmation phase. Buyers need to defend the current support and push price above the next resistance zone before the recovery becomes stronger.
Technical view:
Gold broke the short-term bearish structure.
Price is holding above the buy order zone around 4,349.
The current reaction area is near 4,378 – 4,402.
The first important resistance is around 4,447.
This area also aligns with Fibonacci resistance and FVG structure.
If gold breaks above 4,447, buyers may continue toward 4,593.
The 4,593 area is a major liquidity and Fibonacci resistance zone.
If gold fails to hold 4,349, the recovery structure may weaken and price may retest 4,240 – 4,260.
Key levels to watch:
Current price: 4,378
Buy order support: 4,349
Short-term confirmation: above 4,402
Key resistance: 4,447
Major liquidity target: 4,593
Lower support: 4,240 – 4,260
Bullish invalidation: below 4,349
Main scenario:
If gold holds above 4,349 and breaks back above 4,402, buyers may try to push price toward 4,447.
A clean breakout above 4,447 would confirm stronger bullish recovery momentum and open the way toward 4,593.
This would turn the recent move from a simple correction into a more meaningful recovery structure.
Alternative scenario:
If gold fails to hold above 4,349, the breakout may become a false recovery.
In that case, sellers may try to pull price back toward the previous support zone near 4,240 – 4,260 before buyers appear again.
Hannah’s view:
Gold is showing the first sign of recovery, but confirmation is still needed.
The bearish structure has been broken, which is a positive signal for buyers. But the market is now sitting between support and resistance, so I do not want to chase the move too early.
Main view: gold can continue higher if 4,349 holds and price breaks above 4,447. The next larger target would be 4,593. If 4,349 fails, gold may return to the lower support area before building a stronger setup. No confirmation means no trade.
Do you think gold can break 4,447, or will sellers defend the Fibonacci resistance again?
Long 
 Education
GOLD – WEEKLY TECHNICAL OUTLOOK-21-25 sep 2026### GOLD – WEEKLY TECHNICAL OUTLOOK
Gold continues to maintain a **bullish bias on both the daily and weekly charts**. The **hammer pattern formed on the weekly candle** suggests that the downside may remain capped unless Gold breaks below the previous week’s low of **4,234**.
Gold is currently trading **above the next week’s pivot level** and is also close to the **monthly pivot level**. A decisive breakout above the **4,388–4,400 zone** could strengthen the bullish momentum and may lead to further upside towards **4,440, 4,500 and 4,600**.
The **4,630 zone** remains a significant resistance area, as the market has reversed from this level on two previous occasions. A sustained breakout above **4,630** could open the way towards the next major resistance zone around **4,850**.
At these higher levels, traders should remain cautious, as Gold could potentially reverse from the **4,600–4,630** zone or, if that level is decisively breached, from the **4,850** resistance area.
### Trading Levels
**BUY ABOVE 4,400**
Targets: **4,440 → 4,510**
**SELL BELOW 4,270**
Targets: **4,234 → 4,050**
**Key Resistance:** 4,388–4,400 | 4,630 | 4,850
**Key Support:** 4,270 | 4,234 | 4,050
The overall bias remains bullish as long as Gold sustains above the key support levels. A break below **4,234** would invalidate the current bullish structure and could signal increased downside pressure.
**Disclaimer:** This analysis is based on technical observations and is provided for educational and informational purposes only. It should not be considered investment or trading advice. **I am not SEBI registered.** Please consult a SEBI-registered investment adviser before making any investment or trading decisions.
BRIAN XAUUSD – GOLD HOLDS POC, BUT 4,438 IS THE TEST BRIAN XAUUSD – GOLD HOLDS POC, BUT 4,438 IS THE TEST
Gold is trying to rebuild bullish momentum after defending the lower value area, but the market is still not fully clean for aggressive buying.
On the H4 chart, the bigger structure still shows buyers holding above the rising trendline from the previous accumulation phase. This is important because gold has not broken the larger bullish base yet. However, price is now trading around 4,378 after recovering from the Buy VAL 4,290 and Buy zone POC 4,351 areas.
The current reaction is positive, but gold is now approaching the first important resistance: Sell scalping VAH around 4,438.
Technical structure
Gold recently swept lower into the 4,290 value area, then recovered strongly back above the POC support around 4,351. This tells me buyers are still active below the market.
The key short-term base is now 4,351. As long as price holds above this zone, the recovery structure remains valid.
The first upside test is 4,438. This is the VAH resistance and also a possible seller reaction zone. If gold reaches this level and rejects, price may rotate back toward 4,351 again.
If buyers break and accept above 4,438, the next major upside target becomes the Sell zone POC around 4,595. That is the larger resistance from the previous high-volume area, and I would expect stronger selling pressure there.
Important zones
Current price area: 4,370 - 4,390
Gold is recovering but still below the main VAH resistance.
Buy zone POC: 4,351
Main buyer defense zone for the current structure.
Buy VAL: 4,290
Deeper value support if gold pulls back harder.
Sell scalping VAH: 4,438
First resistance and short-term seller reaction zone.
Sell zone POC: 4,595
Major upper resistance and larger seller interest area.
Trendline support: rising structure below current price
As long as price holds above this trendline, the broader recovery view remains alive.
Trading scenario
Priority view: buy reaction above 4,351
Entry:
Look for buy positions only if gold holds above 4,351 and shows clear bullish rejection from the POC support.
Stop Loss:
Below the local sweep low or below the 4,351 support zone.
Take Profit:
TP1: 4,438
TP2: 4,500
TP3: 4,595 if buyers break and accept above the VAH resistance
This setup follows the current bullish recovery structure, but confirmation is still needed. Buying directly into 4,438 is risky because that is the first seller reaction area.
Alternative sell scenario
If gold reaches 4,438 and shows strong rejection, a short-term sell reaction may appear.
Entry:
Look for sell positions only if price rejects clearly from 4,438 and fails to hold above it.
Stop Loss:
Above the rejection high.
Take Profit:
TP1: 4,351
TP2: 4,290 if downside pressure expands
This would be a reaction sell, not a full bearish reversal, unless gold also breaks below 4,351 and loses the rising trendline.
Final view
Gold is still holding the bullish value structure, but the next confirmation must come from 4,438.
For now, my map is simple:
Hold 4,351 = buyers remain active.
Break 4,438 = recovery momentum improves.
Reach 4,595 = major resistance test.
Reject 4,438 = price may rotate back to 4,351.
Lose 4,351 = deeper pullback toward 4,290 becomes possible.
Gold is not weak while it stays above the POC and rising trendline, but it is also not clean enough to chase directly under VAH resistance.
The best setup is to wait for confirmation: either buyers defend 4,351 for continuation, or sellers reject 4,438 for a short-term rotation.
Will gold break above 4,438 and open the path toward 4,595, or will sellers defend the VAH first?
Long 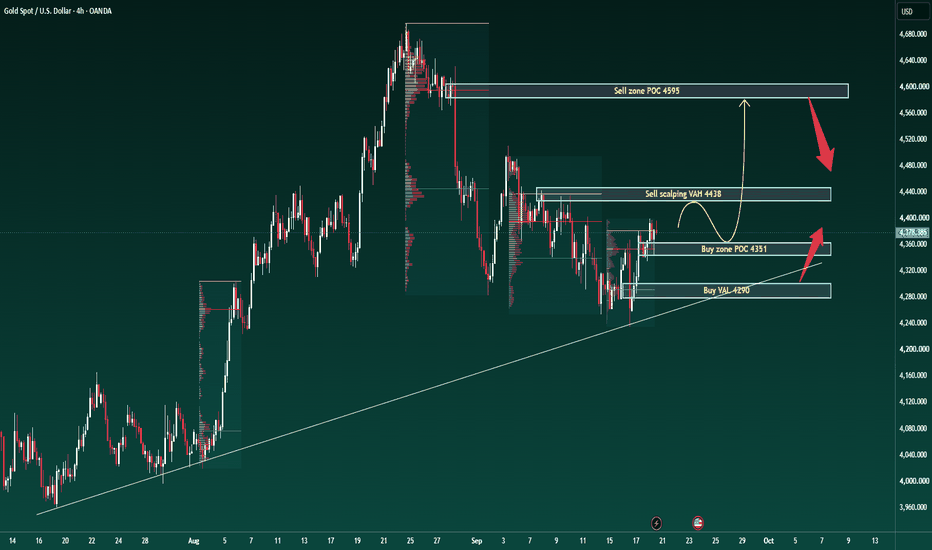
XAUUSD Weekly Outlook — Breakout Needs a Retest
Gold is sitting around 4,378 after breaking the H4 descending trendline.
The structure is improving, but price is now testing the 4,385–4,405 immediate resistance area.
The simple read
A pullback toward 4,290–4,320 would be the cleaner test for buyers.
If this zone holds, Gold may recover toward 4,400 first, followed by the major 4,485–4,510 resistance.
A clean break above 4,510 could later expose the H4 resistance around 4,630.
If 4,290 fails, the major swing support near 4,235 becomes important again.
Key price zones
4,385–4,405 — immediate resistance
4,290–4,320 — key pullback support
4,235 — major swing low
4,485–4,510 — major resistance
4,630 — H4 resistance
The trendline break is encouraging, but I prefer a retest before continuation.
Do not chase the breakout.
Wait for the zone.
Can buyers defend 4,30x and open the path toward 4,500? Long 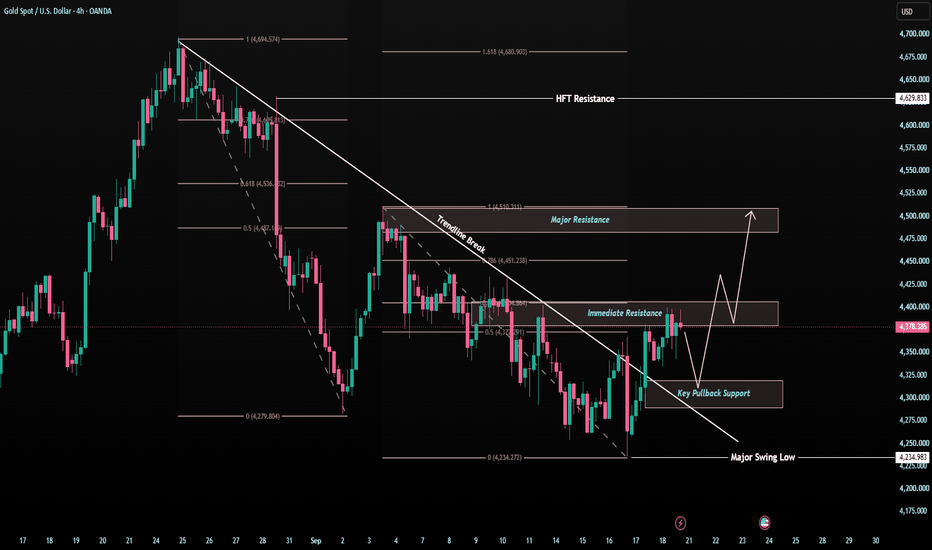
XAUUSD — Bullish Retest Toward 4,410Fundamental Analysis
Gold finishes the week on firmer footing as easing crude oil prices reduce near-term inflation pressure, helping XAUUSD recover despite the U.S. dollar remaining near a seven-week high. Gold posted its first weekly gain in four weeks, while markets now price roughly a 55% probability of another Fed hike in October after this week’s 25 bp increase.
Treasury yields have also eased from their post-Fed highs, although the U.S. 10-year remains close to the important 5% area. Next week, traders will focus on U.S. PMI data, Fed communication and whether lower energy prices can continue moderating inflation expectations.
Technical Analysis
On H1, XAUUSD is trading near 4,378 after successfully reacting from the previous 4,355–4,367 buy zone and reaching the 4,389–4,395 resistance area.
Price has printed a BOS above 4,377, while the rising support trendline continues to protect the recovery structure.
The preferred continuation area remains 4,355–4,367, where Fibonacci 0.618, previous structure and the marked buy zone converge.
If buyers defend this area again, gold may retest 4,389, followed by the key 4,410 liquidity high.
A deeper correction could reach 4,342, with the H1 FVG around 4,323–4,342 acting as secondary support.
Important Key Levels
4,410 — Main liquidity target
4,389–4,395 — Immediate resistance
4,377 — BOS / short-term pivot
4,355–4,367 — Main buy zone
4,342 — Fibonacci support
4,323–4,342 — H1 FVG
Below 4,338 — Bullish invalidation
Trading Scenario
Main Buy Setup
Entry: 4,355–4,367
Stop Loss: 4,338
Take Profit 1: 4,389
Take Profit 2: 4,400
Take Profit 3: 4,410
Buy Condition
Wait for a controlled retracement into 4,355–4,367 and bullish confirmation. A liquidity sweep, long lower wick, bullish engulfing candle or H1 reclaim above 4,367 may signal renewed buyer pressure.
A sustained H1 break below 4,338–4,342 would weaken the continuation setup.
Overall View
The H1 structure remains constructively bullish while price holds above the rising support structure. Since gold is currently near the 4,377–4,390 resistance area, chasing fresh longs offers less attractive positioning.
The preferred plan is to wait for another retracement into 4,355–4,367. If buyers defend the zone, XAUUSD could retest 4,389–4,400 and potentially attack the 4,410 liquidity high.
Will gold defend 4,355–4,367 again before breaking 4,410? Long 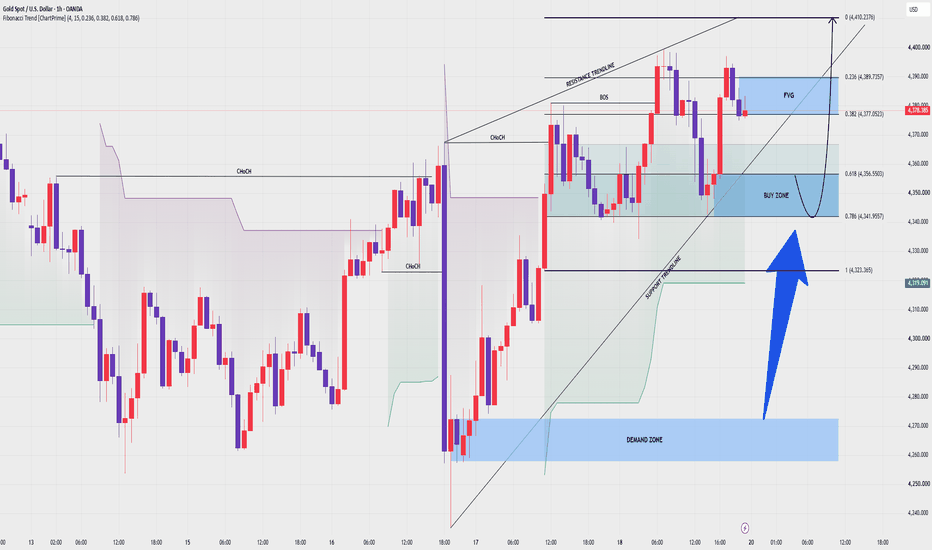
XAUUSD — 4510 Is Where It Gets Dirty XAUUSD — 4510 Is Where It Gets Dirty
Gold bounced.
But this is not clean bullish control yet.
Price reacted from the lower area around 4,235 - 4,280, then pushed back above 4,350. Nice recovery, yeah. But look at where price is now.
Right in the middle.
Around 4,378, gold is still trading inside the bearish correction channel. That means I don’t want to chase buys here. This is exactly where late traders usually get trapped thinking the reversal is confirmed.
The real test is higher.
4,422 is the first liquidity line. If gold breaks that, buyers may get excited again. But the zone I care about is 4,480 - 4,520.
That area is the Bearish PD Array, FVG and OB zone. Basically, the place where sellers may reload if price gives them a clean rejection.
Main view stays bearish while gold holds below 4,520.
Main zone: 4,480 - 4,520
Reaction target: 4,300
Deeper target: 4,180 - 4,150
Invalidation: strong hold above 4,520 - 4,550
Trade idea is simple.
If gold pumps into 4,480 - 4,520 and starts rejecting, I’ll look for a sell reaction back toward 4,300 first.
If gold breaks and holds above 4,520, then the bearish idea gets weak and price can start reaching toward 4,590 - 4,620 external liquidity.
For now, this looks like recovery into resistance, not a clean reversal.
You think gold traps buyers at 4,510, or breaks straight into 4,600 liquidity?
Long 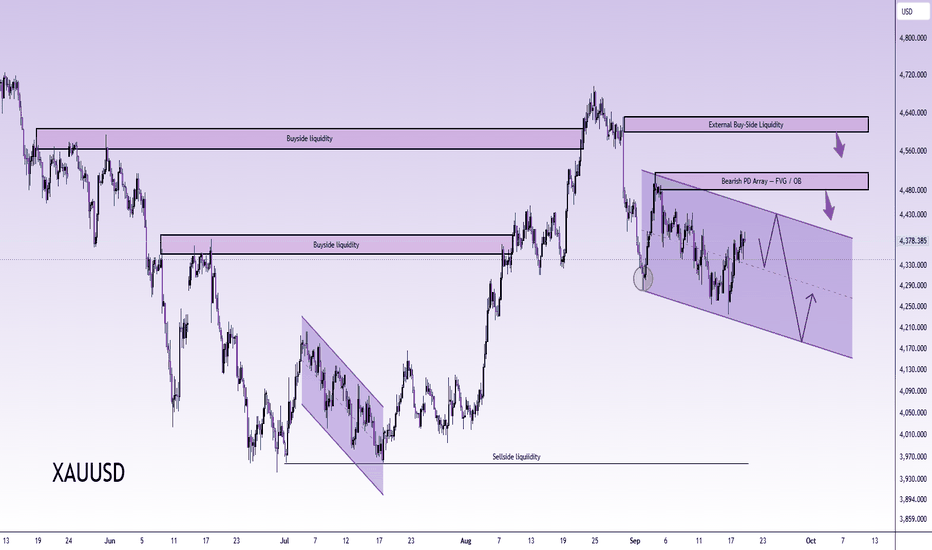
NIFTY — Bounce Off Major Support, Testing Resistance LadderOverview
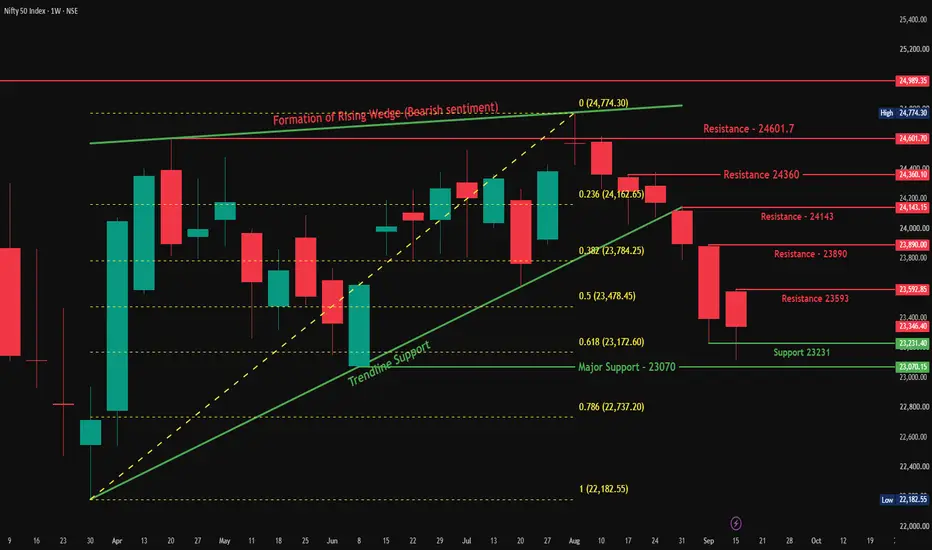
Nifty closed the week at 23,346.40, down 51.70 points or 0.22%, a much smaller decline than recent weeks. Price tested Support 23,231 and held above Major Support (23,070), the confluence zone flagged last week, and has since stabilized within a tight range.
Follow-up on Last Week's View
Last week we flagged the Trendline + 0.618 Fib confluence (23,172) breaking down, with Major Support (23,070) as the next target. That level came close to being tested, with the low landing at 23,116.10, just above Major Support, before buyers stepped in. This week's price action shows the selling pressure easing, with a much smaller weekly decline compared to the prior sharp drops.
Pattern Explanation
Price is now building a small base just above Support 23,231, with a resistance ladder forming overhead: 23,593, then 23,890, then 24,143, and finally the bigger Resistance zone (24,360–24,601.70). Each of these levels will need to be cleared in sequence for the broader downtrend to be meaningfully challenged. The longer-term Rising Wedge breakdown context still applies, so this stabilization needs to be treated as a potential pause rather than a confirmed reversal until more resistance levels are reclaimed.
Key Levels
Resistance Zone: 24,360–24,601.70
Resistance 3: 24,143
Resistance 2: 23,890
Resistance 1: 23,593
Support: 23,231
Major Support: 23,070
Scenarios
Bullish: If Nifty reclaims 23,593 with strength, it would suggest this stabilization is turning into a genuine recovery attempt, opening the path toward 23,890 and 24,143.
Bearish: If Nifty breaks below Support 23,231 and Major Support (23,070), it would confirm the broader downtrend is resuming, with the 0.786 Fib (22,737) as the next level to watch.
Beginner's Lesson
After a sharp decline, a week (or two) of smaller, tighter candles often signals sellers are running out of momentum, at least temporarily. This doesn't automatically mean a trend reversal, it could just be a pause before the next move. The way to tell the difference is watching how price behaves at the first real resistance test, a strong reclaim suggests genuine buying interest, while a weak bounce and quick rejection suggests the pause is just that, a pause.
Conclusion
Nifty is showing early signs of stabilization after a sharp multi-week decline, holding above Major Support and testing a ladder of resistance levels above. A reclaim of 23,593 would be the first sign of a genuine recovery attempt. A break below 23,231 and 23,070 would confirm the downtrend is still in control. This remains a level-to-level market, with the next couple of weeks likely to clarify which scenario is playing out.
This is for educational purposes only and not investment advice. Please do your own research or consult a financial advisor before making any trading decisions. AVALON : Massive Volume Surge Following Secondary Consolidation.Chart Analysis:
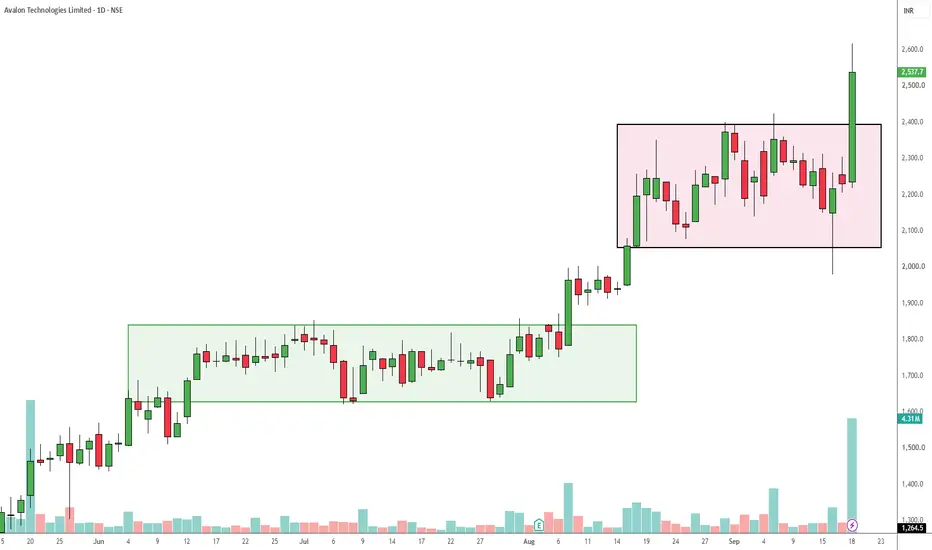
The daily chart for Avalon Technologies Limited (NSE: AVALON) illustrates a classic multi-stage markup phase.
After an initial accumulation and breakout from the lower base (green box), the stock established a secondary consolidation range (pink box) roughly between the 2,050 and 2,400 levels.
In the most recent session, AVALON delivered a decisive bullish breakout above the 2,400 resistance level, gaining +13.80% to close at 2,537.7.
This price action is supported by a massive volume spike of 4.31M shares, which strongly validates the breakout's momentum and suggests heavy buying interest.
Trade Setup:
Entry Point: Entry can be considered near the Current Market Price (2,537.7) for aggressive momentum follow-through, or ideally on a pullback and retest of the previous resistance-turned-support level near 2,400 for a stronger risk-to-reward ratio.
Target: Based on the depth of the previous consolidation box (approximately 350 points from 2,050 to 2,400), an initial technical target is projected around 2,750.
A secondary psychological target sits at the 3,000 mark.
Stop Loss: To manage downside risk, a stop loss could be placed just below the breakout candle's low at 2,218.3 for tighter risk management, or below the primary consolidation support near 2,050 to allow the trade more room to breathe.  Long
Long
Lock In Profits — Know When to Take Money Off the TableIn investing, making a profit is only half the equation . The harder part is knowing when to keep holding and when to protect what you’ve already gained.
A stock, Bitcoin, or Gold can rally strongly and make investors believe the trend will continue. But markets don’t rise forever. Valuations change, capital flows shift, and the narrative that once drove prices higher can weaken.
That’s why locking in profits in investing isn’t as simple as “price goes up, so sell.”
1. A Higher Price Isn’t the Only Reason to Take Profit
You buy an asset at $100 and it rises to $150.
A +50% gain may sound like a good reason to sell. But the more important question is:
What caused the asset to rise 50%?
If the long-term outlook is still improving, the fundamentals remain strong, and valuation hasn’t become excessive, selling simply because “I’ve made enough” could take you out of a major trend too early.
On the other hand, if price has risen much faster than underlying value or realistic expectations , the investment’s risk/reward may no longer be as attractive as it was when you entered.
Profit alone shouldn’t determine the sale. The thesis is what needs to be reassessed.
2. When the Thesis Changes, the Decision Should Change Too
Every investment should begin with a clear reason for owning it.
For stocks, that might be earnings growth, cash flow, or competitive advantage . For Gold, it could involve real yields, the USD, and safe-haven demand . For Bitcoin, investors may watch liquidity, adoption, and capital flows.
If the factors that originally supported the investment weaken significantly, continuing to hold simply because “I bought much lower” is no longer a thesis.
It’s just attachment to the position.
3. Taking Partial Profits Can Be Better Than an All-or-Nothing Decision
Investing doesn’t always require choosing between:
Sell everything or Hold everything.
When an asset rises sharply and becomes too large a percentage of your portfolio, an investor may choose to rebalance or take partial profits to bring the portfolio back toward the desired risk level.
You can maintain exposure if the long-term trend continues without allowing the success of one investment to make your entire portfolio overly dependent on it.
Sometimes taking profit doesn’t mean you’re bearish. It simply means you’re managing risk
4. The Most Important Question: “If I Didn’t Own It Today, Would I Still Buy It?”
This can be a useful way to reassess an investment that has already generated a significant profit.
Forget your entry price for a moment.
At the current price, current valuation, and current outlook , is the asset still attractive enough for you to put new capital into it?
If the answer has changed significantly, it may be time to reassess the portfolio as well.
Lock In Profits ≠ Sell Every Winner
Good investors don’t try to sell at the exact top of every market cycle. Doing that consistently is nearly impossible.
A more realistic goal is to give strong investments enough time to compound , while making sure large gains don’t cause you to ignore valuation, the original thesis, or portfolio risk.
Don’t sell just because you’re in profit. But don’t keep holding just because you’re in profit either.
Keep owning an asset while the reasons for owning it remain strong enough.
This article is for educational purposes only and does not constitute investment advice. Education 
 Long
Long
BTC Just Swept Liquidity — What Comes Next?• Trend: Bullish on the 1H chart
• Structure: Clear HH/HL progression after the 75.5K–76K low
• BOS: Bullish break above the previous 79K area
• CHoCH: Earlier momentum shift from bearish to bullish structure
• Momentum: Strong impulsive buying, supported by increased volume
• Price Action: BTC has aggressively pushed into the 81K resistance/liquidity zone
🔑 KEY LEVELS:
• Resistance / Liquidity: 81,000–81,100
• Major upside level: 82,000
• Near-term breakout/retest area: 80,000–80,400
• Demand / Order Block: 76,000–77,000
• Major previous low: ~75,500
• Liquidity: Recent highs around 81K have just been swept
🎯 TRADE SETUP — LONG ON CONFIRMATION:
Entry: 80,200–80,400 after a confirmed retest/hold
Stop Loss: 79,700
TP1: 81,000–81,100
TP2: 82,000
TP3: 82,000+ only after a confirmed breakout
Risk/Reward: Approximately 1:2+ depending on entry and execution
🚀 POSSIBLE NEXT MOVE:
🟢 Bullish scenario:
If BTC holds above the 80K breakout area and reclaims 81K with strong candle closes, continuation toward 82K becomes the next technical area.
🔴 Bearish scenario:
If price rejects 81K and loses 80K, the breakout could turn into a liquidity sweep. A deeper pullback toward the 78K–77K region would then become possible.
Confirmation: Watch for a clean retest, rejection, and bullish close above the breakout zone before considering continuation.
⚠️ INVALIDATION:
A sustained 1H close below 79.7K would invalidate this specific bullish continuation setup. Long 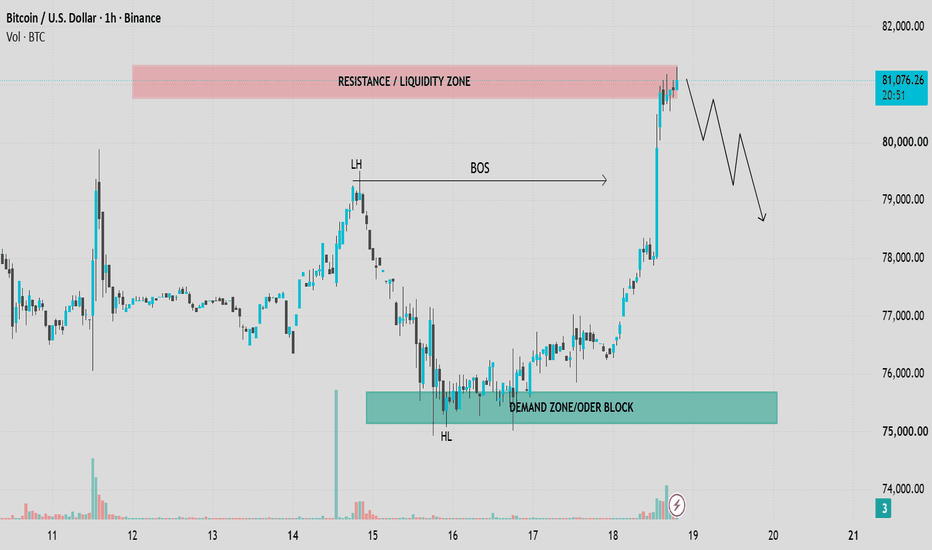
W.D. Gann Theory: Time Trading StrategyW.D. Gann’s approach was built around one simple idea: price and time should be studied together. Instead of asking only “Where could price react?”, Gann also asked “When could that reaction become important?”
1. Price Level
Start with a meaningful level: previous high or low, major support/resistance, or an important breakout area. A level by itself is not a trade, but it gives you a place to watch.
2. Time Window
Gann focused heavily on market cycles and timing. In practical trading, this can mean watching whether price reaches an important level during a period where volatility or structure is already changing.
The key idea is simple:
Price Level + Time Window = Higher-Quality Area to Watch
3. Wait for the Reaction
This is where many traders make the mistake. Gann theory should not mean predicting a reversal just because price and time line up.
I still want confirmation: rejection candles, a structure break, momentum shift, or a clean reclaim of the level.
A practical sequence is:
Key Level → Time Window → Price Reaction → Confirmation → Trade
How This Can Improve Trading
The benefit is not “knowing the future.” It is becoming more selective.
Instead of entering every support or resistance level, you wait for price, timing and confirmation to align. That can help reduce random trades, improve entry location and make invalidation clearer.
4. AURICVERSE Takeaway
Gann Theory becomes useful when it helps you stop treating every level the same.
''Price tells you where.
Time tells you when to pay attention.
Confirmation tells you whether to trade.'' Education 
EURUSD Daily Chart - Bullish A-B-C Correction,Trend Reversal1. Pattern:
This is a classic Elliott Wave A-B-C correction. You correctly marked A at the swing low (1.15500), B at the lower high (1.16900), and C at the final bottom (1.14365 - 1.14663). The price is now completing the C wave.2. Key Level:
The pink shaded zone around 1.14300 to 1.14700 is the strong demand zone. Price touched it and showed a long wick rejection. This is the same zone where price accumulated in July. Holding above this zone for 3 days means sellers are exhausted.3. Price Action Today:
Open: ∼1.14700, Low: 1.13900, Close: 1.14863 (+0.09%). The candle has a long lower wick and a strong bullish body. This is called a Bullish Rejection Candle. It means buyers stepped in aggressively at the C point.4. Channel Break:
The dashed descending channel from May to July is broken. Price was falling inside it, now it has broken out at C point and is moving up.5. Your Target:
You marked two targets on the right:1.17635 (immediate resistance)1.18297 (major dotted blue line resistance)
Your black arrow projecting up to 1.17635 is technically correct. That is 280+ pips from current C zone.6. Final Conclusion:
Trend change is confirmed on Daily timeframe. The downtrend is over, uptrend is starting from C point. This matches your NZDUSD and GBPUSD charts - all three USD pairs are bottoming together, indicating US Dollar weakness.
Setup:
Buy at C zone (1.14400-1.14800),
Stop Loss below 1.13900,
Target 1.17635 / 1.18297.