Nifty : Intraday Trading Plan: 22-Jul-2026
Welcome traders! 👋 Here is a detailed, professional trading plan for Nifty 50 for the upcoming session. We will analyze the chart structure to define our strategy for every possible opening scenario.
🎨 Chart Legend & Color Code
🟠 Orange Line/Box: No Trade Zone / Sideways Market / Caution Area.
🟢 Green Line/Box: Bullish Zone / Support / Long Side.
🔴 Red Line: Bearish Zone / Resistance / Short Side.
⚪ Dashed Line: Probable Trend (Maybe/Maybe Not) – Wait for confirmation!
📈 Overall Nifty Trend (Intraday)
Looking at the chart, Nifty is currently trading at 24,193.95. The market is in a consolidation phase after recent volatility.
Immediate Bias: Neutral to Slightly Bullish.
Key Observation: The price is sandwiched between the Opening Support (24,146) and Opening Resistance (24,230-24,251).
The "Green" Path: If buyers defend 24,146, we could see a solid move up towards 24,317 (Last Intraday Resistance) and potentially 24,375.
The "Red" Path: If sellers push price below 24,146, we might see a slide down to the 24,033-24,056 support zone.
🚀 Scenario 1: Gap Up Opening (100+ Points)
(Expected Open: ~24,295 - 24,300)
If the market gaps up by 100+ points, it will open very close to the Last Intraday Resistance (24,317) and well above the Opening Resistance Zone (24,230-24,251).
🔍 Analysis: A gap up of this magnitude often leads to profit booking. The price is entering the "Red Zone" (Resistance).
🟢 Bullish Action (Long): Do not chase the gap immediately. Wait for the price to sustain above 24,317 (Red Line). If a 15-min candle closes above this level, look for a move towards 24,375 (following the green dashed line).
🔴 Bearish Action (Short): If the price opens near 24,300 and shows rejection candles (Shooting Star, Bearish Engulfing) at 24,317, initiate a Short position. The target would be a gap fill down to 24,250.
🟠 No Trade: Avoid buying right at the open as the Risk:Reward ratio is poor near resistance.
⚖️ Scenario 2: Flat Opening
(Expected Open: ~24,180 - 24,210)
If the market opens flat, it opens right in the middle of the chart, between the Orange Line (24,146) and the Orange Box (24,230-24,251).
🔍 Analysis: This is the classic "Chop Zone". The market lacks direction initially.
🟠 No Trade Zone: The zone between 24,146 and 24,230 is your "Sideways" area. Trading here is dangerous for option buyers due to Theta decay.
🟢 Bullish Action (Long): Wait for a breakout above the Orange Box (24,251). Once confirmed, go Long with a target of 24,317.
🔴 Bearish Action (Short): Wait for a breakdown below the Orange Line (24,146). Once confirmed, go Short with a target of 24,056 (Green Box).
⚪ Dashed Line Logic: The red dashed line shows a potential drop from the resistance zone, while the green solid line shows a potential rise from support. Patience is key here!
📉 Scenario 3: Gap Down Opening (100+ Points)
(Expected Open: ~24,090 - 24,100)
If the market gaps down significantly, it opens below the Orange Line (24,146) and heads straight towards the Last Intraday Support (24,033-24,056).
🔍 Analysis: Panic selling might occur initially. The price is entering the "Green Box" (Strong Support).
🟢 Bullish Action (Long): Watch the 24,033-24,056 zone closely. If the price stabilizes here and forms a reversal pattern (like a Hammer), take a Long position for a bounce back to 24,146 (following the green dashed line up).
🔴 Bearish Action (Short): If the price crashes through 24,033 with high volume, the support has failed. Go Short (follow the trend down).
️ Caution: Gap downs often see a "Dead Cat Bounce". Don't short right at the support line; wait for a breakdown.
🛡️ Risk Management Tips for Options Trading
Trading options requires strict discipline. Here are some golden rules:
Stop Loss is Mandatory: Never trade without a Stop Loss (SL). For options, a 10-15% premium SL or a spot level SL (as mentioned above) is crucial.
🔹 Position Sizing: Never risk more than 2-5% of your total capital on a single trade. If you have ₹1 Lakh, don't lose more than ₹2,000-₹5,000 on one setup.
🔹 Avoid the "Orange Zone": If the market is sideways (Flat opening scenario), option buyers will lose money due to time decay (Theta). Stay out or trade very small quantities.
🔹 Trail Your SL: Once you are in profit, move your Stop Loss to your entry price (Cost-to-Cost). Protect your capital first!
🔹 Don't Average Losers: If a trade goes against you, exit. Do not add more quantity to a losing position hoping for a recovery.
Summary & Conclusion
To summarize the plan for 22-Jul-2026:
Trend: The market is range-bound. Watch 24,146 (Support) and 24,230-24,251 (Resistance).
Gap Up: Watch for rejection at 24,317 (Short) or breakout (Long to 24,375).
Flat: Stay out of the 24,146 - 24,230 zone (Orange/No Trade). Trade the breakout/breakdown only.
Gap Down: Watch for support at 24,033-24,056 (Long for bounce).
Conclusion: The chart suggests a battle between bulls and bears in the 24,146 - 24,251 range. The Orange zones indicate areas of confusion—avoid trading there. Wait for the market to pick a direction (Green or Red lines) before committing your capital. The dashed lines remind us that anything is possible, so always wait for candle confirmation! 📈📉
⚠️ Disclaimer:
I am not a SEBI registered analyst. This post is for educational purposes only. Trading in the stock market and F&O involves high risk and can lead to capital loss. Please consult your financial advisor before taking any trades. The charts and levels are based on technical analysis and probabilities, not guarantees. 🙏  Long
Long
360 ONE WAM Ltd. (1W) – Technical AnalysisOverall Trend
The long-term trend remains bullish, as the stock has rallied significantly from the ₹400–500 zone to above ₹1,300. However, after this strong advance, the stock has entered a multi-month consolidation phase.
Chart Pattern
The price is trading inside a symmetrical triangle, characterized by:
Lower highs, indicating sellers are gradually pushing prices down.
Higher lows, showing buyers continue to accumulate at higher levels.
Declining price swings, suggesting volatility is contracting before a potential expansion.
This pattern reflects indecision between buyers and sellers and often precedes a strong directional move.
Current Price Action
Current Price: ₹1,113.70
The stock is trading near the middle of the triangle, where the risk-to-reward is generally less favorable.
Neither buyers nor sellers currently have a decisive advantage.
Key Resistance
Upper trendline: Approximately ₹1,170–1,200
A weekly close above this zone would indicate increasing bullish momentum.
Key Support
Lower trendline: Approximately ₹980–1,020
Holding above this support keeps the consolidation structure intact.
Bullish Scenario
A convincing weekly breakout above the upper trendline, supported by strong volume, could confirm the continuation of the primary uptrend.
Potential upside targets:
₹1,300
₹1,400
₹1,500+ if momentum remains strong.
Bearish Scenario
If the stock breaks below the lower trendline with a strong weekly close, it would invalidate the triangle pattern.
Possible downside targets:
₹900
₹850
₹780 in an extended correction.
Volume Observation
Volume confirmation is crucial.
High volume breakout increases the probability of a sustained move.
Low volume breakout carries a higher risk of becoming a false breakout.
Trading Strategy
Aggressive traders: Wait for a confirmed breakout above the upper trendline before initiating fresh long positions.
Conservative investors: Wait for both a breakout and a successful retest of the broken trendline before entering.
Avoid taking large positions while the stock remains inside the triangle, as false moves are common during consolidation.
Technical Outlook
Bias: Neutral to Bullish
The long-term structure remains positive, but the stock is currently in a consolidation phase. The next major trend will likely be determined by a decisive breakout from the symmetrical triangle. Until then, patience is preferable to anticipating the direction.  Long
Long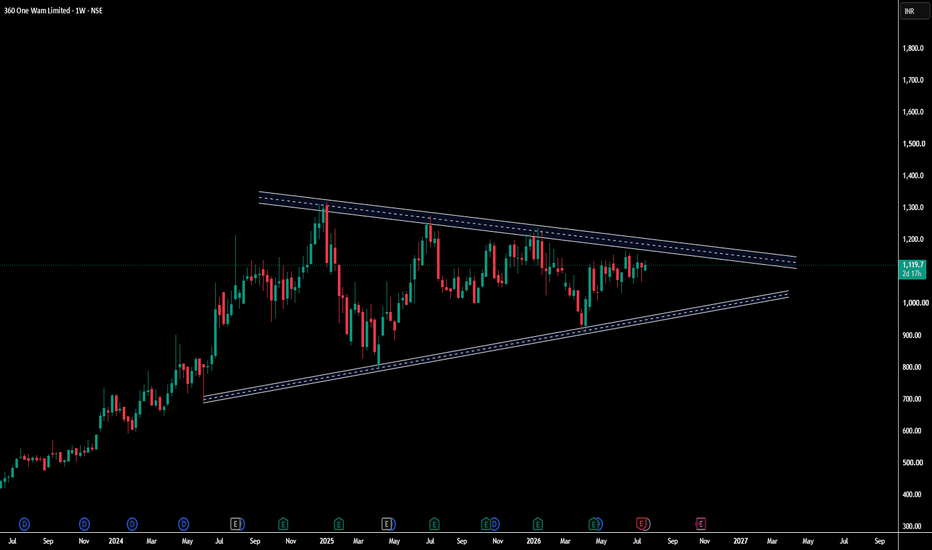
BRIAN XAUUSD – GOLD REBOUNDS, BUT THE REAL TEST IS ABOVE BRIAN XAUUSD – GOLD REBOUNDS, BUT THE REAL TEST IS ABOVE
Gold is recovering from last week’s bottom area, but the market is still not in a clean bullish structure.
Price is moving inside a short-term rising channel after reacting from the lower value zone. The rebound looks controlled, but with US-Iran tension still active and the market pricing at least one Fed hike by year-end, gold may continue to face selling pressure at higher prices.
The chart is clear now: gold can still push higher, but the upper liquidity zone is where the real test begins.
Technical structure
On the H1 chart, gold has bounced from the lower base and is now trading around 4,060.
The POC Buy Reaction Zone around 4,005 - 4,012 remains the main support below current price. As long as gold holds above this area, the short-term rebound can continue.
However, the upper zone around 4,095 - 4,105 is marked as the main sell area. This is where sellers may defend again if price reaches higher liquidity.
The rising channel supports the recovery, but price is now getting closer to resistance. That means chasing buy too late becomes risky.
Important zones
POC Buy Reaction Zone: 4,005 - 4,012
Main value support and reaction base.
Buy scalping area: 4,055 - 4,065
Short-term reaction area inside the current rebound.
Careful selling zone: 4,081
First upper reaction level.
Sell gold here: 4,095 - 4,105
Main resistance and preferred sell-reaction zone.
Last week’s bottom: 3,959
Major downside reference if the recovery fails.
Trading scenario
Sell reaction from 4,095 - 4,105
Entry:
Look for sell positions only if price rallies into 4,095 - 4,105 and shows clear rejection.
Stop Loss:
Above the sell zone or above the local rejection high.
Take Profit:
TP1: 4,081
TP2: 4,055 - 4,065
TP3: 4,005 - 4,012
This setup is based on waiting for gold to move into upper liquidity first, then watching whether sellers defend that value zone.
Final view
Gold can continue the short-term rebound while it holds above the POC Buy Reaction Zone.
But the main structure is not fully bullish yet. The stronger decision area is above, around 4,095 - 4,105.
If gold reaches that zone and fails, sellers may take control again.
For now, I do not want to chase the middle. Let price reach liquidity. Then trade the reaction.
 Long
Long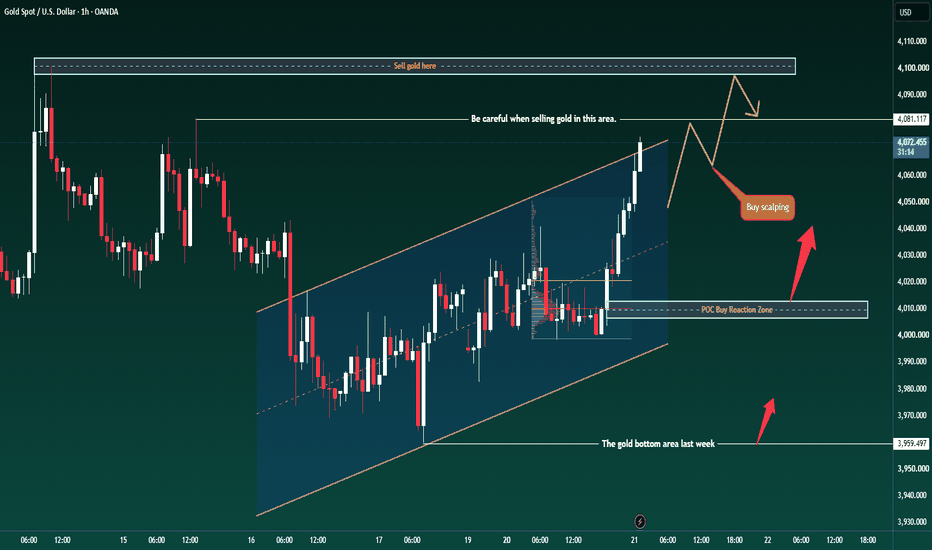
DXY: Ready for the Next Leg? Flagpole Pattern!!The U.S. Dollar Index appears to be forming a Bull Flag after a strong impulsive rally.
A healthy trend rarely moves in a straight line. Strong markets often pause, consolidate, and absorb profit booking before attempting the next move. That's exactly what DXY is doing at the moment.
The initial rally formed the flagpole, reflecting strong buying momentum. Since then, price has been correcting inside a downward-sloping channel, creating the flag. This type of consolidation usually indicates that sellers are unable to reverse the trend, while buyers gradually absorb supply.
What's encouraging is that the entire correction is taking place above the previous breakout zone near 100, suggesting that former resistance is now acting as support. This is a constructive sign from a market structure perspective.
A decisive breakout above the flag would indicate that the correction is complete and could trigger the next leg higher. Until then, the pattern remains under development, and patience is essential.
This isn't just a Forex chart.
The next move in DXY can influence Gold, Silver, Crude Oil, USDINR, emerging markets, FII flows, and global equity indices.
Rather than predicting the direction, I'm simply identifying a high-probability structure and waiting for the market to confirm it.
Sometimes the best trades begin with a simple continuation pattern.  Long
Long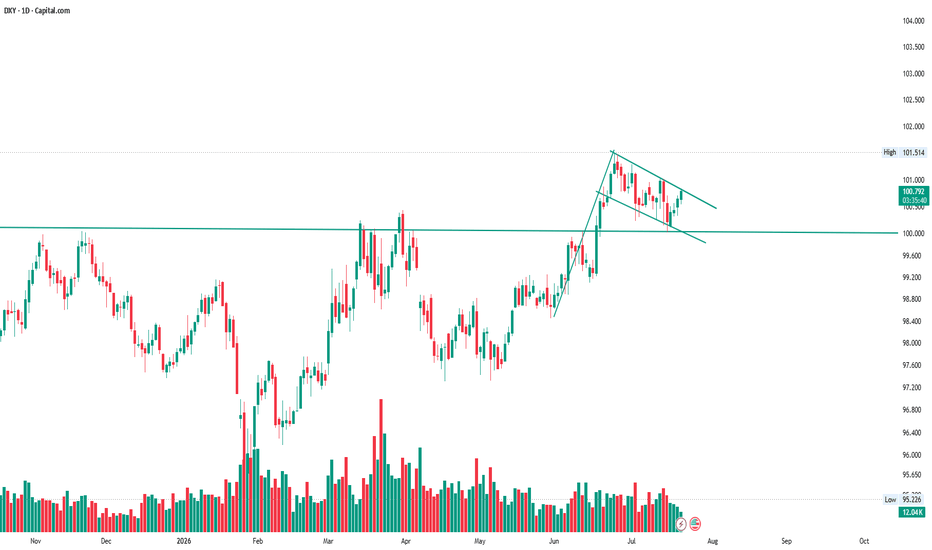
 Long
Long
 Long
Long



 Long
Long
XAUUSD Analysis: Bears Still Control Below This Key Trendline
Hello everyone, Gold continues to respect a well defined major descending resistance trendline, and the latest rejection once again highlights the importance of this technical level.
Every recent rally into this resistance has attracted selling pressure, creating a sequence of lower highs that keeps the broader short term structure bearish.
As long as price remains below this trendline, sellers continue to hold the technical advantage. A confirmed breakout would change the outlook, but until then, resistance deserves respect.
One area that stands out on the chart is the key liquidity pool below current price. Markets often revisit these zones before making their next meaningful move, making this an important level to monitor rather than predict.
If selling pressure continues, price could gradually rotate lower and test this liquidity area. However, if buyers manage to reclaim the descending resistance with strong confirmation, the bearish structure would begin to weaken.
Instead of chasing every move, I prefer waiting for price to react around high-probability technical zones where risk-to-reward is more favorable.
My focus remains simple:
Respect the trend.
Follow market structure.
Let price confirm the next move.
No predictions, just reacting to what the market is showing.
What do you think?
Will Gold sweep the liquidity below first, or break above the descending resistance before making its next major move? Share your view in the comments. 👇
Disclaimer
This analysis is shared for educational and informational purposes only and should not be considered financial or investment advice. Always conduct your own research and use proper risk management before making any trading decisions.
—@TraderRahulPal
SCA Registered Financial Influencer (Dubai, UAE)
Short 
Ethereum $10K Or $1K? This Zone Will Decide Everything.Ethereum $10K Or $1K? This Zone Will Decide Everything.
My technical outlook on CRYPTOCAP:ETH :
Ethereum is likely to extend its recovery toward the $2,160–$2,400 region. This is a major HTF Bearish Order Block + Fair Value Gap (FVG), making it the most important resistance zone on the chart.
Bullish scenario:
A confirmed HTF close above $2,400 would invalidate the current bearish structure and shift the HTF trend bullish, opening the door toward $7K–$10K.
Bearish scenario:
If ETH gets rejected from the $2,150–$2,400 zone, the probability of revisiting the $1,500–$1,000 range increases significantly. That would be a high-conviction long-term accumulation opportunity.
This is the decision zone. Don't predict the outcome, wait for confirmation and react accordingly. Always DYOR.  Long
Long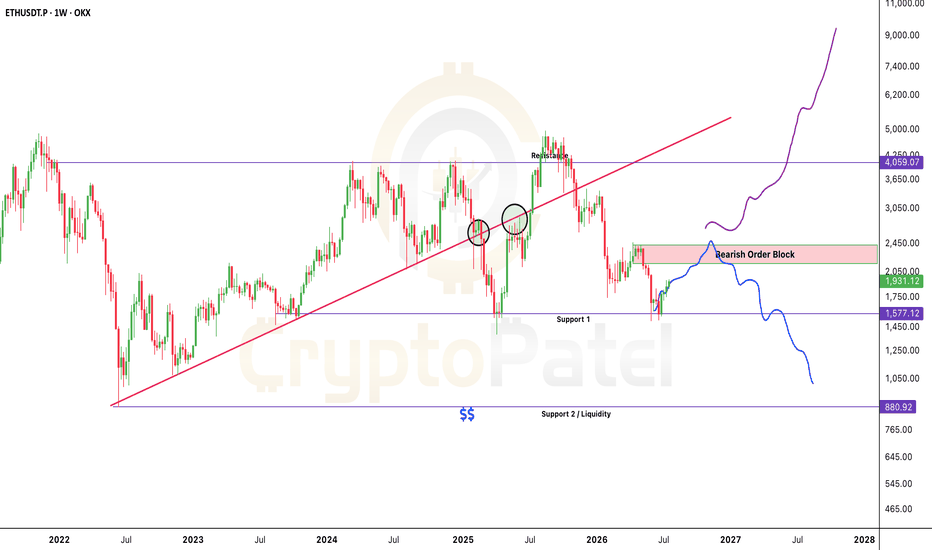
 Long
Long
Long