Gold Eyes 4,080 — Breakout or Bull Trap?> Yến:
Gold Eyes 4,080 — Breakout or Bull Trap?
Gold continues to recover after reclaiming its ascending channel, while the U.S. Dollar remains under pressure as traders price in the possibility of Fed rate cuts later this year. With Treasury yields stabilizing and risk sentiment improving, buyers are attempting to regain short-term control.
However, the market is now approaching an important institutional supply area where the next impulsive move could begin.
Market Structure
✅ Price has broken the previous bearish trendline.
✅ The ascending channel remains intact.
✅ Higher highs and higher lows continue to develop.
✅ Price is trading above immediate demand, confirming buyers remain in control.
From an SMC perspective, institutions appear to be repricing the market higher while targeting liquidity resting above previous highs.
Key Levels
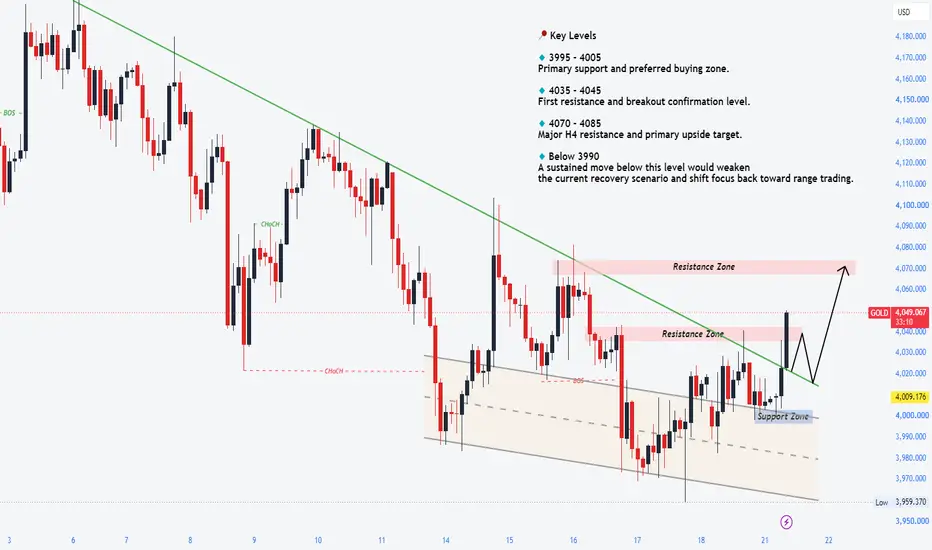
🟢 Immediate Demand (FVG): 4,000 – 4,005
First mitigation zone for buyers.
Intermediate Resistance: 4,028 – 4,032
Potential intraday reaction area.
🔴 Internal Relief Retest: 4,058 – 4,062
Important supply zone where profit-taking may appear.
🎯 Primary Buy-Side Liquidity Target: 4,080 – 4,085
Main upside objective if bullish momentum continues.
The breakout above the descending trendline suggests institutional buying interest has returned.
Rather than chasing price higher, Smart Money often allows price to revisit mitigation zones before driving toward the next Buy-Side Liquidity pool.
The current structure continues to favor buying while the ascending channel remains intact.
Will Gold sweep Buy-Side Liquidity above 4,080 first, or revisit demand before the next impulsive rally?
> Yến:
TradingView MIND
Gold Breaks Trendline—Is 4,080 the Next Liquidity Target? 🚀
Gold has reclaimed its bullish channel after breaking the descending trendline, while a softer USD continues to support precious metals.
From an SMC perspective, buyers remain in control as long as price holds above 4,000–4,005 demand. The next key obstacle sits at 4,060, where Smart Money could engineer a short-term pullback before continuing higher.
If bulls maintain momentum, the market may target the 4,080–4,085 Buy-Side Liquidity zone.
📌 Bias: Bullish
🟢 Buy Zone: 4,000–4,005
🔴 Resistance: 4,060–4,062
🎯 Target: 4,080–4,085
Do you expect Gold to break straight into buy-side liquidity, or will Smart Money retest demand first?
 Long
Long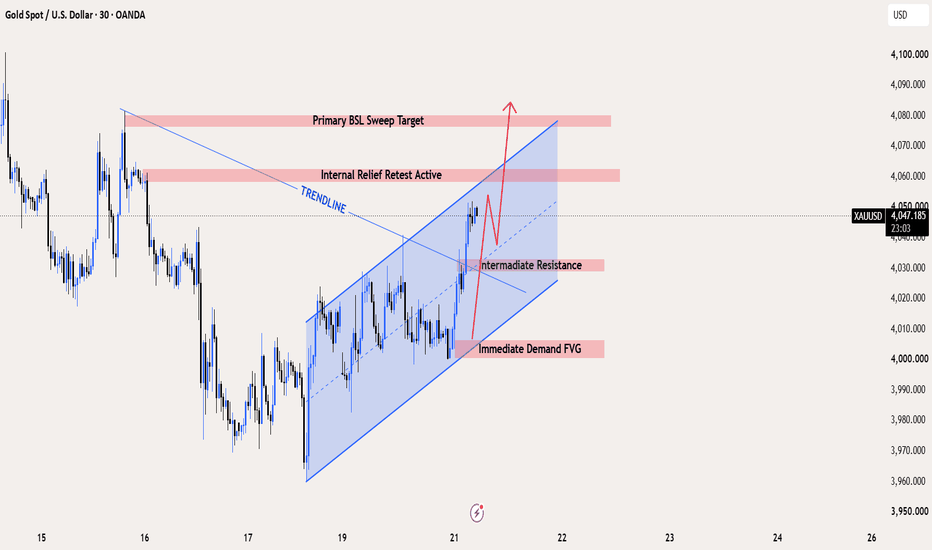
XAUUSD [1H]: Bearish Rejection at Supply Zone & Trendline ?🔍 Market Structure & Technical Breakdown
Overall Bias: Bearish. The asset experienced a clear Change of Character (CHOCH) at the top left, followed by a sustained Break of Structure (BOS) to the downside.
The Correction: Price temporarily rallied out of a Downward Channel via a Market Structure Shift (MSS), but failed to sustain higher prices, putting the broader bearish momentum back in control.
Confluence Zone: We are currently looking at a high-probability Short Setup forming around the $4,020 - $4,040 region. This setup is heavily reinforced by a strong confluence of factors:
Descending Trendline: Price is reacting directly underneath a well-respected, multi-touch bearish trendline.
Supply Zone: The blue horizontal box represents a key historical order block/supply zone where sellers have previously stepped in aggressively.
📉 Trading Setup (Short Opportunity)
Execution Area: Sell limit or price action rejection within the blue Supply Zone ($4,020 - $4,035), aligned with the descending trendline touch.
Invalidation/Stop Loss: A clean daily close or sustained hourly candle body closing above the trendline and supply zone (above $4,045).
Take Profit (Target): The recent local swing low liquidity pool at $3,965. Short 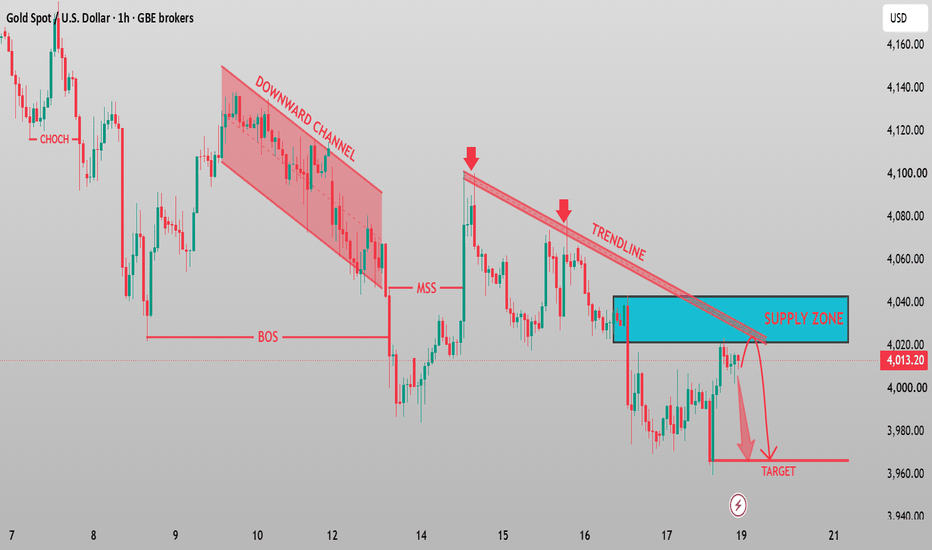
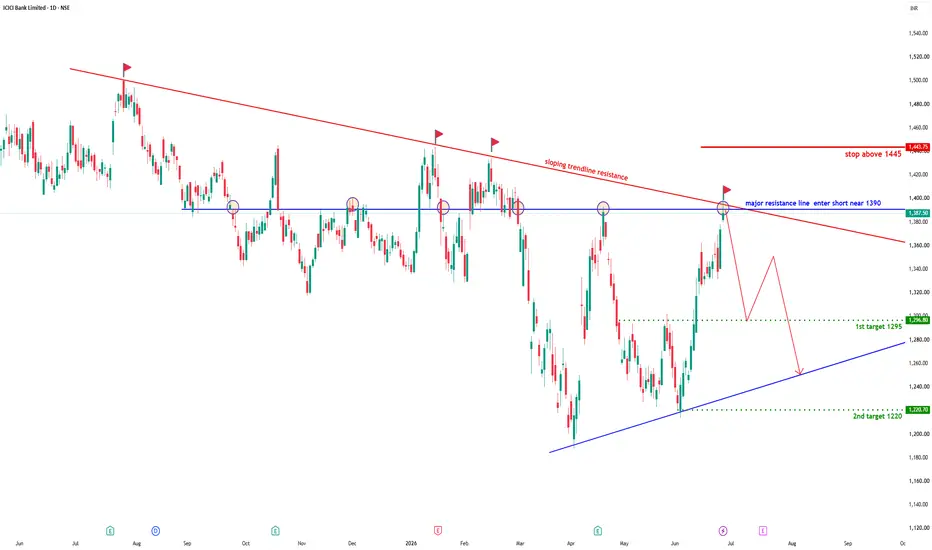
ICICI Bank – Short setup | Major Resistance + Falling TrendlineICICI Bank – High Probability Short Setup | Major Resistance + Falling Trendline Confluence
Analysis
ICICI Bank has rallied strongly from its recent swing low and is now approaching a significant resistance zone around ₹1390, where two major technical barriers converge:
Horizontal resistance that has acted as a strong supply zone multiple times over the past several months.
Long-term descending trendline resistance connecting the major swing highs.
This confluence creates a high-probability area where sellers may regain control.
Historically, every test of this resistance zone has resulted in sharp pullbacks, making this level worth monitoring closely for bearish confirmation.
Trade Setup
Entry
Consider short positions near ₹1390
Prefer waiting for bearish confirmation such as:
Bearish engulfing candle
Shooting star
Evening star
Strong rejection wick
Lower timeframe breakdown after rejection
Avoid entering before confirmation, as resistance levels can briefly break before reversing.
Stop Loss
Stop Above ₹1445
A sustained close above this level would invalidate the bearish setup by confirming a breakout above both the horizontal resistance and the descending trendline.
Risk management is essential.
Targets
Target 1
₹1295
This is the first significant support where partial profit booking can be considered.
Target 2
₹1220
If selling pressure continues, price may revisit the rising trendline support around ₹1220, making it the second downside objective.
Why This Setup?
This trade is based on multiple technical factors aligning together:
✔ Long-term descending trendline resistance
✔ Multi-month horizontal resistance
✔ Previous rejection history at the same price zone
✔ Strong recovery rally into resistance
✔ Favorable Risk-to-Reward ratio if rejection occurs
When multiple resistance levels overlap, the probability of institutional selling often increases.
What to Watch
A clean rejection from ₹1390 with increasing selling volume would strengthen the bearish case.
However, if price closes decisively above ₹1445, the setup becomes invalid and short positions should be avoided.
Risk Management
Never risk more than 1–2% of your trading capital on a single trade.
Wait for confirmation instead of anticipating the reversal.
Trail your stop once Target 1 is achieved.
Book partial profits at intermediate support levels if volatility increases.
Conclusion
The ₹1390 zone represents one of the strongest resistance areas on the ICICI Bank daily chart due to the confluence of a long-term descending trendline and repeated horizontal resistance. A confirmed rejection from this level offers an attractive short-selling opportunity with downside targets at ₹1295 and ₹1220, while maintaining a clearly defined invalidation above ₹1445.
Disclaimer: This analysis is shared for educational purposes only and should not be considered financial or investment advice. Always perform your own research and use proper risk management before taking any trade.  Short
Short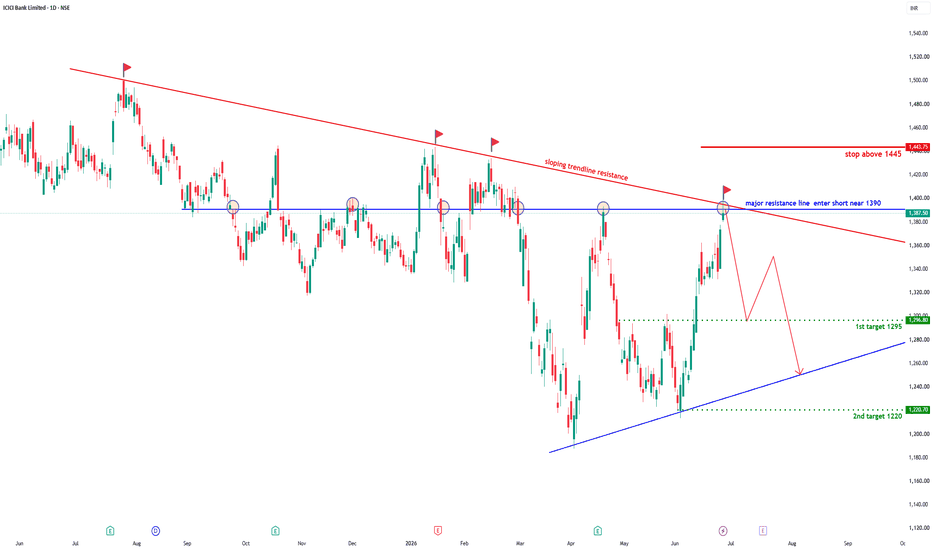
BRIAN XAUUSD – GOLD BEARISH, LOW VALUE AREABRIAN XAUUSD – GOLD IS WEAK, BUT THE LOW VALUE AREA IS NOW THE TRAP ZONE
Gold starts the week struggling around the 4,000 area after recording its biggest weekly decline in six weeks. The broader pressure is still clear: USD demand remains supported by safe-haven flows as the US-Iran conflict extends, while the daily technical setup still leans bearish.
But this is exactly where traders need to slow down.
Gold is weak, yes.
But selling directly into low value is not the same as selling from resistance.
Volume Profile structure
On the H1 chart, price is now trading above the Buy Reaction Base around 4,000 - 4,005 after reacting from the lower buy zone near 3,982.
This area is important because it represents the lower value base of the current profile. If buyers can defend this zone, gold may rotate higher towards the first upper value target.
However, the upside is still limited unless price can reclaim higher liquidity zones with real acceptance. The broader structure remains defensive, so any buy setup here should be treated as a reaction trade, not a full bullish reversal.
Important zones
Buy zone: 3,982
Lower value support and deepest reaction area.
Buy Reaction Base: 4,000 - 4,005
Current decision zone where buyers are trying to defend value.
Bullish Target Zone: 4,075 - 4,080
First major upside target if the rebound continues.
Upper Liquidity Zone: 4,100 - 4,105
Higher resistance where sellers may return strongly.
Trading scenario
Buy reaction from Buy Reaction Base 4,000 - 4,005
Entry:
Look for buy positions only if price holds above 4,000 - 4,005 and shows clear bullish rejection.
Stop Loss:
Below the Buy Reaction Base or below the 3,982 sweep low.
Take Profit:
TP1: 4,035
TP2: 4,075 - 4,080
TP3: 4,100 - 4,105 only if buyers reclaim value with strength
This setup is based on a Volume Profile reaction from low value. It is not a trend reversal setup. It is a controlled rebound trade from a key value base.
Final view
Gold remains vulnerable while the daily structure stays bearish and USD strength remains supported.
But on the intraday chart, price is now sitting near an important lower value area. If buyers defend 4,000 - 4,005, gold can rebound towards 4,075 - 4,080.
If 3,982 breaks cleanly, the bounce fails and sellers regain control.
The real question this week is simple:
Is gold building a reaction from low value, or is this just another pause before the next breakdown? Short 
Short 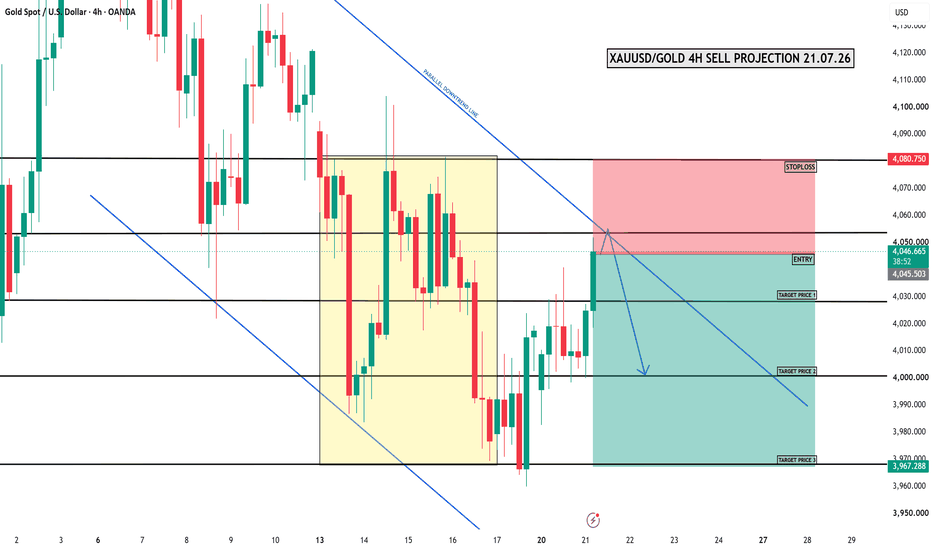
SKYGOLD: Multi-Timeframe Breakout & Strong Momentum ContinuationOverview :
Sky Gold and Diamonds Limited (NSE: SKYGOLD) is exhibiting an exceptionally strong bullish structure on the daily (1D) and weekly timeframes, currently trading near the ₹665.45 level. The price action reflects a robust multi-year price discovery phase, driven by aggressive volume expansion and exceptional top-line and bottom-line growth.
Trend Direction (Moving Averages) :
EMA Alignment : The stock shows a clean, textbook bullish alignment across the short-term and medium-term horizons. The 20 EMA, 50 EMA, and 200 EMA are stacked in correct bullish order with a steep upward slope, confirming strong macro and micro trend continuation without structural interference.
Momentum & Oscillators (RSI, MACD, FIB) :
RSI (Relative Strength Index): The daily and weekly RSI indicators are hovering in the 75–78 range. While this signals strong buyer momentum and decisive trend strength, it also indicates that the asset is in a near-term overbought state, meaning traders should watch for potential minor consolidations or shallow pullbacks.
MACD : The MACD histogram continues to expand in positive territory with a clean bullish crossover, indicating increasing buying pressure.
Fibonacci & Price Discovery : Having cleared all major historical resistance levels and Fibonacci extensions cleanly, the stock is currently trading in a "no-resistance" zone of price discovery.
Key Levels to Watch :
Immediate Support : The primary ascending trendline and breakout zone located around ₹591.92 (-10.9% from current levels). A healthy pullback to test this region would act as a major accumulation point.
Resistance : There are no immediate structural overhead resistance levels within 10% of the current price due to the ongoing price discovery phase.
Directional Bias: STRONG BUY (Hold / Buy on Dips)
The convergence of multi-timeframe bullish alignment, stellar fundamental growth (revenue up over 77% YoY), and clean technical breakouts places the bias firmly in the "Strong Buy" camp.
For New Entries : Chasing aggressively at current overbought levels carries short-term risk; waiting for a constructive retest or flag consolidation near the ₹590–₹600 structural support offers a superior risk-to-reward ratio.
For Existing Positions : HOLD. Trail stop-losses below the ₹591.92 trendline support to protect accumulated gains while riding the macro trend.
Disclaimer: This analysis is for educational purposes only and does not constitute financial advice. Always perform your own research and manage your risk/position sizing accordingly.  Long
Long
XAUUSD: Breakout or Just Another Trap? XAUUSD: Breakout or Just Another Trap?
Market Context
Gold is trading around 4,024 after struggling near 4,000. The market is recovering from a recent decline, while the USD remains strong due to safe-haven demand and ongoing US-Iran tensions.
Although gold has broken out of a short-term downtrend, the overall structure is not fully bullish. A strong USD and Fed uncertainty may still limit upside.
Key point: buyers must hold the reclaim support zone for this breakout to stay valid.
Technical Structure
Gold has broken the descending channel with CHOCH and BOS signals, showing improving momentum.
Key support is 3,985 - 4,010. Holding this zone could push price toward 4,060 - 4,080.
If this support fails, price may drop back to 3,960 - 3,980.
The 4,060 - 4,080 zone is the first major resistance and reaction area.
Key Levels
Current Price: 4,024
Support: 3,985 - 4,010
Demand: 3,960 - 3,980
Target: 4,060 - 4,080
Resistance: 4,100 - 4,105
Bullish Above: 4,080
Bearish Below: 3,985
Trading Plan
Buy Scenario
Entry: 3,985 - 4,010
SL: Below 3,960
TP: 4,040 / 4,060 / 4,080
Buy Breakout
Entry: Above 4,080
SL: Below 4,040
TP: 4,100 / 4,120 / 4,140
Sell Scenario
Entry: 4,060 - 4,080
SL: Above 4,105
TP: 4,024 / 4,010 / 3,985
Breakdown Sell
Entry: Below 3,985
SL: Above 4,010
TP: 3,960 / 3,940 / 3,920
Overall Bias
Gold shows short-term recovery but remains fragile.
Holding above 3,985 - 4,010 keeps bullish potential toward 4,060 - 4,080. Losing this zone shifts control back to sellers.
Best approach: wait for confirmation at support or resistance. Avoid chasing below 4,080.
Will this breakout hold, or turn into another trap?
Long 
XAUUSD: Buyers Push, But Sellers Wait at 4,060 XAUUSD: Buyers Push, But Sellers Wait at 4,060
Market Context
Gold is recovering inside a short-term upward channel after reacting from the lower zone near the weekly bottom. Buyers are showing strength, but the market is not completely free yet.
Macro sentiment remains sensitive. US-Iran tensions can keep safe-haven flows active, while Fed expectations are still important for USD direction. Even if traders see a lower chance of an immediate Fed hike, the idea of a restrictive Fed later this year can still limit gold’s upside.
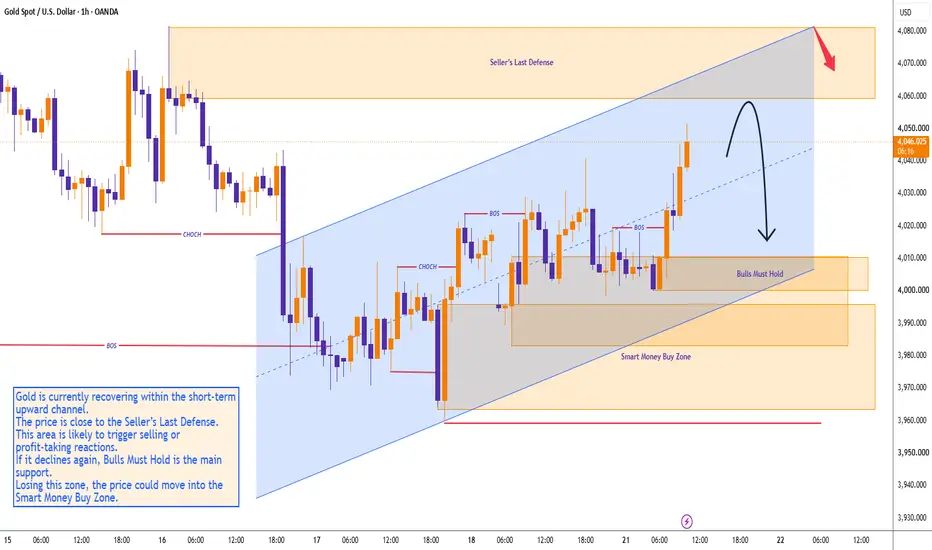
Key point: gold is bouncing, but the next test is the Seller’s Last Defense zone.
Technical Structure
Gold is trading around 4,044 after a strong rebound from the Smart Money Buy Zone. Price is moving inside a short-term bullish channel, supported by recent CHOCH and BOS signals.
The nearest resistance is 4,060 - 4,080. This is the Seller’s Last Defense area. If price reaches this zone and rejects, profit-taking or fresh selling pressure may appear.
The main support below is 4,000 - 4,010. This is the Bulls Must Hold zone. As long as price holds above this area, the recovery structure remains valid.
If 4,000 - 4,010 breaks, gold may return toward the Smart Money Buy Zone around 3,960 - 3,990.
Key Levels
Current Price: 4,044
Seller’s Last Defense: 4,060 - 4,080
Bulls Must Hold: 4,000 - 4,010
Smart Money Buy Zone: 3,960 - 3,990
Channel Resistance: 4,060 - 4,080
Bullish Confirmation: Above 4,080
Bearish Risk: Below 4,000
Trading Plan
Buy Scenario
Entry: 4,000 - 4,010
SL: Below 3,960
TP: 4,044 / 4,060 / 4,080
Condition: Price must pull back into the Bulls Must Hold zone and show bullish confirmation. Buyers need to defend the lower channel and keep forming higher lows.
Buy Breakout
Entry: Above 4,080
SL: Below 4,044
TP: 4,100 / 4,120 / 4,140
Condition: Price must break above the Seller’s Last Defense zone with strength, retest successfully, and hold above 4,080. Avoid chasing the first breakout candle without confirmation.
Sell Scenario
Entry: 4,060 - 4,080
SL: Above 4,100
TP: 4,044 / 4,010 / 4,000
Condition: Price reaches the Seller’s Last Defense zone and gets rejected. Bearish reaction from this area could trigger a pullback toward the main support zone.
Breakdown Sell
Entry: Below 4,000
SL: Above 4,025
TP: 3,990 / 3,960 / 3,940
Condition: Bulls Must Hold fails, retest is rejected, and bearish momentum continues. This would confirm that the recovery channel is weakening.
Overall Bias
Gold is recovering, but the market is now approaching an important resistance area. The short-term structure remains constructive while price holds above 4,000 - 4,010.
The key decision zone is 4,060 - 4,080. A breakout above this area can extend the recovery. A rejection may send gold back toward 4,010 or even 3,960 - 3,990.
Best approach: do not chase price into resistance. Wait for a clean reaction at 4,060 - 4,080 or a pullback into the Bulls Must Hold zone.
Will buyers break 4,080, or will sellers defend this zone and push gold back into support?
Short 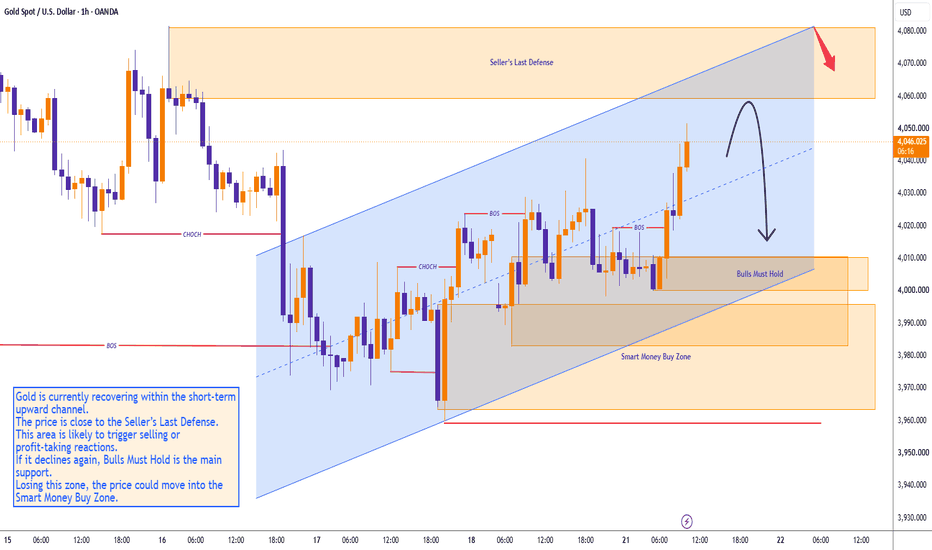
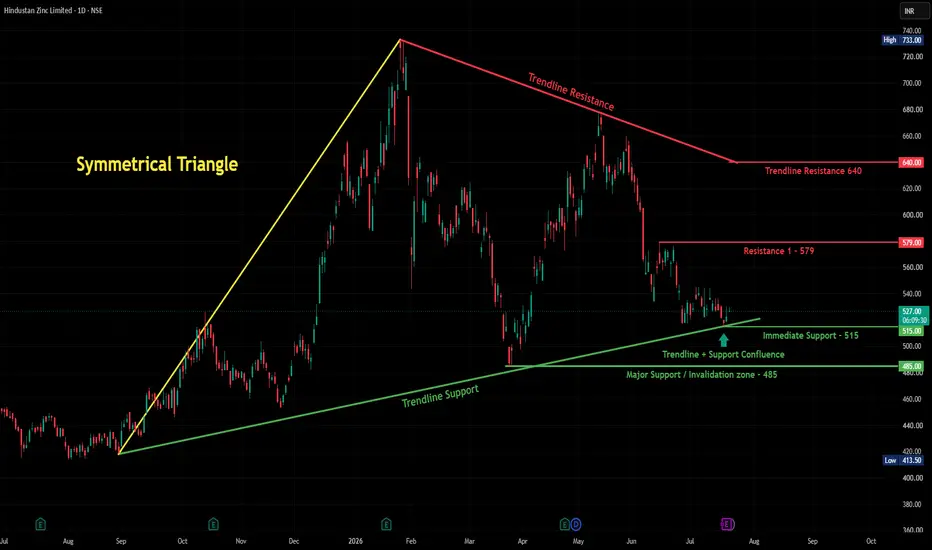
Hindustan Zinc - Squeezed Between Trendline Support & ResistanceOverview
Hindustan Zinc is trading in a tightening zone right now — a rising trendline support from below is meeting resistance levels from above, and price is currently sitting right at the middle of this squeeze around 527.
What's Happening
The stock had a big rally from around 420 last year up to a high of 733, then pulled back hard. Since then, it's been finding support along a rising trendline (currently near 500-515), while facing resistance from a falling trendline coming down from the highs (currently around 640).
Right now, price is sitting just above the Immediate Support at 515, and just below Resistance 1 at 579. It's a fairly tight range at the moment — not too far from either boundary.
Key Levels to Watch
Immediate Support: 515
Major Support / Invalidation Zone: 485
Resistance 1: 579
Bigger Trendline Resistance: 640
Two Ways This Can Go
If support holds: A bounce from here, especially with a strong green candle, would be a good sign. First target to watch would be Resistance 1 at 579, and beyond that, the bigger trendline resistance near 640.
If support breaks: A close below 515, and especially below the Major Support/Invalidation zone at 485, would mean sellers are in control, and the broader uptrend structure (from the rising trendline) would be in question.
Beginner's Lesson
When a rising support trendline and a falling resistance trendline start meeting each other, price gets squeezed into a smaller range — like a spring being compressed. This usually means a bigger move is coming eventually, though it's hard to know which direction until price actually breaks one side clearly. That's why we wait for confirmation rather than guessing early.
Conclusion
Hindustan Zinc is at an interesting squeeze point between support and resistance. As always, we're watching for a clear break either way rather than assuming a direction. We'll update once this resolves.
For educational purposes only. Not financial advice. Always manage your risk. Long 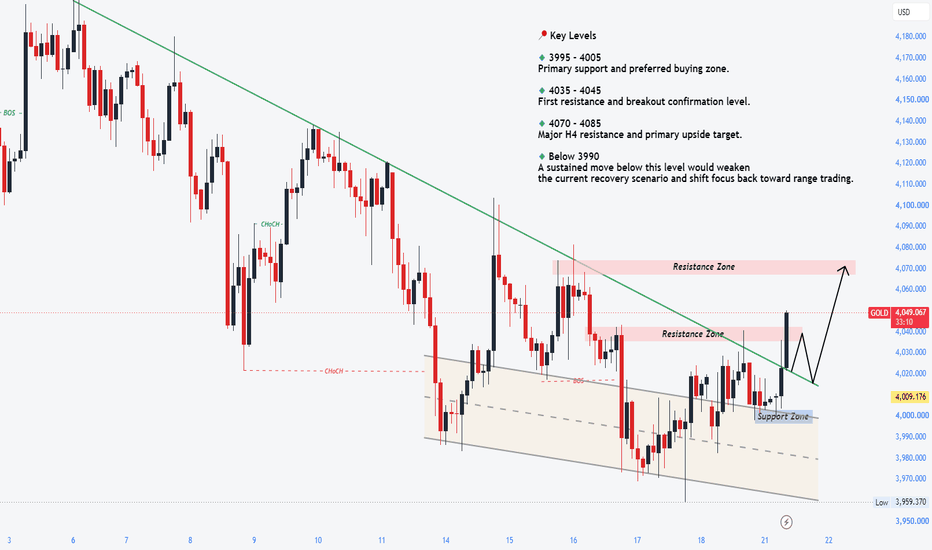
NIFTY: 24,200 Is the Battlefield. 24,250 Decides the Next Move.NIFTY: 24,200 Is the Battlefield. 24,250 Decides the Next Move.
I'm entering today's session with one level in mind—24,200.
On the daily chart, NIFTY is trading comfortably above the 20 SMA (24,106), 50 SMA (23,830) and 100 SMA (23,925), which keeps the broader trend constructive. However, the index is still below the 200 SMA (24,813), meaning the long-term trend has not turned bullish yet.
The daily pivot stands at 24,213.
- R1: 24,291
- R2: 24,344
- R3: 24,421
- S1: 24,161
- S2: 24,083
- S3: 24,031
Technically, the indicators are sending mixed signals:
- RSI (14): 55.58 – Positive but not overbought.
- MACD: -1.33 – Still bearish, showing momentum hasn't fully shifted.
- ADX: 10.19 – Weak trend, suggesting range-bound moves can continue until a breakout.
The option data also supports a balanced market. PCR for the current expiry is 1.38, indicating Put writers continue to dominate. However, a high PCR alone is not enough—it needs price confirmation.
On the 3-minute chart, buyers continue to defend higher lows, but the market is repeatedly stalling around 24,240–24,250. This makes 24,250 the immediate breakout level.
My trading plan is straightforward:
- Above 24,250: I expect momentum to improve, with room toward 24,291, 24,344, and potentially 24,421.
- Below 24,200: The intraday structure weakens. A sustained break below 24,200 could invite aggressive selling toward 24,160 and 24,080, where the next support zones lie.
📚 Trading Lesson
A market doesn't become bullish because indicators are green.
It becomes bullish when it starts holding above important price levels.
Today, 24,200 is support. 24,250 is confirmation. Until one of these levels decisively breaks, expect the market to respect this range more than predictions. Nifty Intraday Outlook for 21-07-2026NIFTY 15 Min Chart Reading
Overall Bias: 🟠 Neutral to Mildly Bearish (until key resistance is reclaimed)
Current Market Drivers
Rising crude oil prices and renewed Middle East geopolitical tensions are weighing on sentiment.
GIFT Nifty indicated a weaker start, while recent FII selling continues to pressure the market despite DII support.
Q1 earnings season is likely to increase stock-specific volatility rather than broad index strength.
NIFTY is trading near 24,239, holding above short-term support but still below immediate resistance.
The chart is showing sideways consolidation after recovery. Bulls need a clean breakout above 24,270 for fresh upside momentum.
__________________________________
Key Levels
Resistance: 24,270
Target 1: 24,360
Target 2: 24,470
Support: 24,230
Lower Target 1: 24,140
Lower Target 2: 24,050
__________________________________
Trade Plan
Bullish above 24,270
Targets: 24,320 / 24,360 / 24,470
Buy-on-dip near 24,230–24,200
Only if bullish rejection appears.
Bearish below 24,220
Targets: 24,180 / 24,141 / 24,049
__________________________________
View
NIFTY is not fully bullish yet.
Above 24,270 → buyers active
Below 24,220 → sellers active
Inside range → wait patiently
__________________________________
Educational view only. Trade with strict risk management. #NIFTY Intraday Support and Resistance Levels - 21/07/2026Nifty is expected to witness a flat opening with no major overnight triggers. The index is consolidating near the 24200–24250 support zone after the recent recovery, indicating that traders should wait for confirmation before taking fresh positions.
If Nifty sustains above 24250–24300 after the opening, traders can consider long positions with upside targets of 24350, 24400, and 24450. A decisive breakout above 24450 will confirm fresh bullish momentum and can extend the rally further.
On the downside, if Nifty fails to hold 24200 and slips below this support, traders can consider short positions with downside targets of 24150, 24100, and 24050. A sustained move below 24050 will strengthen the bearish bias and may lead to further selling pressure.
Overall, a flat opening is expected with range-bound trading likely during the initial session. As long as Nifty holds above the 24200–24250 support zone, buying on dips remains the preferred strategy. Traders should wait for confirmation near the opening range and maintain strict stop-losses while booking profits gradually at the mentioned target levels.  Long
Long
#BANKNIFTY Intraday PE & CE Levels(21/07/2026)Bank Nifty is expected to witness a flat opening with no major overnight cues. The index is consolidating near the 57950–58050 zone after Friday's sharp rally, indicating a wait-and-watch approach before the next directional move. Traders should wait for confirmation around key support and resistance levels before initiating fresh positions.
If Bank Nifty sustains above 57550–57600 after the opening, traders can consider buying CE options with upside targets of 57750, 57850, and 57950. A decisive breakout above 58050 will confirm fresh bullish momentum and can extend the rally towards 58250, 58350, and 58450+.
On the downside, if Bank Nifty fails to hold the 57950–57900 resistance zone and shows rejection, traders can consider buying PE options with downside targets of 57750, 57650, and 57550. A breakdown below 57450 will further strengthen the bearish momentum and can drag the index towards 57250, 57150, and 57050.
Overall, a flat opening is expected with stock-specific action likely to dominate during the initial session. As long as Bank Nifty trades above the 57550–57600 support zone, buying on dips remains the preferred strategy. Traders should wait for confirmation near the opening range and maintain strict stop-losses while booking profits gradually at the mentioned target levels.  Long
Long
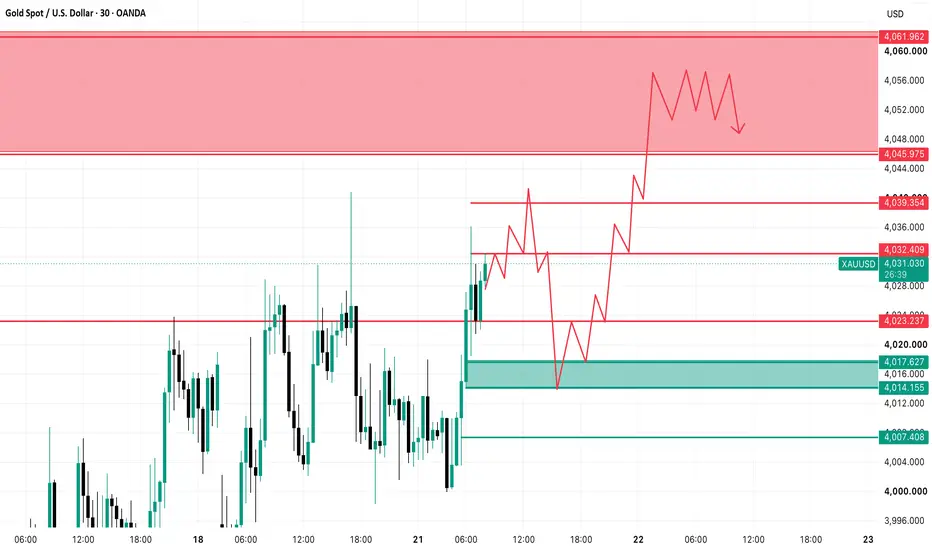
READ THIS BEFORE YOU BUY OR SELL GOLD TODAY!> ⚠️ I believe 90% of Gold traders are about to make the same mistake today. The chart looks obvious, the trend looks clear, and that's exactly why I think the market is preparing a psychological trap. Before you buy or sell Gold, spend the next few minutes reading this analysis carefully. If my theory plays out, today's move won't just trap early sellers—it could completely confuse both buyers and sellers before the real trend resumes.
As per my Monday analysis, the exact plan of action we were expecting is what the market delivered. The structure I had drawn played out almost perfectly, and the upside movement I expected from the $3981 level happened as anticipated. I hope everyone had a great trading day yesterday.
Now let's talk about the plan for Tuesday. Make sure you read this psychological analysis carefully because it will not only help you understand what could happen next in Gold but also improve your overall market psychology and learning.
Gold has now formed a potential lower high around $4040. However, the most important question is whether this is a genuine lower high or simply another psychological trap. Let's break it down.
The bullish Monday that we expected played out mainly because of the 4H timeframe structure, which I discussed in my weekly analysis. Since 6th July, Gold has been following a very clean bearish market structure. If you look at the 4H chart, you can clearly see a sequence of lower highs and lower lows. So far, this structure remains completely intact. There has been no break of structure and no obvious bullish trap yet.
Because of this, most price action traders have naturally started selling after seeing the latest lower high. They are expecting the bearish trend to continue, which is a logical conclusion based on the current structure.
However, I believe the market will trap these sellers before continuing lower. Instead of dropping immediately, I think Gold will first create confusion among price action traders by giving the appearance of a bullish break of structure. This move would attract fresh buyers while forcing early sellers out of their positions. Once enough liquidity has been created, I expect Gold to resume its bearish trend with a sharp downside move.
So my plan is very simple. I want to see Monday's high get broken. I want the market to break above the most recent lower high within the bearish structure. That breakout would deliver the first shock to sellers while attracting aggressive buyers. After that, I expect some consolidation before a strong bearish decline, most likely during the later part of the US session or around the Asian session open tomorrow.
The overall trend is still bearish. There is absolutely no doubt about that. The only thing I am expecting before the next leg down is a psychological trap that forces confident sellers out of the market before the trend continues.
Now let's discuss my exact plan for Tuesday.
Monday's high was around $4040, and after today's Asian session opened, Gold faced resistance near $4036 before attempting a small pullback. In my opinion, this was simply the market's first attempt to invite more sellers during the Asian session. The structure still looks bearish, so many traders have already entered fresh sell positions with their stop losses placed above Monday's high.
Personally, I still expect one more upside move. I believe Gold could sweep Monday's high before reversing. After that sweep, I expect price to decline toward the $4014-$4017 zone. From there, I believe we could see strong buying interest throughout the day.
Why do I expect a sweep of Monday's high before the reversal?
Because the early sellers have already entered with stop losses above $4040. If Monday's high gets taken out, all of those stop losses will be triggered. Once they see the market reverse again, many of them will emotionally re-enter their sell positions, often with even larger position sizes to recover their previous losses. That creates even more liquidity for the market.
This is something we often see in Gold. After stop losses are hunted, traders jump back into the same direction, believing they are getting a better entry. Many even increase their risk, hoping to recover losses and catch a bigger move. But before their targets are reached, the market reverses again and traps them even more aggressively.
I believe something very similar could happen today.
If the market rejects Monday's high after sweeping it, price action traders will become even more confident in the bearish structure. They will see the rejection as confirmation and continue adding to their short positions. Most of them will likely target $4000 or even last week's low.
However, I don't think Tuesday will be a straightforward selling day. Instead, I believe the market will first create the psychological trap I explained above. Gold could spend most of the day moving higher, creating confusion for both buyers and sellers, before revealing its real bearish move once the majority of traders become trapped.
I hope you enjoyed today's psychological analysis and found the logic behind it useful. More importantly, I hope this analysis helped you understand how market psychology works behind price movement.
Trade wisely, manage your risk properly, and always prioritize good money management over chasing profits.
Good luck, everyone!
What's your view on Gold? Let me know in the comments.
 Short
Short
 Short
Short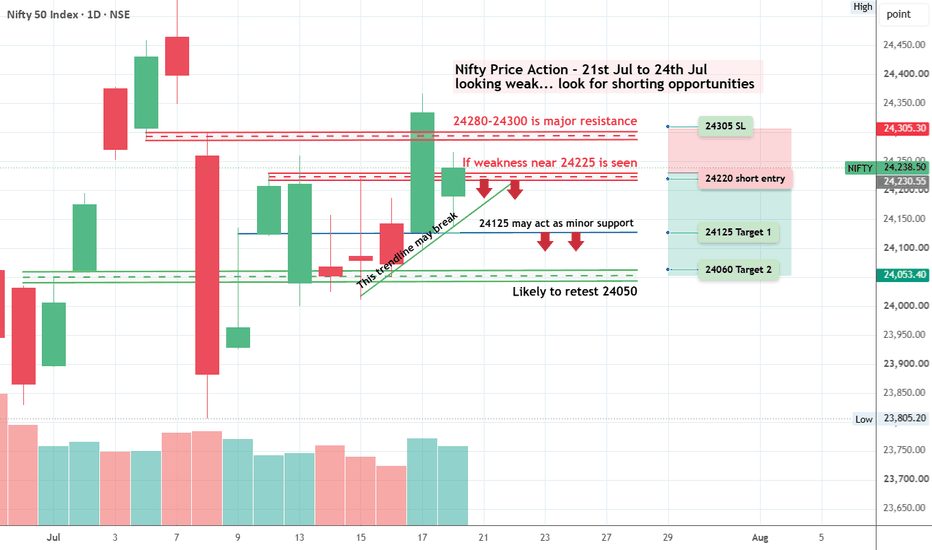
 Short
Short