#BANKNIFTY Intraday PE & CE Levels(21/07/2026)Bank Nifty is expected to witness a flat opening with no major overnight cues. The index is consolidating near the 57950–58050 zone after Friday's sharp rally, indicating a wait-and-watch approach before the next directional move. Traders should wait for confirmation around key support and resistance levels before initiating fresh positions.
If Bank Nifty sustains above 57550–57600 after the opening, traders can consider buying CE options with upside targets of 57750, 57850, and 57950. A decisive breakout above 58050 will confirm fresh bullish momentum and can extend the rally towards 58250, 58350, and 58450+.
On the downside, if Bank Nifty fails to hold the 57950–57900 resistance zone and shows rejection, traders can consider buying PE options with downside targets of 57750, 57650, and 57550. A breakdown below 57450 will further strengthen the bearish momentum and can drag the index towards 57250, 57150, and 57050.
Overall, a flat opening is expected with stock-specific action likely to dominate during the initial session. As long as Bank Nifty trades above the 57550–57600 support zone, buying on dips remains the preferred strategy. Traders should wait for confirmation near the opening range and maintain strict stop-losses while booking profits gradually at the mentioned target levels. Bhansali Engineering Polymers Ltd📈 Bhansali Engineering Polymers Ltd. (1W) – High-Volume Breakout Signals Fresh Bullish Momentum 🚀
Bhansali Engineering Polymers (BEPL) has delivered a decisive breakout above a long-standing resistance zone, supported by an exceptional surge in trading volume. After an extended period of consolidation and accumulation, the stock appears to be entering a new bullish phase with strong upside potential. 👀
🔍 Technical Highlights
✅ Breakout Above ₹130.30
The stock has convincingly crossed the ₹130.30 resistance level, a zone that had repeatedly acted as a major supply area. This breakout significantly improves the long-term technical outlook.
✅ Strong Base Formation
Following a prolonged decline, BEPL formed a solid base near ₹75 before gradually transitioning into a pattern of higher highs and higher lows, indicating a reversal in trend.
✅ Massive Volume Confirmation
One of the strongest positives is the exceptionally high breakout volume, suggesting aggressive institutional participation. High-volume breakouts generally have a higher probability of sustaining than low-volume moves.
🎯 Measured Move Projection
If the stock sustains above ₹130.30 on a weekly closing basis, the measured move projects a potential rally towards the ₹185 zone, implying an upside of approximately 40–45% from the breakout level.
⚠️ What Traders Should Watch
🔹 A weekly close above ₹130.30 would strengthen the breakout confirmation.
🔹 A healthy pullback that successfully retests ₹130.30 as support could provide an attractive risk-reward entry for positional traders.
🔹 Since the stock has witnessed a sharp breakout candle, avoid chasing extended prices. Waiting for consolidation or a successful retest can improve trade quality.
📌 Key Levels
🟢 Breakout Level: ₹130.30
🛡️ Major Support: ₹115 followed by ₹100
🎯 Potential Target: ₹185
💡 Final Thoughts
Bhansali Engineering Polymers has completed a strong breakout from a prolonged accumulation phase, backed by exceptionally strong volume and improving price structure. As long as the stock sustains above the ₹130.30 breakout zone, the technical outlook remains firmly bullish, with the ₹185 region emerging as the next major upside objective.
📢 Will BEPL continue its high-volume breakout toward ₹185, or will it first retest the breakout zone? Share your views below! 👇  Long
Long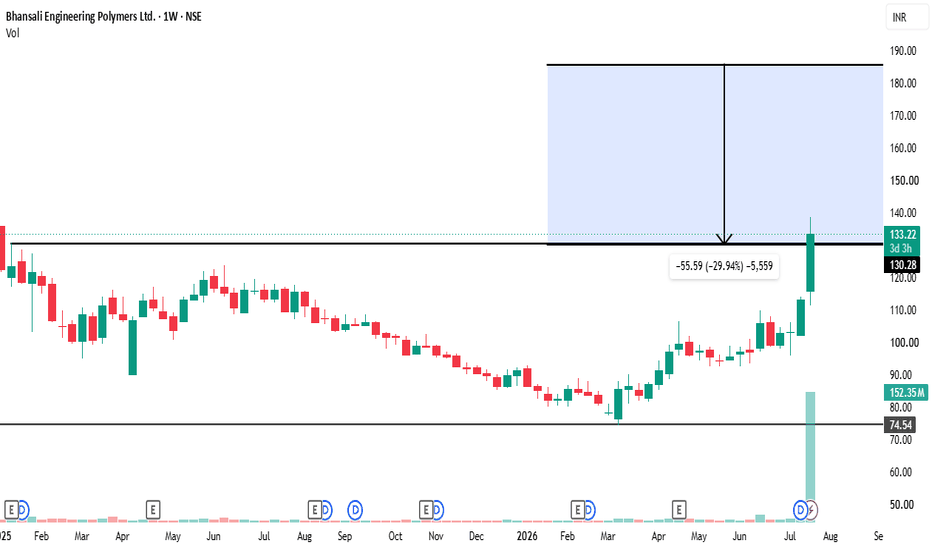
 Long
Long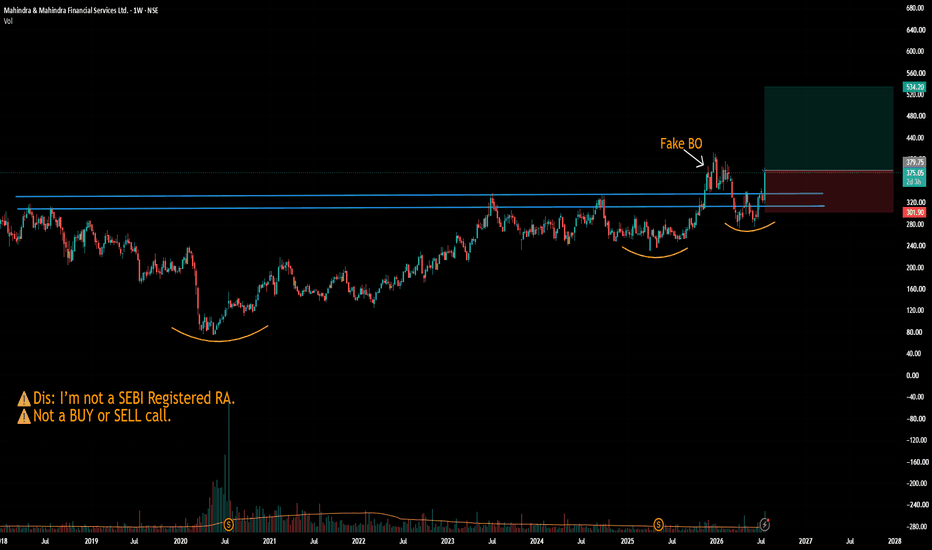
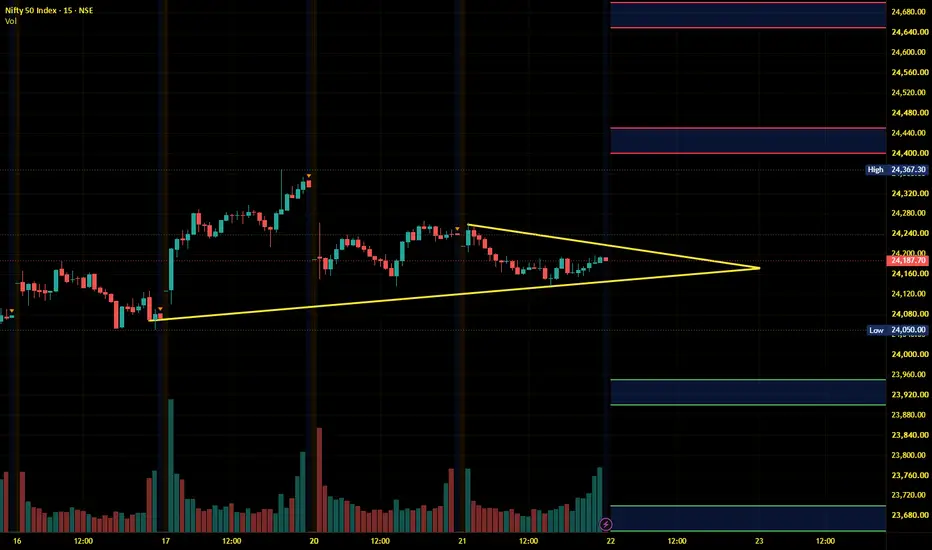
Nifty Intraday Outlook for 22-07-2026NIFTY 15 Min: Recovery Attempt Failure, 24,200 Breakout Needed
NIFTY is trading near 24,190, recovering from the 24,140 support zone.
Main view: NIFTY has recovered from the 24,140 support zone and is now testing the immediate resistance near 24,200. The chart is improving, but fresh bullish momentum will confirm only above this resistance.
Broader cues are slightly cautious. Indian shares were expected to open lower as Brent crude jumped near $92/bbl due to widening Middle East tensions, while GIFT Nifty was around 24,117, below the previous Nifty close of 24,187.7. Higher crude is negative for India because it can pressure inflation, rupee, trade deficit, and margins.
_____________________________
Key Levels
Resistance: 24,200
Target 1: 24,240
Target 2: 24,300
Supply Zone: 24,320–24,353
Support: 24,140
Next Support: 24,100
Demand Zone: 24,050
Lower Target: 23,940
_____________________________
Trade Plan
Bullish above 24,200
Targets: 24,240 / 24300 / 24,350
Buy-on-dip near 24,140
Only if bullish rejection appears.
Bearish below 24,130
Targets: 24,100 / 24,050 / 23,940
_____________________________
View
NIFTY is in recovery mode, but breakout is still pending.
Above 24,200 → buyers active
Below 24,130 → sellers active
Inside range → wait patiently
_____________________________
Educational view only. Trade with strict risk management.  Education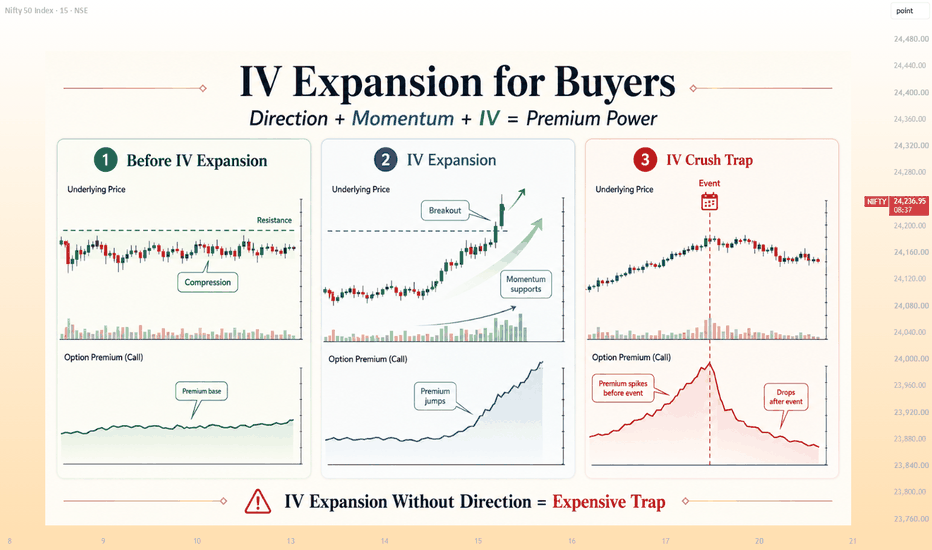
 Long
Long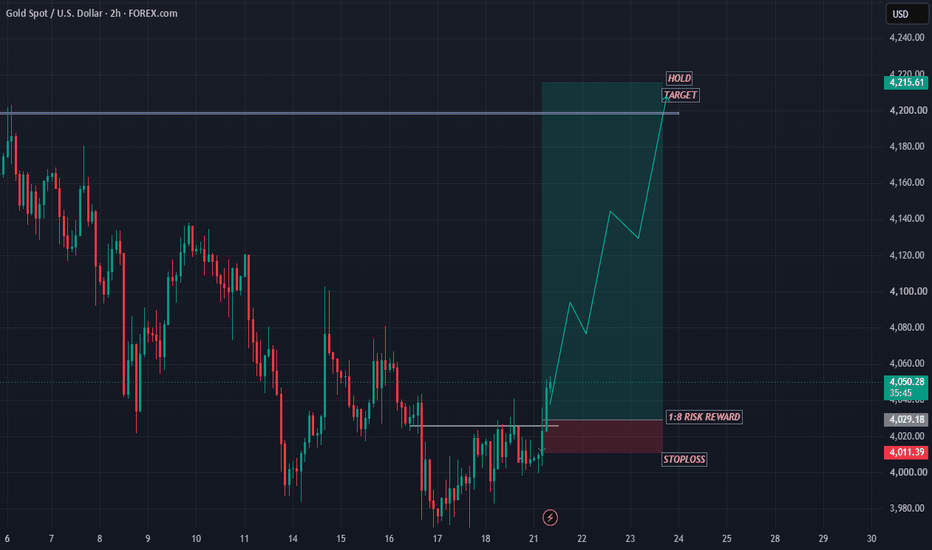
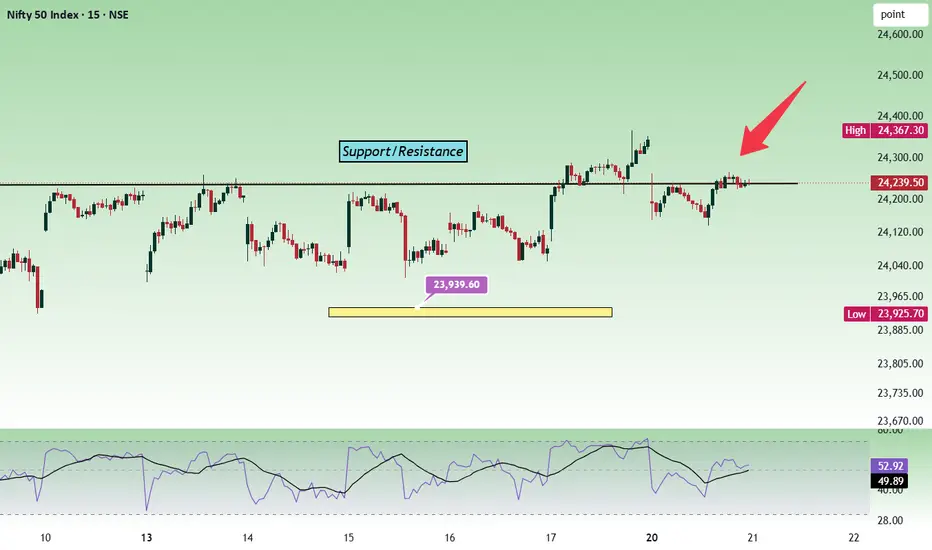
Nifty Intraday Outlook for 21-07-2026NIFTY 15 Min Chart Reading
Overall Bias: 🟠 Neutral to Mildly Bearish (until key resistance is reclaimed)
Current Market Drivers
Rising crude oil prices and renewed Middle East geopolitical tensions are weighing on sentiment.
GIFT Nifty indicated a weaker start, while recent FII selling continues to pressure the market despite DII support.
Q1 earnings season is likely to increase stock-specific volatility rather than broad index strength.
NIFTY is trading near 24,239, holding above short-term support but still below immediate resistance.
The chart is showing sideways consolidation after recovery. Bulls need a clean breakout above 24,270 for fresh upside momentum.
__________________________________
Key Levels
Resistance: 24,270
Target 1: 24,360
Target 2: 24,470
Support: 24,230
Lower Target 1: 24,140
Lower Target 2: 24,050
__________________________________
Trade Plan
Bullish above 24,270
Targets: 24,320 / 24,360 / 24,470
Buy-on-dip near 24,230–24,200
Only if bullish rejection appears.
Bearish below 24,220
Targets: 24,180 / 24,141 / 24,049
__________________________________
View
NIFTY is not fully bullish yet.
Above 24,270 → buyers active
Below 24,220 → sellers active
Inside range → wait patiently
__________________________________
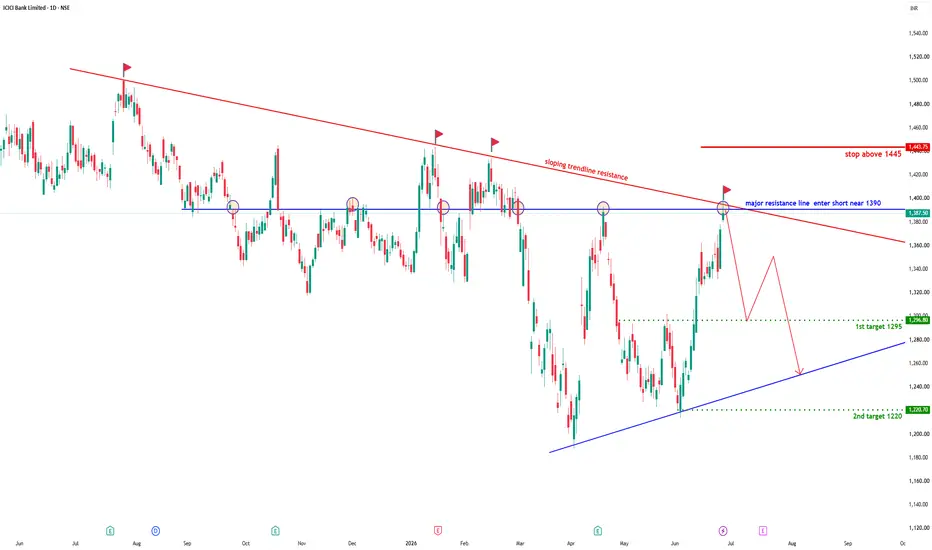
Educational view only. Trade with strict risk management. ICICI Bank – Short setup | Major Resistance + Falling TrendlineICICI Bank – High Probability Short Setup | Major Resistance + Falling Trendline Confluence
Analysis
ICICI Bank has rallied strongly from its recent swing low and is now approaching a significant resistance zone around ₹1390, where two major technical barriers converge:
Horizontal resistance that has acted as a strong supply zone multiple times over the past several months.
Long-term descending trendline resistance connecting the major swing highs.
This confluence creates a high-probability area where sellers may regain control.
Historically, every test of this resistance zone has resulted in sharp pullbacks, making this level worth monitoring closely for bearish confirmation.
Trade Setup
Entry
Consider short positions near ₹1390
Prefer waiting for bearish confirmation such as:
Bearish engulfing candle
Shooting star
Evening star
Strong rejection wick
Lower timeframe breakdown after rejection
Avoid entering before confirmation, as resistance levels can briefly break before reversing.
Stop Loss
Stop Above ₹1445
A sustained close above this level would invalidate the bearish setup by confirming a breakout above both the horizontal resistance and the descending trendline.
Risk management is essential.
Targets
Target 1
₹1295
This is the first significant support where partial profit booking can be considered.
Target 2
₹1220
If selling pressure continues, price may revisit the rising trendline support around ₹1220, making it the second downside objective.
Why This Setup?
This trade is based on multiple technical factors aligning together:
✔ Long-term descending trendline resistance
✔ Multi-month horizontal resistance
✔ Previous rejection history at the same price zone
✔ Strong recovery rally into resistance
✔ Favorable Risk-to-Reward ratio if rejection occurs
When multiple resistance levels overlap, the probability of institutional selling often increases.
What to Watch
A clean rejection from ₹1390 with increasing selling volume would strengthen the bearish case.
However, if price closes decisively above ₹1445, the setup becomes invalid and short positions should be avoided.
Risk Management
Never risk more than 1–2% of your trading capital on a single trade.
Wait for confirmation instead of anticipating the reversal.
Trail your stop once Target 1 is achieved.
Book partial profits at intermediate support levels if volatility increases.
Conclusion
The ₹1390 zone represents one of the strongest resistance areas on the ICICI Bank daily chart due to the confluence of a long-term descending trendline and repeated horizontal resistance. A confirmed rejection from this level offers an attractive short-selling opportunity with downside targets at ₹1295 and ₹1220, while maintaining a clearly defined invalidation above ₹1445.
Disclaimer: This analysis is shared for educational purposes only and should not be considered financial or investment advice. Always perform your own research and use proper risk management before taking any trade.  Short
Short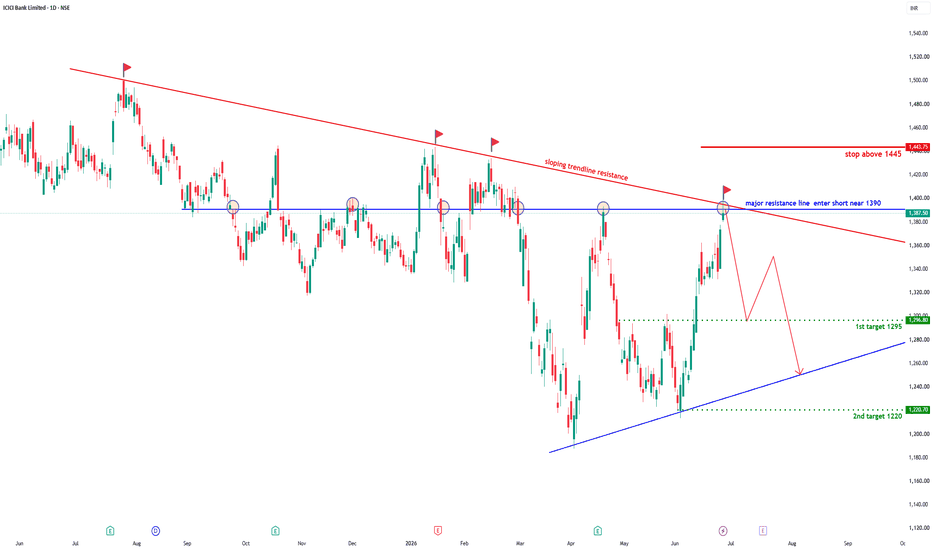
Hindustan Zinc - Squeezed Between Trendline Support & ResistanceOverview
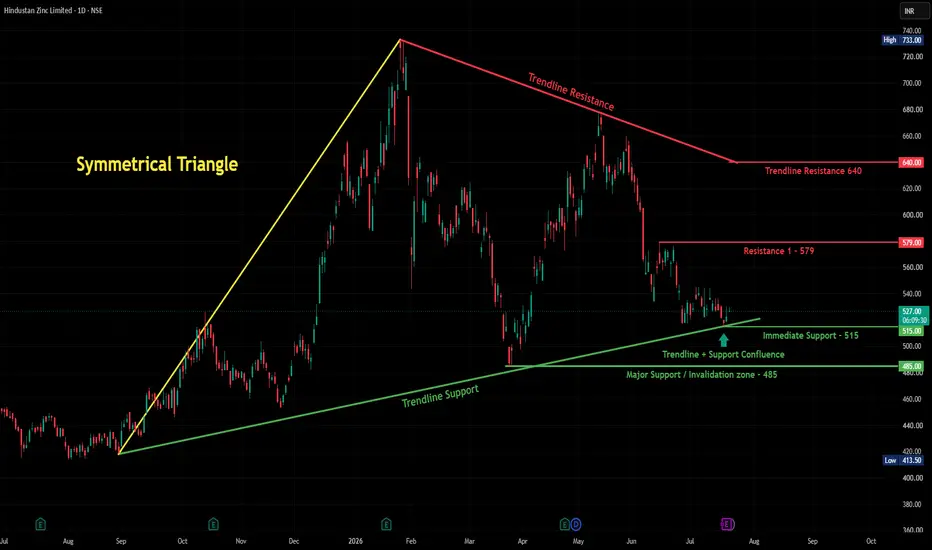
Hindustan Zinc is trading in a tightening zone right now — a rising trendline support from below is meeting resistance levels from above, and price is currently sitting right at the middle of this squeeze around 527.
What's Happening
The stock had a big rally from around 420 last year up to a high of 733, then pulled back hard. Since then, it's been finding support along a rising trendline (currently near 500-515), while facing resistance from a falling trendline coming down from the highs (currently around 640).
Right now, price is sitting just above the Immediate Support at 515, and just below Resistance 1 at 579. It's a fairly tight range at the moment — not too far from either boundary.
Key Levels to Watch
Immediate Support: 515
Major Support / Invalidation Zone: 485
Resistance 1: 579
Bigger Trendline Resistance: 640
Two Ways This Can Go
If support holds: A bounce from here, especially with a strong green candle, would be a good sign. First target to watch would be Resistance 1 at 579, and beyond that, the bigger trendline resistance near 640.
If support breaks: A close below 515, and especially below the Major Support/Invalidation zone at 485, would mean sellers are in control, and the broader uptrend structure (from the rising trendline) would be in question.
Beginner's Lesson
When a rising support trendline and a falling resistance trendline start meeting each other, price gets squeezed into a smaller range — like a spring being compressed. This usually means a bigger move is coming eventually, though it's hard to know which direction until price actually breaks one side clearly. That's why we wait for confirmation rather than guessing early.
Conclusion
Hindustan Zinc is at an interesting squeeze point between support and resistance. As always, we're watching for a clear break either way rather than assuming a direction. We'll update once this resolves.
For educational purposes only. Not financial advice. Always manage your risk. Truncation (Truncated Fifth) – When 5th Fails to Exceed 3rdA Truncation (or Truncated Fifth) occurs when Wave 5 completes with all five internal sub-waves but fails to move beyond the end of Wave 3. This is a rare Elliott Wave pattern that signals an extremely strong opposing force entering the market.
This chart illustrates both bullish and bearish truncation scenarios.
🟢 Bull Market Truncation :-
In a bullish trend, the market advances with a normal five-wave impulse.
Wave (1) rallies with 5 internal waves.
Wave (2) forms an ABC correction.
Wave (3) extends strongly and becomes the dominant impulse.
Wave (4) corrects the advance.
Wave (5) also develops with five internal sub-waves, but fails to break above the top of Wave (3).
This inability to make a new high is called Bull Market Truncation.
Although Wave (5) contains a complete five-wave structure internally, the overall advance is weaker than expected, showing that buyers are losing momentum while sellers are gradually taking control.
🔴 Bear Market Truncation :-
The same principle applies in reverse during a bearish trend.
Wave (1) declines with five waves.
Wave (2) corrects upward as an ABC pattern.
Wave (3) produces the strongest decline.
Wave (4) retraces the move.
Wave (5) again unfolds in five internal waves, but fails to move below the end of Wave (3).
This creates a Bear Market Truncation, indicating that selling pressure is fading and buyers are beginning to absorb the decline.
⚠️ The Most Important Rule :-
Many traders mistakenly identify any weak fifth wave as a truncation.
That is incorrect.
A valid truncated fifth must still contain five internal sub-waves.
✔ Wave 1 → 5 sub-waves
✔ Wave 3 → 5 sub-waves
✔ Wave 5 → 5 sub-waves
A truncated fifth does not become a three-wave correction simply because it failed to make a new extreme.
📌 Trading Insight :-
A truncation often appears near the end of a mature trend and warns that the current trend is exhausting itself.
When confirmed, it frequently precedes:
A sharp reversal,
A larger corrective phase,
Or the beginning of a new trend in the opposite direction.
Because truncations are relatively uncommon, they should always be confirmed with proper Elliott Wave structure and other technical evidence rather than assumed solely because Wave 5 failed to make a new high or low.
*********************************************************
Warning ⚠
Educational purpose only. Always combine Elliott Wave analysis with sound risk management and confirmation from price action.
*********************************************************
#ElliottWave #ElliottWaveTheory #TruncatedFifth #Truncation #MotiveWave #ImpulseWave #Wave3 #Wave5 #LeadingDiagonal #EndingDiagonal #CorrectiveWave #CorrectiveWaves #Zigzag #DoubleZigzag #TripleZigzag #FlatCorrection #Triangle #FractalMarkets #MultiTimeframeAnalysis #WaveAnalysis #TechnicalAnalysis #ChartAnalysis #ChartPattern #PriceAction #MarketStructure #TradingEducation #TradingPsychology #TradingView #StockMarket #Trading #Trader #Investing #LearnTrading #SwingTrading #IntradayTrading #PositionTrading #PositionalTrading #Nifty #BankNifty #NSE #RECLTD #Stocks #NikhilKanal
 Education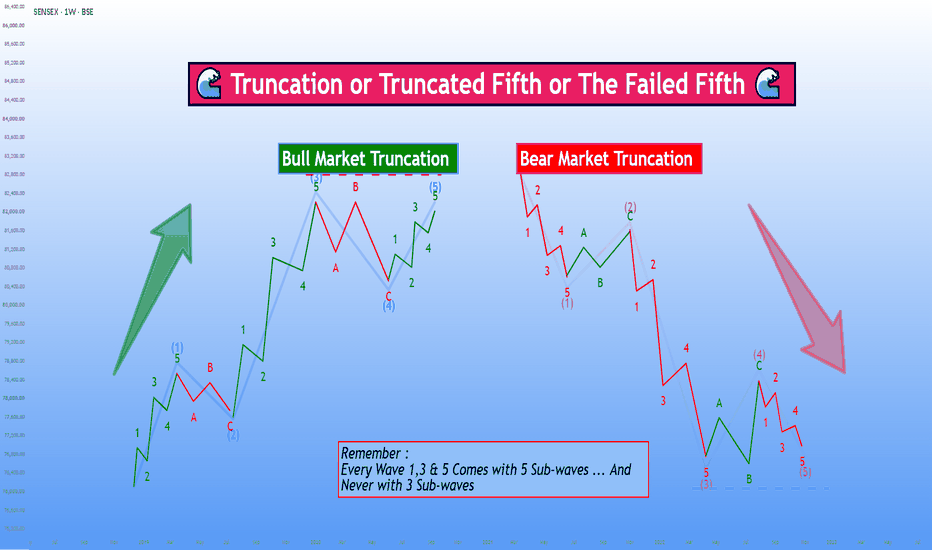
XAUUSD: Bullish Wave 5 may begin after pullback.Gold is showing a clear recovery structure after completing the previous bearish cycle near the lower area. From Kelly’s view, the chart is now shifting into a bullish Elliott sequence, but price may still need one corrective pullback before wave 5 continues higher.
The key idea is simple: gold is bullish in the short term, but the better setup may come from a clean retest of the buy zone, not from chasing the current push.
⟡ Market structure
The chart shows gold has reacted strongly from the lower base near 3,960 and created a sequence of higher lows. Price has already broken back above the descending pressure line, which is an important sign that sellers are losing control in the short-term structure.
Gold is now trading around 4,075 after a strong recovery move. However, price is approaching the 4,090–4,100 sell wave 4 zone, so a short correction from this area would be normal.
The main support to watch is the 4,040–4,050 buy zone wave 5. If gold pulls back into this area and buyers defend it, the next upside leg may continue towards the Fibonacci 2.618 target near 4,145–4,155.
➤ Key levels
◌ 4,040–4,050: buy zone wave 5 and key pullback area
◌ 4,075: current price reaction area
◌ 4,090–4,100: sell wave 4 / short-term resistance
◌ 4,138: previous Fibonacci reference zone
◌ 4,145–4,155: final wave 5 completion area
◌ Below 4,030: area where the bullish setup starts to weaken
◌ Below 4,000: area where the wave count needs reassessment
⌁ Elliott Wave view
From an Elliott Wave perspective, gold appears to be building a bullish 5-wave recovery after the previous bearish structure ended.
Wave 1 created the first upside reaction from the low.
Wave 2 corrected back but held above the base.
Wave 3 expanded strongly and pushed gold back above the broken trendline.
Wave 4 may now form as a controlled pullback into the 4,040–4,050 buy zone.
If that zone holds, wave 5 may begin and aim for the 4,145–4,155 completion area.
This is why Kelly would not chase the current price directly into resistance. The stronger setup is to wait for wave 4 to finish, then look for confirmation that wave 5 is starting.
▸ Trading scenario
Preferred scenario: wait for gold to pull back into the buy zone wave 5 and show bullish confirmation.
Entry zone: 4,040–4,050 if bullish confirmation appears
Stop loss: below the confirmed wave 4 low or below 4,030
Take profit 1: 4,090–4,100
Take profit 2: 4,138
Take profit 3: 4,145–4,155
Alternative scenario: if gold breaks above 4,100 without a pullback and holds strongly, price may continue directly towards the wave 5 target. In that case, a retest of 4,090–4,100 as support would become the cleaner continuation setup.
⌁ Kelly’s view
For Kelly, the bullish recovery structure is improving, but the market is now close to a short-term resistance zone. That means the best plan is patience.
If gold corrects into 4,040–4,050 and buyers defend the zone, the next wave 5 move may continue towards the higher Fibonacci target.
Gold is building a bullish Elliott structure.
A controlled pullback may prepare the next move higher.
Share your view below. Long 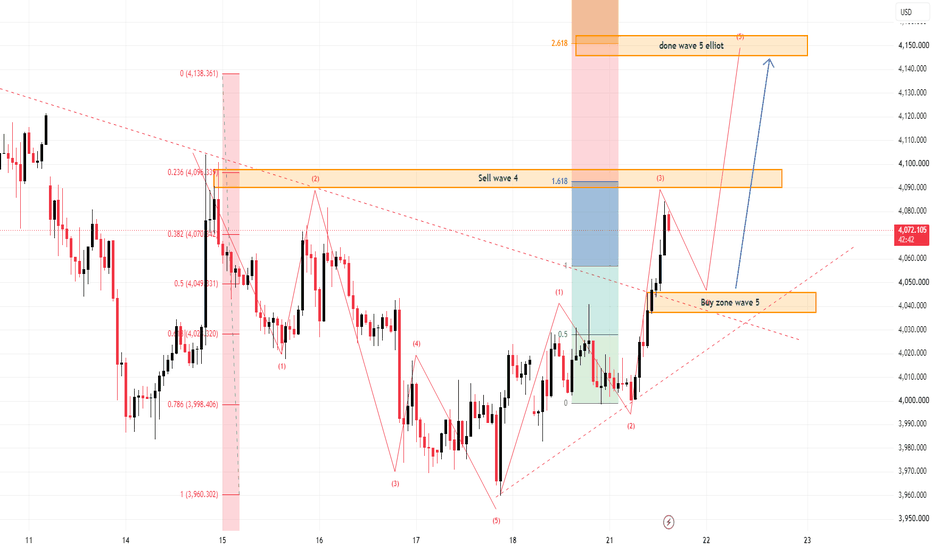
 Long
Long
DXY: Ready for the Next Leg? Flagpole Pattern!!The U.S. Dollar Index appears to be forming a Bull Flag after a strong impulsive rally.
A healthy trend rarely moves in a straight line. Strong markets often pause, consolidate, and absorb profit booking before attempting the next move. That's exactly what DXY is doing at the moment.
The initial rally formed the flagpole, reflecting strong buying momentum. Since then, price has been correcting inside a downward-sloping channel, creating the flag. This type of consolidation usually indicates that sellers are unable to reverse the trend, while buyers gradually absorb supply.
What's encouraging is that the entire correction is taking place above the previous breakout zone near 100, suggesting that former resistance is now acting as support. This is a constructive sign from a market structure perspective.
A decisive breakout above the flag would indicate that the correction is complete and could trigger the next leg higher. Until then, the pattern remains under development, and patience is essential.
This isn't just a Forex chart.
The next move in DXY can influence Gold, Silver, Crude Oil, USDINR, emerging markets, FII flows, and global equity indices.
Rather than predicting the direction, I'm simply identifying a high-probability structure and waiting for the market to confirm it.
Sometimes the best trades begin with a simple continuation pattern.  Long
Long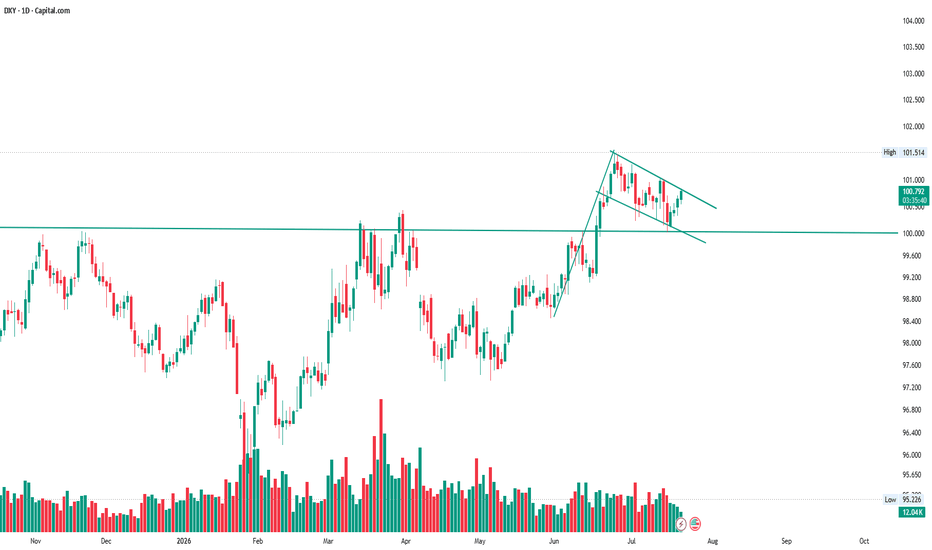
NIFTY DAILY / Short Range Level Analysis for 22nd Jul 2026🔕 SGMN SplD BULLISH Above => 24257.
🔕 SGMN SplD Bearish BELOW => 24122.
Mentioned analysis based on 2 consecutive candle close in 15 min Time Frame.
━━━━━🟥🟧🟨🟩🟦🟪⬛━━━━━
💥Level Interpretation / description:
✍🏻L#1: If the candle crossed & stays above the “Buy Gen”, it is treated / considered as Bullish bias. Cfm=> Confirmation.
L#2: Possibility / Probability of REVERSAL near 🔕RL/TF1 & 🔔RL/TF2
L#3: If the candle stays above “Sell Gen” but below “Buy Gen”, it is treated / considered as Sidewise. Aggressive Traders can take Long position near “Sell Gen” either retesting or crossed from Below & vice-versa i.e. can take Short position near “Buy Gen” either retesting or crossed downward from Above.
L#4: If the candle crossed & stays below the “Sell Gen”, it is treated / considered a Bearish bias.
L#5: Possibility / Probability of REVERSAL near 🔕RL/TF1 & 🔔RL/TF2
HZB (Buy side) & HZS (Sell side) => Hurdle Zone,
✍🏻 *** Specialty of “HZB#1, HZB#2 HZS#1 & HZS#2” is Sidewise (behaviour in Nature)
Rest Plotted and Mentioned on Chart
Color code Used:
Green, BLUE =. Positive bias.
Safron, RED =. Negative bias.
RED in Between Green means Trend Finder / Momentum Change
/ CYCLE Change and Vice Versa.
Notice One thing: HOW LEVELS are Working.
Use any Momentum Indicator / Oscillator or as you "USED to" to Take entry.
━━━━━🟥🟧🟨🟩🟦🟪⬛━━━━━
⚠️ DISCLAIMER:
The information, views, and ideas shared here are purely for educational and informational purposes only. They are not intended as investment advice or a recommendation to buy, sell, or hold any financial instruments. I am not a SEBI-registered financial adviser.
Trading and investing in the stock market involves risk, and you should do your own research and analysis. You are solely responsible for any decisions made based on this research.
"🔔As HARD EARNED MONEY IS YOUR's, So DECISION SHOULD HAVE TO BE YOUR's".
━━━━━🟥🟧🟨🟩🟦🟪⬛━━━━━
❇️ Follow notification about periodical View
💥 Do Comment for Stock WEEKLY Level Analysis.🚀
📊 Do you agree with this view?
✈️ HIT THE PLANE ICON if this technical observation resonates with you. It will Motivate me.
━━━━━🟥🟧🟨🟩🟦🟪⬛━━━━━
💡 If You LOOKING any CHART & want for Level and ANALYZE?
Share your desired stock names in the comments below! I will try to analyze the chart Levels, patterns and share my technical view (so far my Knowledge).
If Viewers think It can identify meaningful setups. Looking forward to hearing from all of you — let's keep this discussion going and help each other make better trading decisions.
___________🔕^^^⚫⚪^🙏🏼🙏🏼🙏🏼^⚪⚫^^^🔔___________ Short 
21/07 H4 - GOLD BREAKS DOWNTREND – BREAKOUT OR BULL TRAP?After several weeks of persistent selling pressure, Gold is finally showing the first meaningful signs of stabilization. The broader macro backdrop has not changed significantly, with the Federal Reserve maintaining a cautious stance and the market still expecting interest rates to remain restrictive for some time. However, the absence of fresh bullish catalysts for the U.S. dollar has allowed Gold to recover from recent lows as profit-taking and short covering begin to emerge.
Rather than being driven by a major macro shift, the current rebound appears to reflect a change in short-term market positioning. This makes confirmation more important than anticipation, as institutional traders will likely wait for price to validate a new structure before committing to larger positions.
From a technical perspective, Gold has broken above the descending trendline that capped price action throughout the recent decline, marking the first technical improvement in weeks. Price is now approaching the previous Demand + Fibonacci resistance, which also aligns with the former ascending trendline around the 408x area. This confluence represents the market's next decision point. A successful retest followed by a confirmed break above 408x would suggest that buyers are regaining control and could open the way toward the 412x institutional resistance zone.
However, the breakout has yet to receive full confirmation. If buyers fail to defend the 401x support and price falls back below the breakout zone, the recent move would likely be classified as a false breakout, shifting focus back toward the lower liquidity zone.
PRIMARY SCENARIO
Gold may continue its recovery after breaking the descending trendline. A successful retest above 401x, followed by a confirmed breakout through the 408x Demand + Fibonacci resistance, could expose the 412x supply zone as the next upside objective.
ALTERNATIVE SCENARIO
If price loses the 401x support and falls back below the breakout area, the bullish breakout would likely fail. In that case, Gold could resume its broader bearish trend and revisit the lower demand zone around 394x–396x.
MARKET VIEW
Current Bias: Neutral to Bullish
Preferred Strategy: Buy the Dip above 401x – Wait Confirmation above 408x.
Lucas Gay Trading Short 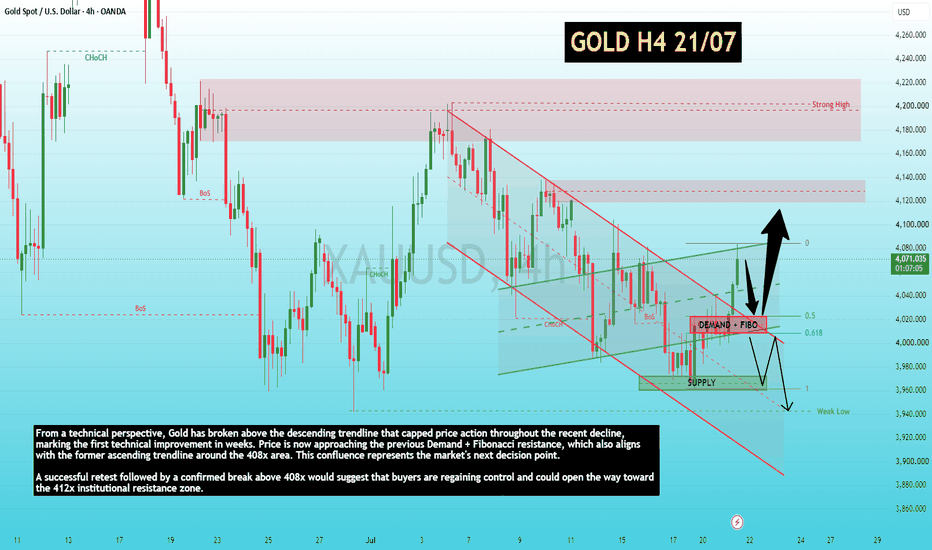
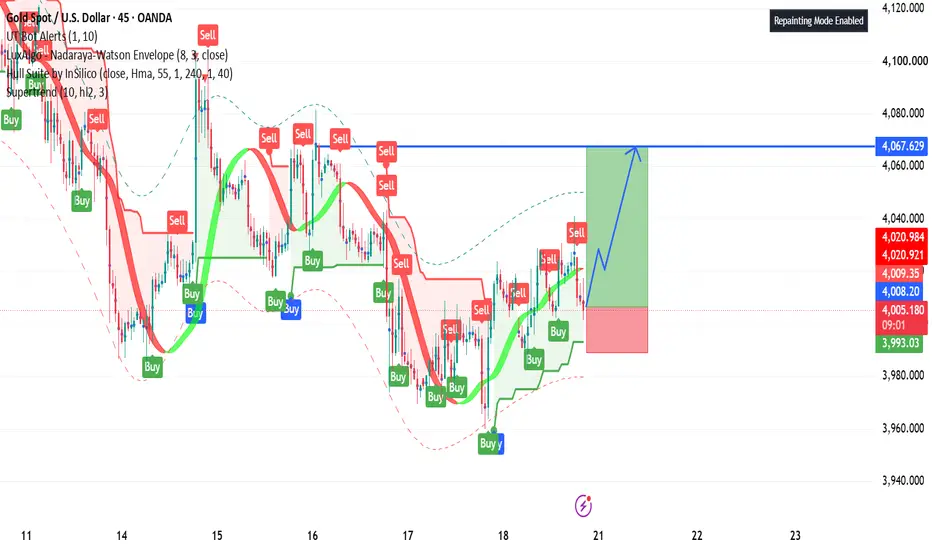
Technical Analysis – Bullish Recovery Eyes Major ResistanMinute Technical Analysis – Bullish Recovery Eyes Major Resistance
The 45-minute XAU/USD chart shows that buyers are attempting to regain control after a sharp corrective decline. Price has established a sequence of higher lows from the recent swing bottom, indicating improving short-term market structure. However, the market is still approaching a significant resistance zone where sellers previously entered aggressively.
Market Structure
The recent recovery has formed a short-term bullish trend with higher lows and higher highs.
Price remains above the dynamic support area (around 3,993–4,000), suggesting buyers are defending pullbacks.
The projected move indicates a continuation toward the overhead resistance near 4,067.60, provided current support remains intact.
Key Technical Levels
Immediate Support: 3,993 – 4,000
Current Price: ~4,004
Major Resistance: 4,067 – 4,070
Bullish Target: 4,067.60
Momentum Analysis
Momentum has shifted in favor of the bulls after the recent rebound. The buy signals and rising trend support indicate improving strength, although intermittent sell signals suggest resistance has not been completely cleared. As long as price continues printing higher lows, bullish momentum remains valid.
Bullish Scenario
A sustained hold above the 4,000 support zone could encourage buyers to push toward 4,067. A decisive breakout above this resistance would confirm renewed bullish momentum and may open the door for a continuation toward higher price levels.
Bearish Scenario
Failure to maintain support around 3,993–4,000 would weaken the current bullish structure. A breakdown below this region could trigger profit-taking and expose price to a deeper retracement toward previous demand zones.
Trading Outlook
The overall short-term bias is moderately bullish while price remains above the recent support base. Rather than chasing price higher, traders may prefer waiting for either:
a confirmed breakout above 4,067, or
a bullish pullback into support with strong confirmation.
Bias Summary
Short-Term Bias: Bullish
Confirmation: Higher lows continue to form and price holds above 4,000.
Invalidation: A 45-minute close below 3,993 would weaken the bullish outlook.
Primary Target: 4,067.60
Conclusion: The chart suggests that XAU/USD is attempting to build bullish momentum after its recent recovery. While the path of least resistance currently favors the upside, the 4,067 resistance zone remains the key hurdle. A successful breakout would strengthen the bullish case, whereas rejection from that level could lead to another corrective pullback before the next directional move. Long 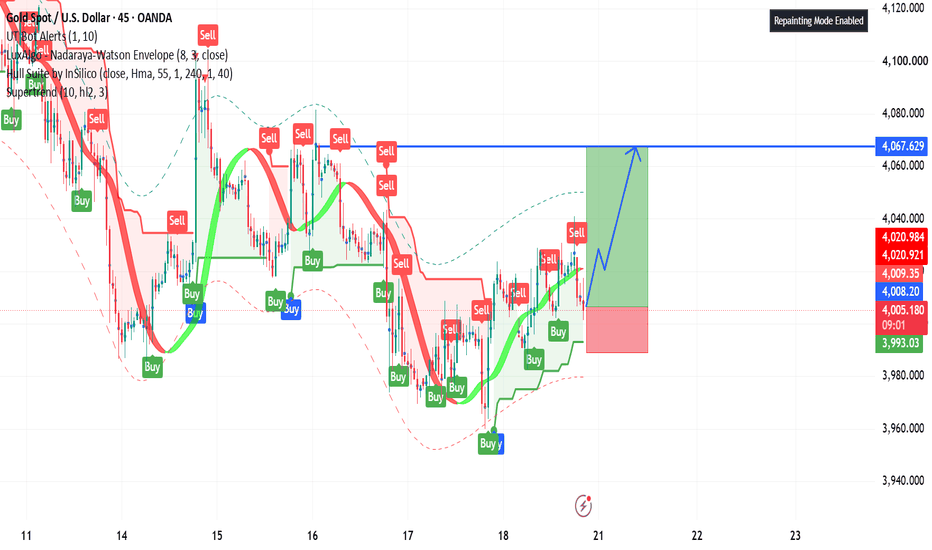

 Short
Short