Inflation Cools, But Gold Still Can't Break Out of the DowntrendKey Highlights
Both the U.S. CPI and PPI came in below expectations, signaling easing inflation pressures and reinforcing expectations that the Fed may adopt a more dovish stance.
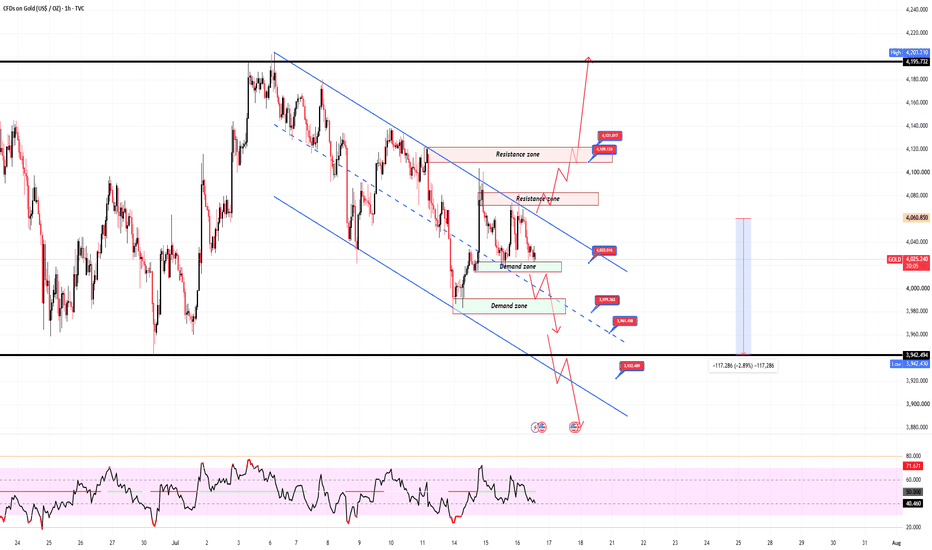
Despite the softer inflation data, gold remains confined within its H1 descending channel, with no confirmed trend reversal yet.
The next major catalysts are Retail Sales, Jobless Claims, remarks from President Trump, and the U.S. Consumer Sentiment report.
📌 Trading Plan
Resistance: 4070–4085 | 4105–4120 | 4195
Support: 4015–4025 | 3980 | 3960 | 3942
Extended Support: 3920 | 3880
📌 Personal View
✅ The primary trend remains bearish as long as price stays below the descending channel.
✅ Continue watching for SELL opportunities around key resistance zones.
✅ A breakout above 4120 could open the door for a recovery toward 4195.
✅ A break below 4015–4025 may extend the decline toward 3980–3960, with 3942–3920 as the next downside targets.
📌 What do you think?
Will cooling inflation be enough for gold to break out of its downtrend, or is this still just another rally to sell?
Trend Analysis
Day 1 - The 30 Trade Series The 30 Trade Series
In this series, we'll scan the markets each day in search of a very specific trend continuation setup. The objective is simple: take only 30 A+ quality trades that meet our criteria—no forcing setups, no unnecessary trades.
Once all 30 trades are completed, we'll analyze the results, review the statistics, and reflect on what we learned about the strategy's performance, execution, and consistency.
Premier Polyfilm cmp 70 Daily ChartPremier Polyfilm cmp 70 Daily Chart
- Support Zone 59 to 69 Price Band
- Resistance Zone 71 to 80 Price Band
- Support Zone made good ground for uptrend
Volumes are in good sync with average traded quantity
- Head & Shoulders + Cup & Handle + Rounding Bottom
- Breakout from Resistance Zone & Trendline seen attempted
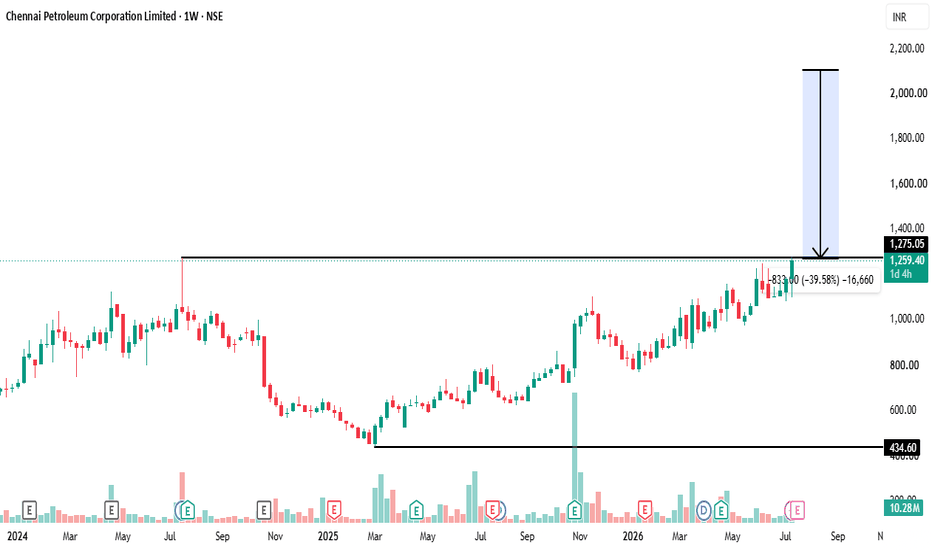
Chennai Petroleum Corporation Ltd🏆 Stock Setup of the Day | Chennai Petroleum Corporation Ltd. (NSE: CHENNPETRO)
📈 Timeframe: Weekly Chart
🚀 Multi-Year Breakout Near All-Time High Zone
Chennai Petroleum is displaying impressive relative strength after recovering from its 2025 lows. The stock is now consolidating just below a significant resistance area around ₹1,275, keeping the long-term uptrend intact.
🔹 Current Price: ₹1,260.50
🔹 Key Resistance: ₹1,275
🔹 Breakout Confirmation: Sustained weekly close above ₹1,275
🔹 Potential Target Zone: ₹2,100
🔹 Potential Upside: ~40%
📊 Technical View
✅ Strong long-term bullish structure with Higher Highs & Higher Lows
✅ Price is consolidating near resistance after a sustained rally—a healthy sign of strength
✅ Weekly trend remains positive with buyers maintaining control
✅ Volume expansion during the advance supports the bullish structure
👀 Key Levels to Watch
🟢 Support Zone: ₹1,180–₹1,220
🔵 Immediate Resistance: ₹1,275
🎯 Projected Target: ₹2,000–₹2,100
💡 Trading Perspective
A decisive breakout and weekly close above ₹1,275 could signal the next leg of the uptrend. Until then, watch for consolidation with improving volume, which often precedes strong directional moves.
⚠️ Disclaimer: This post is for educational and informational purposes only and should not be considered investment or trading advice. Please conduct your own research and follow proper risk management before taking any position.
🔥 Follow for daily high-probability breakout setups, trend analysis, and educational technical insights.
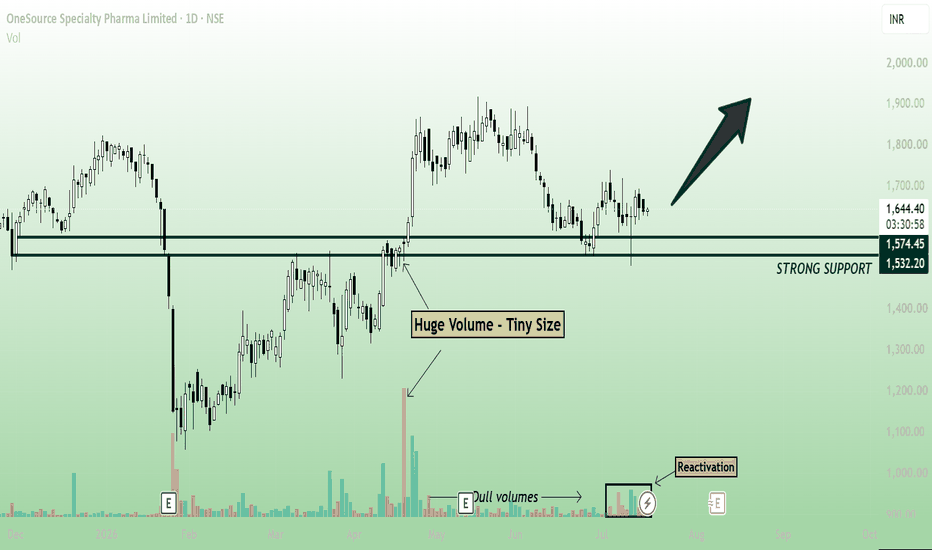
ONESOURCE - INTERESTING VOLUME ACTIVITY!DISCLAIMER: This publication is NOT a trade recommendation, but only my observation. Please do your own analysis before taking trades
Points to note:
------------------
1. First and foremost, the peculiar candle with such a small body but HUGE volumes. This is further confirmation of the importance of that zone.
2. Lots of orders in that zone. Now price is back there, and sustaining above the important support level.
3. Volumes keep drying up as the price moves away from the levels. Now that we're back there, volumes are returning.
4. We're also at the formation of the 2nd shoulder in the Head & Shoulders that is forming here.
Keeping these points in mind, the foll. trade:
-----------------------
ENtry CMP, SL 1499, TGT 1845
Trading Road Mapoptions trading and institutional trading are important parts of modern financial markets. Options trading offers flexibility and opportunities for profit, while institutional trading provides liquidity and stability to the market. However, beginners should learn market concepts carefully before entering options trading because losses can occur quickly without proper knowledge and risk management. Education, practice, and disciplined investing are essential for long-term success in trading.
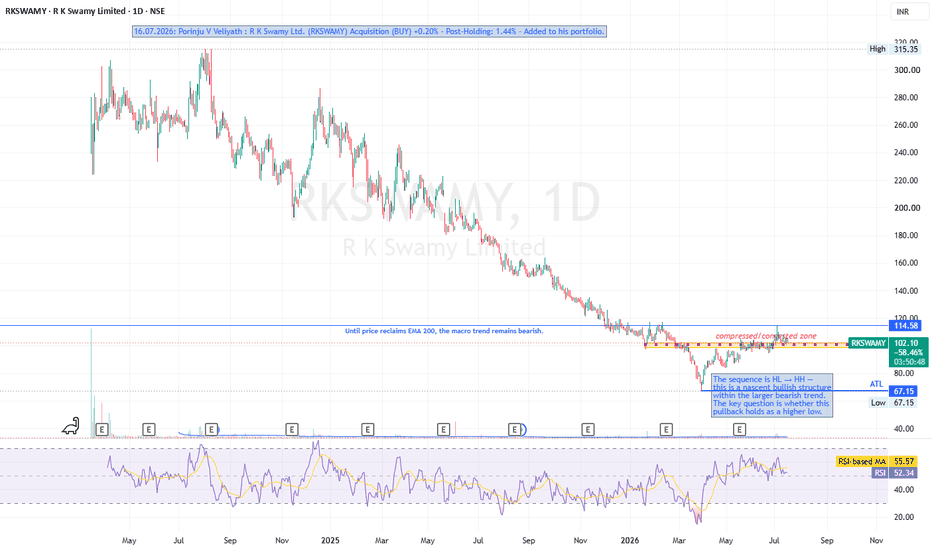
RKSWAMY: "Smart Money" Entry & Nascent Trend Reversal?Overview:
R K Swamy Limited (NSE: RKSWAMY) is presenting an incredibly compelling setup on the daily (1D) timeframe. After suffering a brutal macro downtrend that dragged the price from its highs above ₹300 down to an All-Time Low (ATL) of ₹67.15, the stock is finally showing signs of life. The most critical development is a massive fundamental catalyst: Ace investor Porinju V Veliyath recently acquired a stake, bringing his holding to 1.44%. This "smart money" accumulation often acts as a powerful tailwind for a technical turnaround.
Key Technical Observations:
Trend Structure (Macro vs. Micro): The macro trend remains undeniably bearish as long as the price trades below the 200 EMA. However, the micro-structure is shifting. The price has started printing a sequence of Higher Lows (HL) and Higher Highs (HH), creating a nascent bullish structure.
Compression Zone Resistance: The stock is currently facing stiff resistance at the ₹114.58 level. This area has turned into a compressed/congested zone. A decisive daily close above this level is required to confirm the next leg up.
Momentum (RSI): The Daily RSI is currently hovering around 52.62, sitting just below its RSI-based moving average (55.59). This neutral reading indicates that the recent pullback has successfully cooled off momentum, giving the stock room to breathe and build energy for a potential breakout attempt.
Key Levels to Watch:
Immediate Resistance: The ₹114.58 congestion zone. Reclaiming this is step one.
Macro Resistance: The 200 EMA (currently way above the price). Reclaiming this will definitively end the macro bear market.
Immediate Support: The current pullback zone (~₹100-₹102). It is crucial that this level holds to maintain the new Higher Low (HL) sequence.
Macro Support: The ATL at ₹67.15.
Directional Bias: CAUTIOUSLY BULLISH (Hold / Accumulate on Dips)
The convergence of a micro-trend reversal and high-profile institutional buying makes this a highly attractive risk-to-reward setup. The key question right now is whether the current pullback holds as a higher low.
For new entries: Look for accumulation near the ₹100 zone with a strict stop-loss below the recent structural higher low, or wait for a confirmed volume breakout above ₹114.58.
For existing positions: Hold and trail your stop loss to protect against a breakdown of the new bullish sequence.
Disclaimer: This analysis is for educational purposes only and does not constitute financial advice. Always manage your risk and position sizing carefully.
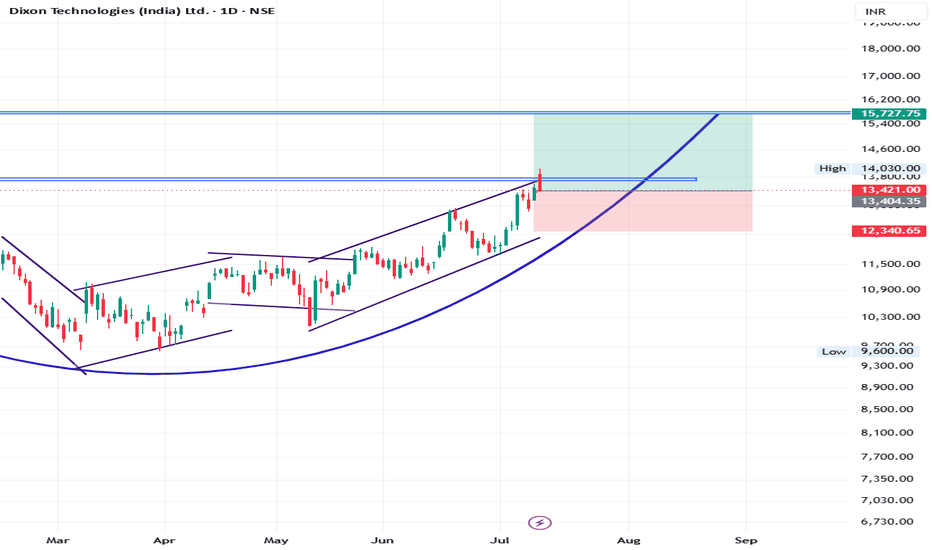
SWING Pick for 2 Months - DIXON - 18% upside possibility📈 SWING PICK: DIXON Technologies
Timeframe: 40–50 Days (1–2 Months)
We are tracking a strong swing setup on DIXON with a highly favorable risk-to-reward profile.
Current Market Price (CMP): ₹13,421
Target: ₹15,750+ (~18% potential upside)
Stop Loss (SL): ₹12,375 (~7.8% risk)
Risk-Reward Ratio: 1:2
Disclaimer: For educational purposes only. Please manage your risk accordingly. Happy Investing!
Leading/Ending Diagonal: Where #Triangles Can Secretly Form ...Most traders know that Leading Diagonals (LD) and Ending Diagonals (ED) consist of five overlapping waves.
However, one detail is often overlooked:
The corrective B-wave inside each motive leg can itself develop into a Triangle.
That's exactly what this chart illustrates.
What the chart shows
Each blue impulse leg (1), (2), (3), (4), and (5) is broken down into its internal A-B-C corrective structure.
Notice that:
Wave B of (1) can form a Triangle.
Wave B of (2) can form a Triangle.
Wave B of (3) can form a Triangle.
Wave B of (4) can form a Triangle.
Even Wave B of (5) can also form a Triangle before the final thrust.
These are highlighted throughout the chart.
Why is this important?
Many traders mistakenly assume that a Triangle automatically means the larger trend has ended.
In reality:
A Triangle inside the B-wave of an internal correction is perfectly valid and often appears during the development of a Leading or Ending Diagonal.
If you mislabel that Triangle as the completion of the entire pattern, you'll likely anticipate a reversal too early.
Practical takeaway
When you identify a Triangle, don't immediately ask:
"Is this the end of the trend?"
Instead ask:
"What degree is this Triangle?"
A Triangle inside an internal B-wave simply tells us:
The correction is consuming time.
One more C-wave of that correction is likely.
After the correction completes, the larger diagonal wave should continue.
Understanding the degree of the Triangle is far more important than simply recognizing its shape.
Key Learning :
✅ Triangles are not limited to Wave 4 or Wave B of higher-degree corrections.
They can also appear inside the internal B-wave of every leg of a Leading or Ending Diagonal.
Correctly identifying these internal Triangles can prevent premature entries and improve wave counting accuracy.
Educational Purpose Only
This post is intended to explain Elliott Wave structure and should not be considered trading or investment advice.
#ElliottWave #TradingEducation #LeadingDiagonal #EndingDiagonal #Triangle #WaveAnalysis #TechnicalAnalysis #PriceAction #TradingView #MarketStructure #NikhilKanal #ElliottWave
#ElliottWaveTheory #TradingEducation #TradingView #TechnicalAnalysis #WaveAnalysis #LeadingDiagonal #EndingDiagonal #TrianglePattern #ChartAnalysis #PriceAction #MarketStructure #MarketAnalysis #TradingPsychology #SmartMoney #StockMarket #StockMarketIndia #Nifty50 #NSEIndia #MCX #SwingTrading #PositionTrading #TrendFollowing #TradingStrategy #WaveCounting #ImpulseWave #CorrectiveWave #TradingCommunity #LearnTrading #TraderLife #FinancialEducation #Investing #TradingTips #ChartPatterns #TechnicalTrader #TradingMentor #MarketWisdom #TradingSkills #PriceStructure
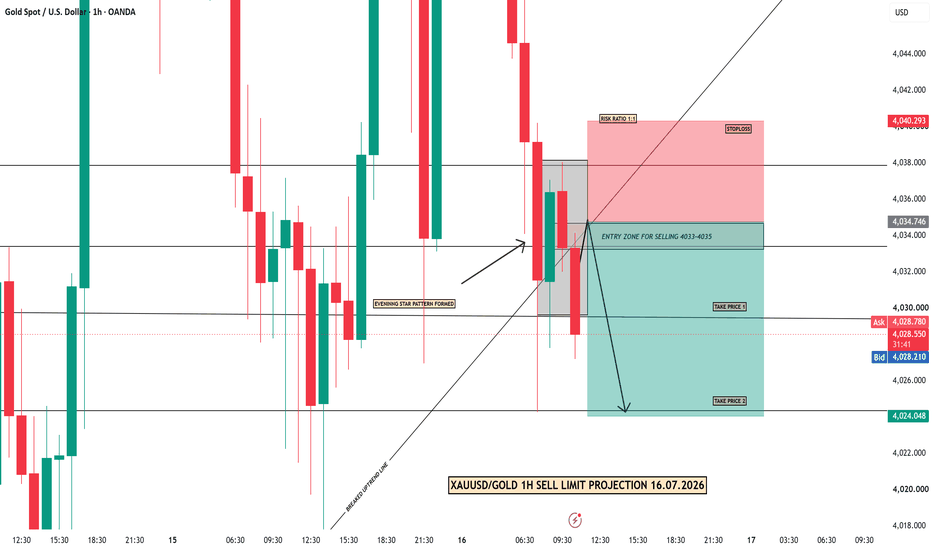
XAUUSD/GOLD 1H SELL LIMIT PROJECTION 16.07.26XAUUSD / GOLD – 1H Sell Limit Projection
Gold faced strong rejection near the 4038 resistance zone and formed an Evening Star pattern, indicating a possible bearish reversal. The previous uptrend line has also been broken, confirming weakening bullish momentum.
Sell Entry Zone: 4033–4035
Stop Loss: 4040.30
Take Profit 1: 4029–4030
Take Profit 2: 4024.05
The entry zone acts as a retest area after the trendline breakdown. TP1 offers approximately a 1:1 risk-to-reward ratio, while TP2 is the extended bearish target near the next major support.
A strong 1H candle close above 4040.30 would invalidate this bearish projection.
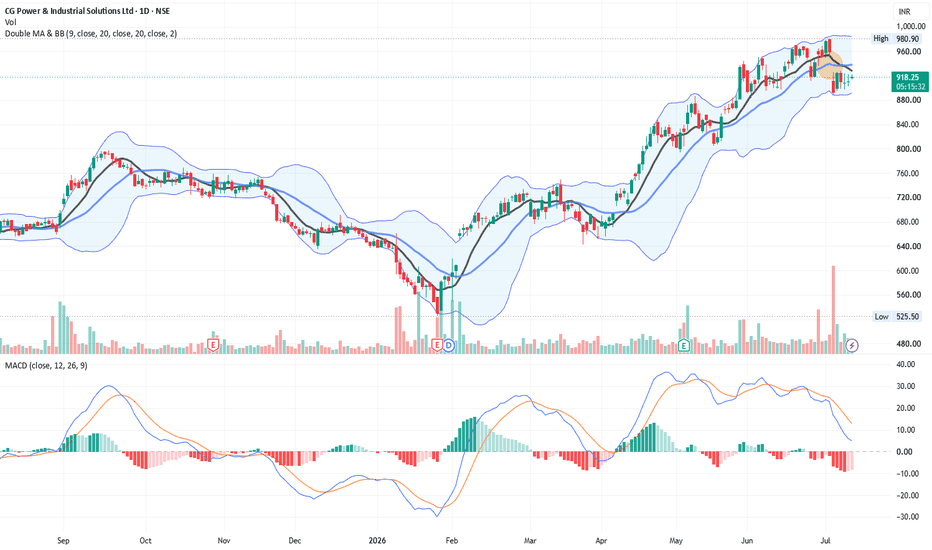
Keep An Eye - Gap Fill - CGPOWER📊 Script: CGPOWER
📊 Sector: Capital Goods
📊 Industry: Heavy Electrical Equipment
Key highlights: 💡⚡
📈 Keep an eye on stock it may fill gap, once the price is above 927.
BUY ONLY ABOVE 927
⏱️ C.M.P 📑💰- 918
🟢 Target 🎯🏆 - 950+
⚠️ Important: Always maintain your Risk & Reward Ratio.
✅Like and follow to never miss a new idea!✅
Disclaimer: I am not SEBI Registered Advisor. My posts are purely for training and educational purposes.
Eat🍜 Sleep😴 TradingView📈 Repeat 🔁
Happy learning with trading. Cheers!🥂
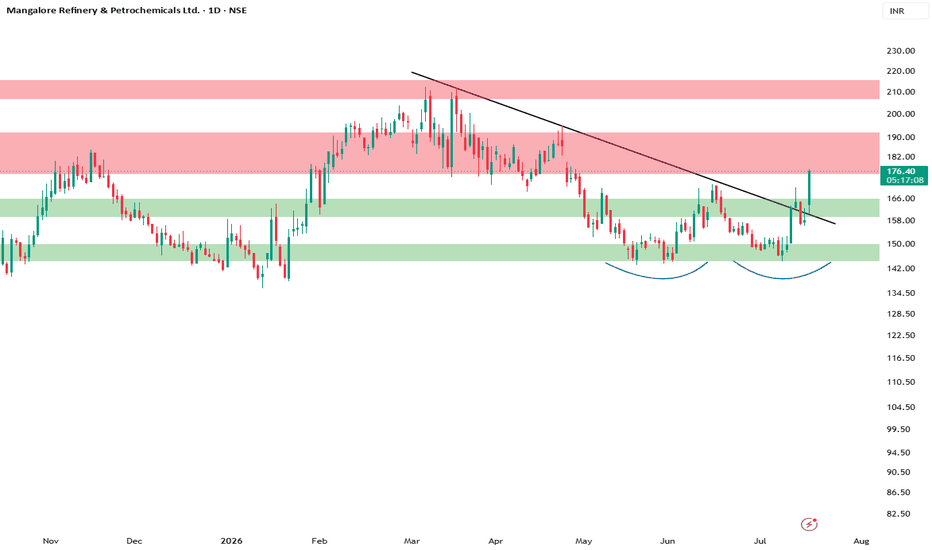
MRPL Breaks Long-Term Trendline – Bullish Structure EmergingMRPL has finally broken above its long-term descending trendline with strong bullish momentum, indicating a possible trend reversal. The stock is also forming a higher low structure, which adds strength to the breakout.
Key Levels:
Immediate Support: 165–166
Major Support: 158–160
Resistance 1: 188–190
Resistance 2: 208–212
As long as the price holds above 165–166, the breakout remains valid. A sustained move above 188–190 could open the way towards 208–212 in the coming sessions.
Traders should wait for confirmation and manage risk accordingly, as retests after a breakout are common.
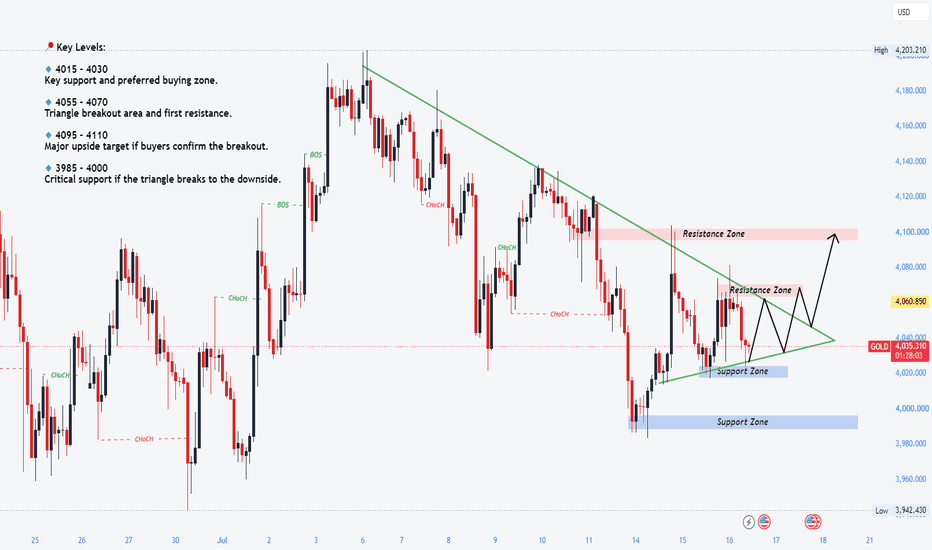
Gold triangle decision nears - bulls still hopefulGold continues to trade inside a tightening H2 symmetrical triangle, with both buyers and sellers gradually losing momentum. Price has tested the descending trendline several times without a confirmed breakout, while higher lows continue to form above the ascending support. This compression suggests volatility is decreasing, with a larger directional move likely once the range is broken.
From a technical perspective, the overall recovery scenario remains valid as long as price holds above the current support zone. However, the market still needs a decisive breakout above the triangle and nearby resistance to confirm bullish continuation. Until then, the preferred approach is to scalp within the range and prepare for a momentum trade once the breakout is confirmed.
📍 Key Levels:
🔹 4015 – 4030 Key support and preferred buying zone.
🔹 4055 – 4070 Triangle breakout area and first resistance.
🔹 4095 – 4110 Major upside target if buyers confirm the breakout.
🔹 3985 – 4000 Critical support if the triangle breaks to the downside.
✅ Preferred Scenario:
✔️ Gold continues respecting the triangle structure while holding above 4015–4030.
✔️ Intraday traders can continue scalping within the range until a confirmed breakout occurs.
✔️ A sustained move above 4055–4070 would validate bullish continuation and increase the probability of an extension toward 4095–4110.
✔️ If support fails and the triangle breaks lower, gold could revisit 3985–4000 before establishing a new direction.
IB: Awakening from a Multi-Year Slumber? Massive Volume SightingOverview:
Indiabulls Limited (NSE: IBULLSLTD) is printing a fascinating setup on the daily (1D) timeframe. After experiencing a catastrophic macro downtrend from its historical highs (near ₹590+) down to the single digits (₹6.70 low), the stock spent years in a dormant, sideways accumulation phase. However, recent price action indicates a violent wake-up call, characterized by explosive volume and a sharp upward surge to current levels around ₹31.58.
Key Technical Observations:
Unprecedented Volume Influx: The most striking feature on this chart is the massive cluster of volume bars accompanying the recent price spike. This level of volume hasn't been seen in years, strongly suggesting institutional interest, operator activity, or a major fundamental catalyst driving accumulation.
Multi-Year Base Breakout Attempt: The stock has broken out of its prolonged horizontal stagnation zone. It is currently attempting to establish a new higher-high, higher-low market structure, marking a potential macro trend reversal.
Overheated Momentum (RSI): The Daily RSI is currently sitting high at 73.08, slightly above its moving average (71.19). While this confirms incredibly strong bullish momentum, it also places the stock firmly in overbought territory, making it susceptible to short-term pullbacks or sideways chop to cool off the indicators.
Key Levels to Watch:
Immediate Resistance: The recent swing high cluster near ₹40.00 - ₹50.00. Clearing this zone with sustained volume is required for the next massive leg up.
Immediate Support: The recent breakout base and psychological support zone between ₹20.00 - ₹25.00.
Conclusion & Verdict: HOLD / BUY ON DIPS
This is a high-risk, high-reward scenario typical of "fallen angel" stocks.
For Existing Positions: HOLD. If you caught the move early, trailing your stop-loss below the recent daily lows is the best strategy to ride the momentum while protecting profits.
For New Entries: Chasing here is risky due to the overbought RSI and extended price. Wait for a healthy retracement, a bullish flag formation, or a consolidation period near the ₹25-₹28 levels before initiating a new BUY position.
Disclaimer: Stocks with this level of historical volatility carry significant risk. This analysis is for educational purposes only and does not constitute financial advice. Always use strict stop-losses and manage your position sizing carefully.
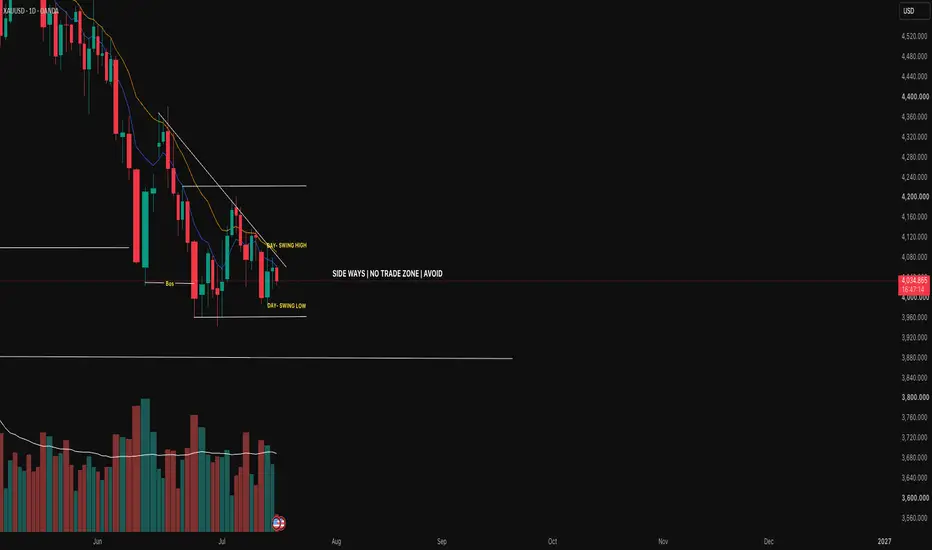
Market Bias: Market Bias:
📉 Bearish but currently consolidating.
Key Levels:
🔴 Resistance → 4100, 4220
🟢 Support → 4000, 3880
Liquidity Zones:
💰 Buy Stops → Above 4100
💰 Sell Stops → Below 3980
Best Setup:
Sell rejection from 4100 supply zone.
Retail Trap:
Middle of the range around 4030–4060.
Trade Probability:
📉 Bearish: 45%
📈 Bullish: 40%
XAUUSD is currently in a sideways accumulation phase. I will avoid trades inside the range and wait for a liquidity grab followed by confirmation.
Final Rule:
If price stays below 4100, my bias remains bearish. If price closes above 4100 and breaks 4220, my bias turns bullish.
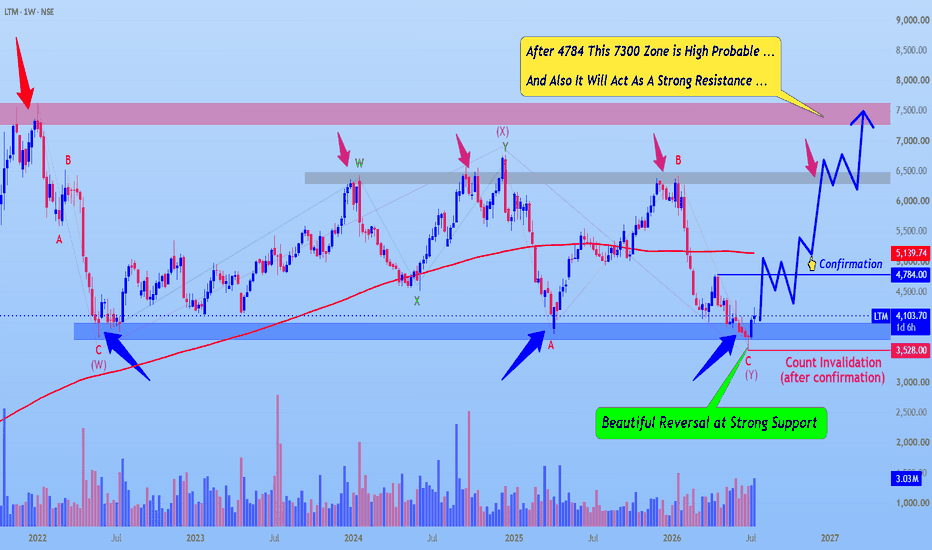
LTM Looks Interesting || 4,784 is The Key Level To Watch ||A Classic Elliott Wave Reversal Setup. 🌊
LTM has once again bounced from a strong multi-year demand zone, the same level that has repeatedly attracted aggressive buying in the past. From an Elliott Wave perspective, the ongoing correction appears to be approaching completion, making this an interesting chart to monitor.
🔍 Elliott Wave Perspective
The chart suggests that LTM has completed a Double Three (W-X-Y) corrective pattern.
Wave (W): First corrective decline into the major support zone.
Wave X: Recovery rally before the next corrective phase.
Wave (Y): Final corrective leg, once again ending at the same historical demand area.
The repeated defense of this support increases the probability that the larger correction may be complete.
📌 Strong Historical Demand Zone
One of the strongest observations on this chart is how consistently buyers have defended the same support.
✅ Major reversal in 2022.
✅ Another strong reversal during 2025.
✅ Current price has once again reacted positively from the same demand zone.
When price repeatedly respects the same level over several years, that area becomes technically very significant.
✅ First Bullish Confirmation
Although the support looks promising, confirmation is still required.
The first bullish signal will be a decisive breakout above ₹4,784.
Until then, this remains a recovery attempt rather than a confirmed uptrend.
Once this level is reclaimed, market structure begins to shift in favor of the bulls.
🎯 Potential Upside Roadmap
If ₹4,784 is successfully reclaimed and sustained, the next important levels become:
₹6,400 Zone: Previous swing resistance where sellers have repeatedly entered the market.
₹7,300–₹7,600 Supply Zone: A major long-term resistance area that has rejected price multiple times in the past.
This upper zone is likely to witness profit booking and could become a strong obstacle before any larger breakout.
❌ Invalidation
After a confirmed breakout above ₹4,784, the bullish Elliott Wave count remains valid as long as price holds above ₹3,528.
A sustained move below this level would invalidate the current bullish scenario and require a fresh wave count.
📈 Trading Plan
Bullish Confirmation: Above ₹4,784
Invalidation: Below ₹3,528 (after confirmation)
Resistance 1: Around ₹6,400
Resistance 2: ₹7,300–₹7,600
The chart is currently at an attractive location from a risk-reward perspective. However, support alone is not enough—confirmation is essential. Let the market prove its strength before expecting a sustained rally.
Warning ⚠
This analysis is for educational purposes only and represents an Elliott Wave interpretation, not financial advice.
#LTM #ElliottWave #DoubleThree #TechnicalAnalysis #PriceAction #SwingTrading #PositionalTrading #TradingView #StockMarket #NSE #SupportAndResistance #WaveAnalysis #Investing #ChartAnalysis #DIVISLAB #ElliottWave #RunningTriangle #TriangleBreakout #SwingTrading #PositionalTrading #StockMarket #NSE #TechnicalAnalysis #TradingView #PriceAction #WaveAnalysis #Investing #ChartAnalysis #TradingView #Forex #PriceAction #NikhilKanal #iElliottician #IndianEW #EWinHindi #XAUUSD #Gold #ElliottWave #BNF #NIFTY
NZDUSD: The Rally Faces Its First Real ObstacleEvery strong bullish move eventually reaches a point where it has to prove whether it still has enough strength to continue. For NZDUSD, that moment may have arrived.
Price has climbed steadily from the recent low and is now testing a resistance zone that previously triggered strong selling pressure. So far, buyers have controlled the recovery. The key question is whether they still have enough momentum to break through this barrier.
What interests me most is not the resistance itself, but how price reacts around it.
If buyers fail to establish acceptance above this area and bearish rejection begins to appear, the current advance could simply be a corrective rally within a broader weak structure. In that scenario, a return toward 0.57500 would become increasingly realistic.
A clean breakout and sustained trading above resistance would tell a completely different story. Until that happens, I prefer to respect this selling zone rather than assume it will be broken.
This is only my personal interpretation of the current market structure and should not be considered financial advice. Waiting for confirmation and managing risk remain the most important parts of every trading decision.
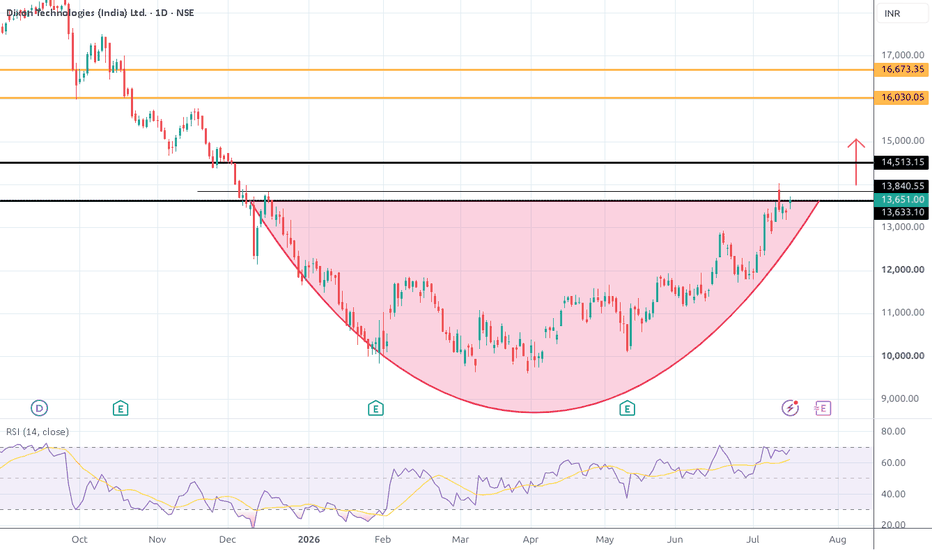
dixon for intraday todayTOday dixon looking good on prevolume in early hours, bids have crossed more than 80 percent of last 7 days premarket volume, now, also news is good by government scheme.
on the daily chart , there is curve breakout,
trading strategy, buy if candle closes above 13800 in 15 minutes with sl at 13500, for tgt 14 200 14400 and 14700 good for intraday