Long
Long
 Long
Long
 Long
Long
 Long
Long
Gujarat Fluorochemicals Ltd. (NSE: FLUOROCHEM)🏆 Stock Setup of the Day | Gujarat Fluorochemicals Ltd. (NSE: FLUOROCHEM)
📈 Timeframe: Weekly Chart
🚀 Fresh Breakout Into a Major Resistance Zone
Gujarat Fluorochemicals has staged an impressive recovery from the February 2026 lows and has now broken above a key resistance level around ₹4,000, indicating renewed bullish momentum.
🔹 Current Price: ₹4,082
🔹 Breakout Level: ₹4,000
🔹 Major Target Zone: ₹5,250
🔹 Potential Upside: ~22%
📊 Technical View
✅ Strong weekly breakout with bullish price structure
✅ Higher Highs & Higher Lows confirm an uptrend
✅ Price has reclaimed an important resistance after a prolonged consolidation
✅ Momentum remains positive while price sustains above the breakout zone
👀 Key Levels to Watch
🟢 Support: ₹4,000–₹3,950
🎯 Target Zone: ₹5,200–₹5,250
📌 A sustained move above ₹4,000 could keep the medium-term trend firmly bullish. Watching for follow-through buying in the coming weeks.
⚠️ Disclaimer: This is purely a technical chart analysis for educational purposes and should not be considered as investment or trading advice. Please do your own research and follow proper risk management.
🔥 Follow the channel for daily high-probability breakout setups and technical analysis.  Long
Long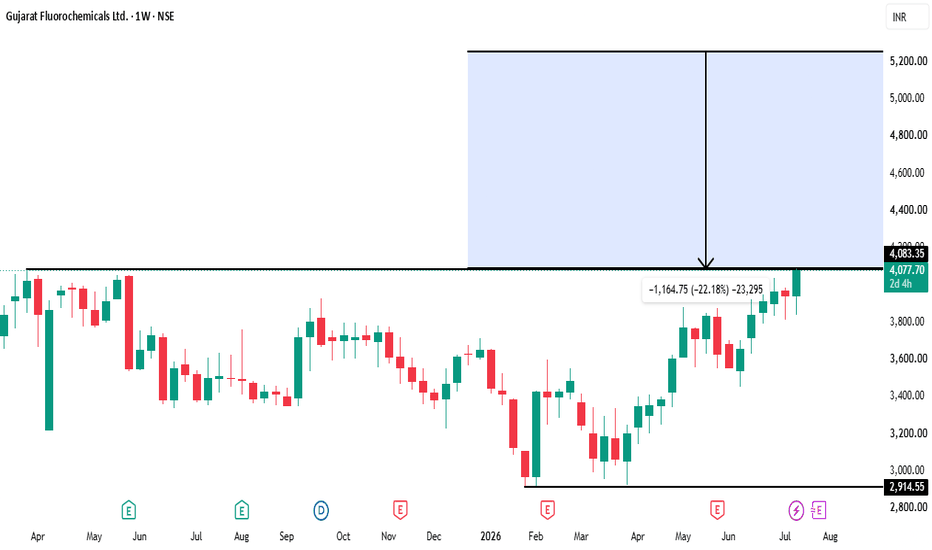
 Long
Long
 Long
Long
 Long
Long
XAUUSD – Gold Rebounds After CPI, But Still Needs Confirmation XAUUSD – Gold Rebounds After CPI, But Still Needs Confirmation
Gold is reacting positively after softer CPI data, but price is still at a key decision zone.
Currently trading around 4,026, gold bounced strongly from the lower liquidity area, showing buyers are stepping in. However, the move is now testing resistance and FVG, so confirmation is still needed.
FUNDAMENTAL ANALYSIS
Softer CPI supports gold by easing rate hike expectations. However, one report is not enough to shift the broader outlook. Traders will continue watching Fed signals, USD, and bond yields.
For now, CPI gives short-term support, but not a full trend change.
TECHNICAL ANALYSIS – SMC + MARKET STRUCTURE
Gold swept liquidity below and reacted strongly from demand, showing seller weakness.
Key support is 4,014 – 4,024. If price holds above this zone, recovery can continue toward resistance.
Resistance levels:
4,040 – 4,055
4,055 – 4,080
4,100
If price breaks below 4,014, gold may drop back to 3,985 – 3,995.
KEY PRICE ZONES
Current price: 4,026
Support: 4,014 – 4,024
Lower zone: 3,985 – 3,995
Resistance: 4,040 – 4,055
FVG: 4,055 – 4,080
Target: 4,100
Bearish below: 4,014
Invalidation: Below 3,985
TRADING SCENARIOS
Buy Scenario
Buy Zone: 4,014 – 4,024
Entry: Bullish reaction or CHoCH
SL: Below 4,014
TP1: 4,040 – 4,055
TP2: 4,080
TP3: 4,100
Breakout Buy
Above 4,055 → Target 4,080 – 4,100
Sell Scenario
Sell below 4,014 after confirmation
TP1: 3,995
TP2: 3,985
Invalidation: Reclaim 4,014 – 4,024
MY VIEW
Gold is recovering after CPI, but structure confirmation is still needed.
If 4,014 – 4,024 holds, price can move higher toward 4,055 and 4,100.
If not, the bounce may fade and price could return to lower liquidity.
Gold is recovering — but support must hold.
Do you think gold will hold above 4,014 – 4,024 or drop back lower?
 Long
Long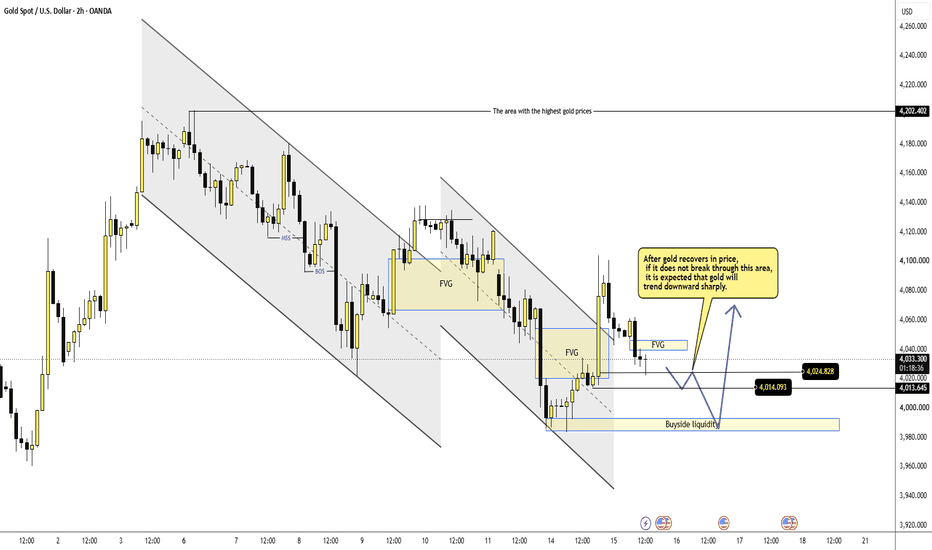
 Short
Short
XAUUSD 4000 sweep — 4080 is the draw XAUUSD 4000 sweep — 4080 is the draw
That bounce from sub-4,000 is not random.
Gold got slammed through the channel, cleaned lows, then snapped back above the liquidity sweep zone around 3,992 - 4,000. Yeah, that looks like a seller trap to me.
But don’t get too excited yet.
Price is still fighting under the EMA stack. 4,045, 4,049, 4,064, then 4,080. That whole area is sitting above price like traffic. So this is not clean bullish continuation yet. It is a recovery setup from discount.
Macro helps a bit too. Softer US CPI gives gold some breathing room because traders start pricing a less aggressive Fed. USD paused after that. Makes sense. But tension around the US-Iran story and rate expectations can still keep upside capped. So I’m not calling for a straight moonshot here.
Main read is this: sweep low first, reclaim later.
If gold holds above 4,000 and starts reclaiming 4,045 - 4,050, then buyers can push into 4,064. Above that, 4,080 becomes the real draw. That’s where I expect the next fight.
Trading scenario:
Buy idea only if price holds the liquidity sweep zone around 3,992 - 4,000 and reclaims back above 4,045.
Entry zone: 4,000 - 4,023 after confirmation
Stop loss: below 3,985
TP1: 4,045
TP2: 4,064
TP3: 4,080 - 4,088
No reclaim, no buy. Don’t chase the bounce in the middle.
If gold breaks hard below 3,985, this trap idea is dead. Then sellers can drag it back toward 3,972 and maybe lower.
For now, I’m watching the 4,000 sweep hold.
You think sellers got trapped here, or does gold need one more low first?
Long 
 Long
Long
 Long
Long
Gold Structure stays bearishWhere we are: Gold is at 4,030, down about 0.5% on the day, sitting right on the daily support at 3,999 and inside the bottom of the weekly demand shelf.
The inflation report was softer than expected across every line. Core MoM printed 0% against a 0.2% forecast. Core YoY came in at 2.6% versus 2.8% expected. Headline MoM was -0.4% and headline YoY dropped to 3.5% from 4.2%. That is a clean disinflation print. On paper that is fuel for gold.
Gold sold off instead. When a market gets the news it wanted and still falls, that tells you sellers are in control regardless of the story. That is not a small detail. It means the bounce we were watching for off the demand shelf did not get the follow-through it needed, even with the perfect setup handed to it.
Intermarket
The macro read got worse again. The driver split is now 100% bearish, 0% bullish, 0% neutral. Every single driver on the panel is against gold. Real yields at 2.36% and rising, dollar at 100.82 and rising, breakevens falling, gold/silver rising, miners underperforming, gold in euro terms falling, and gold versus the S&P falling. There is nothing left on the bull side of the ledger.
That is the answer to why soft CPI did not help. Yields and the dollar did not care. Until those two turn, gold is swimming against the current no matter what the inflation data says. The only mild positive left is the forward 20-bar probability at 51.8%, which is basically a coin flip.
Daily
Structure stays bearish, lower high and lower low. Resistance sits far above at 4,180 and support is right here at 3,999, less than 1% away. Price is inside the weekly demand zone at 4,059 to 3,884, but it is now leaning on the lower half of it rather than bouncing from the top.
The trendline chart is the one worth studying today. Price is sitting right on the long-term rising support line that has held since the move started, and it has already touched it nine times. Above it, the descending resistance line from the February high keeps capping every rally. Those two lines are closing in on each other, and price is being squeezed between them. A trendline tested nine times is not a strong line, it is a tired one. Each touch takes a little more out of it.
H4
Bearish structure, lower high and lower low. Resistance is now 4,076, only about 1% up, and support is 3,993. Look how that ceiling keeps dropping. Last week it was 4,120. Now it is 4,076. Lower resistance on every attempt is the market telling you sellers are getting more aggressive, not less.
Price is jammed under supply at 4,046 to 4,076, with more stacked at 4,096 to 4,131 and 4,178 to 4,195 above that. There is a small fresh demand zone right at 4,014 to 4,034 that price is standing on right now. That is the last shelf before 3,993.
The 4H multi-timeframe read is nearly all red: 15m, 4H, 1D, and 1W all bearish, with only the 1H holding a bullish lean. That single green box is the entire bull case right now.
Today's Data
PPI at 18:00 is forecast at 0%, cooling hard from a 1.1% prior. Another soft inflation reading. But watch what happens, because yesterday proved soft data alone is not enough to lift gold. If PPI comes in soft and gold still cannot rally, that is confirmation that sellers own this market and the demand shelf is likely to break.
Warsh testifies again at 19:30. If his tone leans firm on rates, the dollar and yields go up and gold has no cushion left.
Bottom Line
Gold got the soft CPI it needed and could not rally. That is the read of the week. The macro is 100% bearish, structure is bearish on every timeframe but one, resistance keeps stepping lower, and price is now leaning on the bottom of the weekly demand shelf instead of bouncing off the top.
The 3,999 to 3,884 zone is the last line, and it is looking weaker than it did on Monday. Lose 3,884 on a daily close and there is very little between here and the monthly demand at 3,453. That is a wide gap and the move can come fast.
For the bounce case, you now need more than a soft number. You need to see price reclaim 4,076, then 4,131, with real volume behind it. Until that happens, treat every push up into 4,046 to 4,076 as a place where sellers are waiting, with the descending trendline backing them up.
The plan: sellers have the evidence on their side, so rallies into supply are the cleaner trades. Longs need to wait for proof, not hope. IOL Chemicals & Pharmaceuticals-Near a Multi-Year Breakout Zone
IOL Chemicals & Pharmaceuticals is trading near its highest level since 2020—effectively a nearly six-year high. The stock has moved above the ₹143–145 resistance zone and is now approaching the major historical resistance area around ₹180–182.
Technical observations
Price is trading above its key moving averages.
Weekly volume has started expanding during the recent advance.
Price action near the highs is relatively tight, indicating limited immediate selling pressure.
RSI is rising, reflecting improving momentum.
The broader Chemicals Index is near its all-time high and continues to maintain a higher-high, higher-low structure.
The Pharma sector is also holding up reasonably well.
A decisive weekly breakout and sustained close above the ₹180–182 zone could indicate a transition into a stronger Stage 2 advancing phase. Until that happens, the stock remains close to major historical resistance, so the breakout should not be anticipated blindly.
Key risks
The stock has moved sharply and is currently significantly extended from its 50-day moving average. This increases the possibility of a sudden pullback, volatility, or time-wise consolidation—even if the broader structure remains constructive.
Other risks include:
Ongoing geopolitical tensions and market-wide volatility
Sentiment-driven selling in small-cap stocks
Failed breakout or rejection near the historical resistance zone
Poor risk-to-reward for late entries after a steep vertical move
This post is intended only for studying price structure, volume behaviour, sector strength and stage analysis. It is not a trade recommendation and contains no suggested entry, target or stop-loss.
Do your own research, understand the business and assess the risks before taking any decision. I am not a SEBI-registered research analyst. Consult a qualified financial adviser where necessary.  Long
Long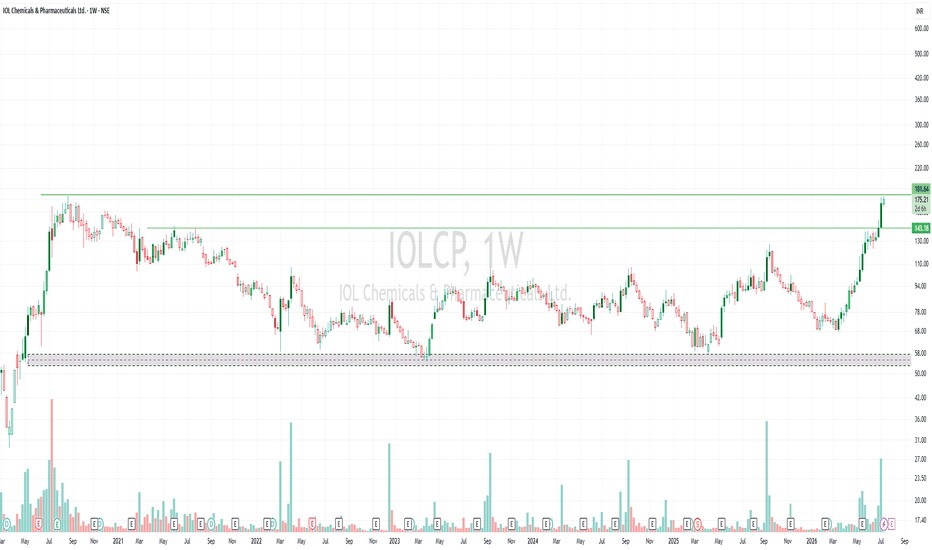
 Long
Long
HFCL Limited (1W): Decoding the 2,700%+ Macro Rally & SM InflowOverview: HFCL Limited (NSE: HFCL) is displaying absolute dominance on the weekly (1W) timeframe. The stock is currently in a powerful, parabolic uptrend, trading near the ₹223 zone. This isn't just a technical rally; it is heavily backed by a massive influx of institutional capital, making it a prime candidate for momentum and trend traders.
Fundamental Catalyst (The "Smart Money" Factor):
The most striking element of this setup is the massive surge in Foreign Institutional Investor (FII) interest. As noted on the chart, HFCL appeared on the "14 FII Standouts" screener.
FII Holdings have more than doubled, jumping from 7.1% in March 2026 to a staggering 15.7% in June 2026 (QnQ).
Major New Entrants include heavyweight funds like BNP Paribas Financial Markets, Quadrature Capital Vector Sp Limited, and Smallcap World Fund, Inc. This kind of institutional accumulation provides immense structural support to the ongoing rally.
Key Technical Observations:
Macro Breakouts: The stock has successfully cleared multiple historical resistance ceilings, most notably breaching the ₹61.80 and ₹170.76 levels. It has recently pushed past the ₹221.48 mark, marking an extraordinary multi-year climb from its absolute bottom (a 2,700%+ structural move).
Moving Average Ribbon: The price is trading significantly above its primary weekly MA Ribbon (with the closest band at ₹157.12 and the deepest at ₹91.35). While this confirms an incredibly strong bullish trend, the wide separation also suggests the price is highly extended.
Overbought RSI: The weekly RSI is currently sitting high at 86.09 (above its MA of 84.01). While an RSI this high indicates extreme buyer enthusiasm and momentum, it also warrants caution for a potential short-term cooling off or sideways consolidation before the next leg up.
Key Levels to Watch:
Immediate Resistance: The recent swing high of ₹229.50. A weekly close above this opens the door to the psychological ₹250.00 level.
Immediate Support: The recent breakout zone at ₹221.48.
Macro Support: If a deeper mean-reversion occurs, the ₹170.76 structural level and the top of the MA ribbon (₹157.12) will act as major demand zones.
Conclusion:
The trend is your friend, and HFCL's trend is undeniably up. The aggressive FII buying justifies the premium valuation and the parabolic technical structure. For existing holders, trailing stop-losses below key weekly lows makes sense. For new entries, chasing here carries risk due to the overbought RSI; waiting for a slight retracement or a flag consolidation might offer a safer risk-to-reward ratio.
Disclaimer: This analysis is for educational purposes only and does not constitute financial advice. Please do your own research and manage your risk accordingly.  Long
Long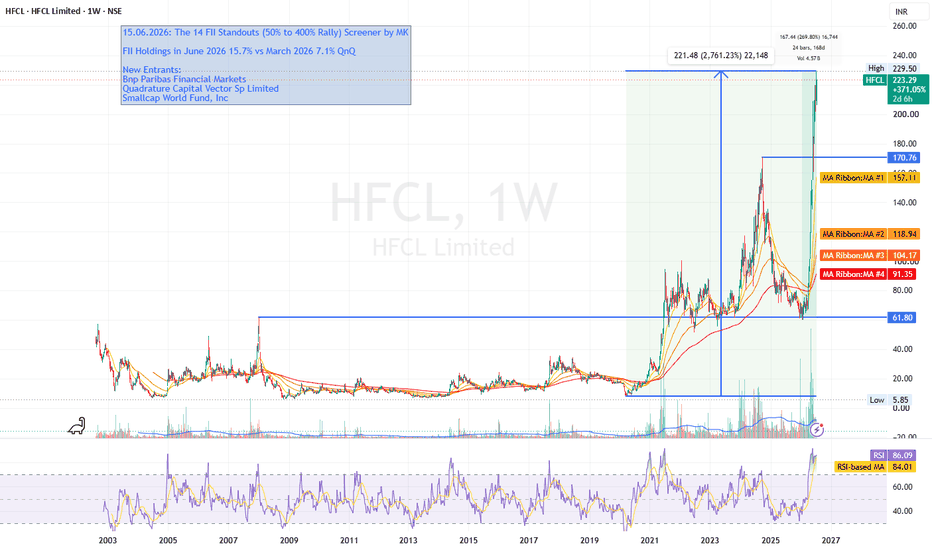
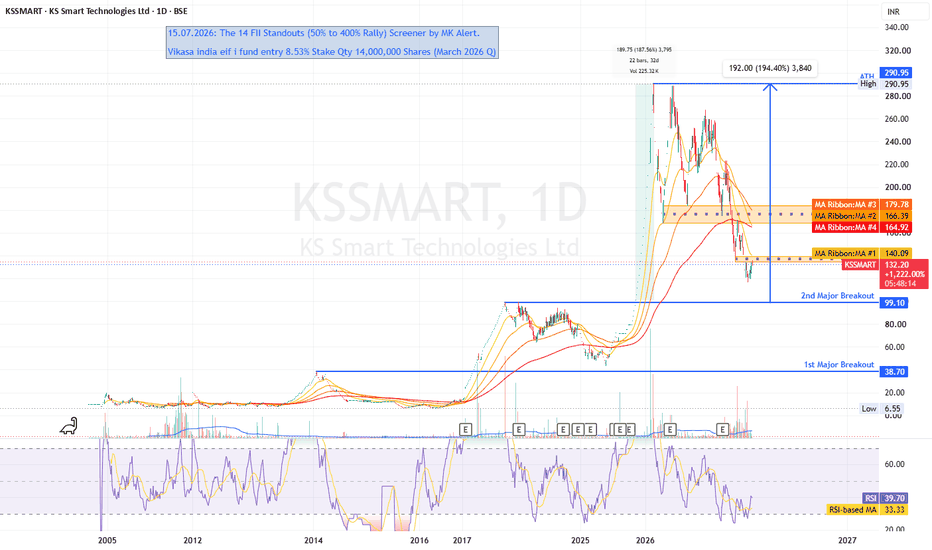
KSSMART: Massive FII Entry & Deep Retracement – A Hidden Setup?Overview: KS Smart Technologies Ltd (BSE: KSSMART) has experienced extreme volatility recently, going through a parabolic rally followed by a deep retracement. After hitting an All-Time High (ATH) of ₹290.95, the stock has corrected significantly and is currently trading around the ₹135.00 zone. However, a major fundamental catalyst combined with key support levels makes this an interesting chart to watch.
Fundamental Catalyst (The "Smart Money" Factor):
A critical detail driving the macro narrative is the significant institutional interest. KSSMART recently appeared on the "14 FII Standouts (50% to 400% Rally) Screener." More importantly, the Vikasa India EIF I Fund has entered with a massive 8.53% stake (14,000,000 shares) as of the March 2026 quarter. This strong Foreign Institutional Investor (FII) backing suggests long-term conviction despite the recent price correction.
Key Technical Observations:
Historical Breakouts: The chart clearly defines two massive structural breakouts. The "1st Major Breakout" occurred near ₹38.70, and the "2nd Major Breakout" happened at ₹99.10. Both levels serve as powerful historical reference points.
Current Price Action & Moving Averages: The stock has pulled back below its primary Moving Average Ribbon (which currently ranges from ₹140 to ₹179). The price is actively consolidating near the ₹135 level. To regain a strong bullish trend, the price will need to reclaim and close above this MA ribbon.
RSI Divergence / Recovery: The RSI on the daily timeframe is currently sitting at 41.32, having recently crossed above its RSI-based moving average (33.45). This indicates that the bearish momentum is cooling off, and we may be seeing early signs of a base forming.
Key Levels to Watch:
Immediate Resistance: The bottom of the MA ribbon at ₹140.36, followed by the heavier overhead resistance zone between ₹165 - ₹180.
Macro Target: The All-Time High at ₹290.95.
Critical Support: The ₹130 level is providing immediate support, but the ultimate macro support sits at the "2nd Major Breakout" line of ₹99.10. A breakdown below ₹99 would invalidate the broader bullish structure.
Conclusion:
KSSMART is currently in a "show me" phase. The deep pullback has washed out weak hands, bringing the price back to a more reasonable valuation following its 190%+ rally. With heavy FII backing, this zone between ₹100 and ₹135 could act as a significant accumulation area. Watch for a strong volume breakout above the ₹140 moving average to confirm the next leg up.
Disclaimer: This analysis is for educational purposes only and does not constitute financial advice. Please manage your risk and position sizing carefully.  Long
Long