Bharti Airtel: Weekly Range BreakoutThe weekly chart for Bharti Airtel displays a textbook bullish continuation setup emerging from a multi-week consolidation pattern. The stock is currently gathering momentum just below a multi-year high, preparing for a potential large-scale breakout.
Technical Breakdown
Price Action & Structure: The chart highlights an "Expected Range Breakout" following a healthy corrective accumulation phase (denoted by the pink box). The price has rallied sharply off its lower bounds and is currently trading at ₹1,953.50, resting right at the "Entry Above" trigger line.
Supertrend Dynamics: The weekly Supertrend (7, 2) is currently tracking overhead at ₹1,968.19. The chart notes that the “Super Trend Weekly About to change above 1968,” meaning a decisive weekly close above this level will flip the indicator green and confirm a powerful structural trend shift.
Williams %R (25) Alignment: The indicator is printing at -32.70 and pointing sharply upwards. As noted on the chart ("Williams %R Encouraging the Trend Momentum"), this aggressive upward slope proves that buyers are rapidly stepping in, supplying the velocity needed to clear the overhead resistance.
Execution Trigger,"Above ₹1,953.50 – ₹1,968.20" : Enter either at current market price (CMP) or upon confirmation of the weekly Supertrend flip (>₹1,968.20)
Stop Loss (SL),"₹1,865.00(Weekly Close)",Placed safely below the recent weekly swing low and structural range.
Primary Target,"₹1,982.87",Immediate minor liquidity pool / resistance.
Target 2 (T2),"₹2,162.70",Structural extensions mapped from the prior consolidation range.
Target 3 (T3),"₹2,222.00",Major psychological and pattern expansion target.
Disclaimer: aliceblueonline.com NIFTY ANALYSIS | WEDNESDAY,15 JULY 2026 |DAILY→4H→1H → 15-MIN TF# 📊 NIFTY ANALYSIS | WEDNESDAY, 15 JULY 2026 | DAILY → 4H → 1H → 15M → 5M 🔥
**Previous Close:** **24,052.05**
**Change:** **-158.95 (-0.66%)**
NIFTY ended lower after facing sustained selling pressure throughout the session. The index failed to hold above the important **24,100-24,120** zone and closed just above the psychological **24,000** support. The latest option chain shows **aggressive Call writing at 24,100** and **strong Put support at 24,000**, suggesting institutions expect a battle around these levels before the next directional move. Markets continue their favorite hobby: making both bulls and bears feel clever for about twenty minutes each.
---
# 📌 PREVIOUS SESSION OHLC (14 JULY 2026)
* **Open:** 24,068.00
* **High:** 24,157.10
* **Low:** 24,023.70
* **Close:** **24,052.05**
---
# 📈 DAILY CHART ANALYSIS
* Price closed below the short-term moving averages after failing to sustain above 24,150.
* Volume Profile shows rejection from the **POC near 24,213**, confirming heavy overhead supply.
* The broader trend remains inside a consolidation, but short-term momentum has shifted to the bears.
* RSI cooled near the neutral zone, indicating momentum has weakened without entering oversold territory.
* Bulls must reclaim 24,120 to regain control.
---
# 📊 DAILY FIBONACCI LEVELS
**Swing High:** 26,354.05
**Swing Low:** 22,184.45
| Fibonacci Level | Price |
| --------------- | ------------: |
| 23.6% | **23,168.50** |
| 38.2% | **23,777.25** |
| 50.0% | **24,269.25** |
| 61.8% | **24,761.25** |
| 65.0% | **24,894.70** |
| 78.6% | **25,461.75** |
| 1.618 Extension | **26,098.50** |
### Institutional Interpretation
* NIFTY remains below the **50% Fibonacci level (24,269)**.
* As long as price trades below 24,269, rallies may continue to face supply.
* Long-term recovery remains intact while **23,777** holds.
---
# 🏦 MARKET BIAS
🟢 **Bullish Above:** **24,120**
🟡 **Range Bound:** **24,000 – 24,120**
🔴 **Bearish Below:** **24,000**
---
# 🏛️ INSTITUTIONAL VIEW
### Market Regime
Consolidation with a bearish short-term bias.
### Control
Call writers remain dominant above 24,100 while put writers defend 24,000.
### Immediate Resistance
* 24,100
* 24,120
* 24,213 (Volume Profile POC)
* 24,270
### Immediate Support
* 24,000
* 23,950
* 23,900
* 23,777
---
# 📊 OPTION CHAIN VIEW
### ATM Strike
**24,000**
### Maximum Call OI
✅ **24,100** (97,903)
### Maximum Put OI
✅ **24,000** (81,899)
### Fresh Call Writing
* **24,100** (Strongest)
* 24,200
* 24,300
* 24,400
* 24,500
### Fresh Put Writing
* **24,000** (Strongest)
* 24,100
* 23,800
* 23,700
* 23,600
### Institutional Interpretation
* Heavy Call writing at **24,100** creates the first major resistance.
* Strong Put writing at **24,000** provides immediate downside support.
* Expect consolidation between **24,000 and 24,100** unless one side absorbs the institutional positions.
---
# 📊 VOLUME PROFILE ANALYSIS
### Point of Control (POC)
**24,213**
### High Volume Node
**24,180 – 24,220**
### Interpretation
* Price remains below the POC, keeping sellers in control.
* Acceptance above **24,213** would improve bullish momentum.
* Failure to reclaim the POC keeps downside pressure intact.
---
# 🟢 HIGH PROBABILITY CE TRADE
### Setup
15-minute close above **24,120**
### Confirmation
* Successful retest
* RSI above 55
* Strong buying volume
### Stop Loss
24,050
### Targets
* **T1:** 24,180
* **T2:** 24,213
* **T3:** 24,270
### Probability
**35%**
---
# 🔴 HIGH PROBABILITY PE TRADE
### Setup
15-minute close below **24,000**
### Confirmation
* Failed retest of 24,000
* RSI below 45
* Strong selling volume
### Stop Loss
24,070
### Targets
* **T1:** 23,950
* **T2:** 23,900
* **T3:** 23,777
### Probability
**40%**
---
# 📈 MULTI-TIMEFRAME ANALYSIS
## 4H Timeframe
**Trend:** Neutral to Bearish
**Support:** 24,000 / 23,900
**Resistance:** 24,120 / 24,213
---
## 1H Timeframe
**Trend:** Bearish
Momentum remains weak below the Volume Profile POC.
---
## 15-MIN Timeframe
**Immediate Resistance**
* 24,100
* 24,120
* 24,213
**Immediate Support**
* 24,000
* 23,950
* 23,900
---
## 5-MIN EXECUTION PLAN
### CE Buyers
Enter only after a confirmed breakout above **24,120**.
Targets:
24,180 → 24,213 → 24,270
### PE Buyers
Enter after a confirmed breakdown below **24,000**.
Targets:
23,950 → 23,900 → 23,777
---
# 🎯 TRADING SCENARIOS
### 🟢 Scenario 1: Bullish Recovery
**Probability:** 35%
**Trigger:** Sustained move above **24,120**
**Targets:** 24,180 → 24,213 → 24,270
---
### 🟡 Scenario 2: Sideways Market
**Probability:** 40%
**Range:** 24,000 – 24,100
Avoid aggressive option buying inside this range.
---
### 🔴 Scenario 3: Bearish Breakdown
**Probability:** 25%
**Trigger:** Sustained move below **24,000**
**Targets:** 23,950 → 23,900 → 23,777
---
# ⚠️ INVALIDATION LEVELS
### Bullish View Invalid
15-minute close below **24,000**
### Bearish View Invalid
Sustained close above **24,120**
---
# 💡 KEY TRADER NOTE
* **24,000** is the session's most important support, reinforced by the highest Put Open Interest.
* **24,100** is the strongest resistance due to the highest Call Open Interest and aggressive fresh call writing.
* **24,213 (Volume Profile POC)** remains the key institutional resistance. Reclaiming it would significantly improve the bullish outlook.
* Until price breaks decisively outside **24,000-24,120**, expect a choppy market where patience is likely to outperform prediction.
#Nifty50 #TechnicalAnalysis #PriceAction #OptionTrading #StockMarketIndia #IntradayTrading #SwingTrading #BankNifty #Fibonacci #SupportAndResistance #Options #NSE #TradingStrategy #MarketStructure #VolumeAnalysis #SmartMoney #TechnicalCharts #MomentumTrading #IndianStockMarket #RiskManagement
 Short
Short
GOLD FACING RESISTANCE: BREAKOUT SOON?Despite ongoing geopolitical uncertainty supporting safe-haven demand, institutional flows remain reluctant to abandon the U.S. dollar. Treasury yields continue to hold at elevated levels while markets largely expect the Federal Reserve to maintain a cautious policy stance until inflation shows more convincing signs of easing. As a result, recent strength in gold appears to be driven more by short-term positioning than by a structural shift in macro fundamentals.
From a technical perspective, Gold continues to trade within a well-defined descending channel on the H2 timeframe. Although buyers managed to trigger a short-term Change of Character (CHoCH), price remains trapped beneath the descending trendline, where a confluence of previous Demand, Fibonacci 0.618, and dynamic resistance continues to cap upside momentum. This area represents a key institutional decision point rather than a simple resistance level.
The repeated attempts to challenge the trendline suggest buyers are gradually building pressure. However, without a confirmed Break of Structure (BOS), the broader bearish market structure remains intact. Today's final trading session of the week also increases the probability of liquidity sweeps and false breakouts before the weekly close, making confirmation more important than anticipation.
PRIMARY SCENARIO
Gold could extend its recovery toward the Demand + Descending Trendline + Fibonacci 0.618 confluence. If sellers successfully defend this area once again, price is likely to rotate back toward the 0.50 Fibonacci support, with the 0.382 level becoming the next downside objective.
ALTERNATIVE SCENARIO
Should buyers finally secure a decisive H2 close above the descending trendline and confirm a Break of Structure (BOS), it would suggest bearish momentum is fading. Such a breakout could trigger short covering and open the door for a broader recovery into higher premium zones. Until that confirmation appears, any breakout should be treated cautiously, particularly during Friday's lower-liquidity conditions.
MARKET VIEW
Current Bias: Bearish
Preferred Strategy: Sell the Rally – Wait Confirmation
LucasGrayTrading  Short
Short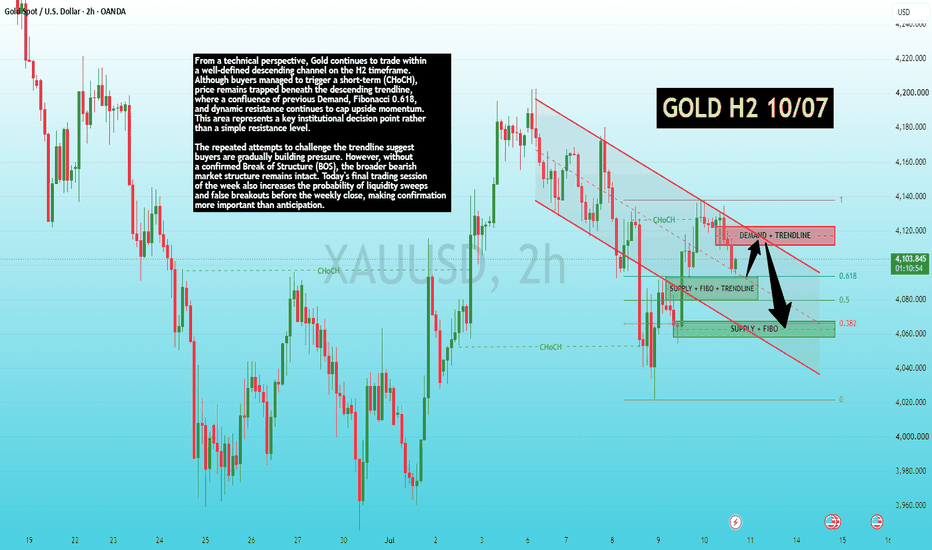
NIFTY 50 Weekly Expiry | Bulls vs Bears at Key Levels
Here's an analysis of the Nifty 50 on the 15m timeframe from the last completed session (2026-07-13):
Bottom line
The Nifty 50 exhibits a bullish structure on the 15m chart, but is currently facing immediate resistance, suggesting a cautious outlook.
Structure & trend
The price is trading above both its 20-period (24,186.7) and 50-period (24,179.9) Simple Moving Averages, indicating an underlying uptrend.
Check Out Daily Time Frame Chart
Price action shows a pattern of higher highs and higher lows, confirming the bullish trend.
Momentum, as per RSI14, is at 55.4, which is in the neutral-positive zone.
Key levels
Nearest support levels are observed at 24,207.2 and 24,184.0.
Immediate resistance levels are at 24,226.0 and 24,228.5.
The recent 15m window range was between 23,805.2 and 24,530.9.
What to watch
A sustained move and hold above the 24,228.5 resistance level would confirm further upside potential.
Conversely, a break and hold below the 24,184.0 support could invalidate the current bullish structure and open room for downside.
The intraday model is currently neutral with no confidence, suggesting a lack of strong directional conviction in the very short term. Understanding Retests After a Breakout: Why Patience PaysIntroduction
One of the most common questions beginner traders ask is: "Price just broke out — should I jump in right now?" The honest answer is almost always: wait and watch what happens next. This tutorial covers one of the most important concepts in technical analysis — the retest — and why understanding it can save you from a lot of false starts.
What Is a Retest?
When price breaks above a resistance level (or below a support level), it doesn't always continue in a straight line. Very often, price will pull back toward the level it just broke, "retest" it, and then either:
Hold — the old resistance now acts as new support (or vice versa for breakdowns), and price resumes in the breakout direction, or
Fail — price falls back through the level, suggesting the breakout was a false move
This behavior happens because the price level that acted as resistance for weeks or months doesn't just disappear the moment it's broken — it takes time for the market to "agree" that the level has flipped roles.
Why Retests Happen
Think of a resistance zone as a level where sellers have consistently shown up in the past. When price finally breaks above it, some of those same sellers may try one more time to push price back down, since they remember that zone as a place where selling worked before. If buyers are strong enough to absorb that selling and hold the level, it confirms the breakout is genuine. If buyers can't hold it, the breakout often fails.
How to Read a Retest
A few things to watch when a retest is happening:
Does the pullback stay shallow? A retest that barely dips back to the breakout level and quickly bounces is generally healthier than one that plunges deep back into the old range.
Is there a clear rejection candle at the level? A candle with a long wick and a strong close back above the breakout zone is a good sign buyers are defending the level.
What do the moving averages say? If a key EMA (like the 50 or 200) lines up near the retest zone, that adds confluence and makes the level more significant.
How many sessions does it take? Retests can resolve quickly (same day) or take several sessions. Give it time rather than reacting to the first candle after the breakout.
A Common Beginner Mistake
Many new traders buy the moment a breakout happens, driven by excitement or fear of missing out (FOMO). When the inevitable retest comes and price dips back toward the breakout zone, they panic and sell — right before the level holds and price continues higher. Understanding that retests are a normal part of price behavior, not a sign that something has gone wrong, can help you avoid this trap.
What a Failed Retest Looks Like
Not every retest holds. If price breaks back through the level with strong momentum and closes clearly below it (for an upside breakout), that's usually a sign the breakout has failed, and the prior range or downtrend may reassert itself. This is exactly why waiting for confirmation — rather than assuming every breakout will hold — protects you from getting caught on the wrong side.
Key Takeaway
A breakout is not the end of the analysis — it's often just the beginning of the real test. Whether price is testing a trendline, a horizontal support/resistance zone, or a chart pattern's boundary, the retest phase tells you far more about the strength of the move than the initial breakout candle does. Learning to wait for this confirmation, rather than chasing the first move, is one of the simplest ways to improve your trade timing.
Conclusion
Next time you see a breakout on your charts, resist the urge to act immediately. Watch how price behaves on the retest — that reaction will tell you whether the breakout has real conviction behind it or not. Patience during this phase is often the difference between a well-timed entry and an emotional, premature one.
For educational purposes only. Not financial advice. Education 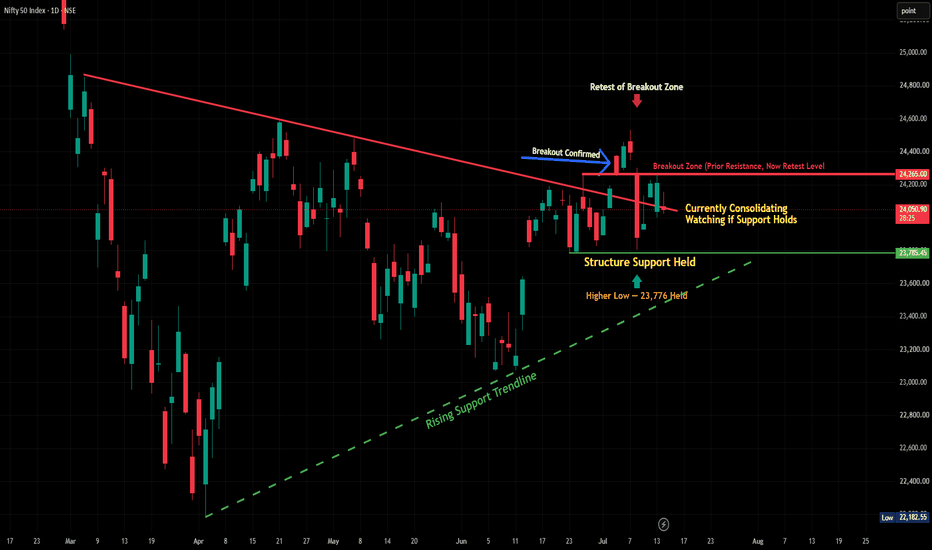
BRIAN XAUUSD – GOLD RECLAIMING FROM LOWER VALUE BEFORE CPI BRIAN XAUUSD – GOLD RECLAIMING FROM LOWER VALUE BEFORE CPI
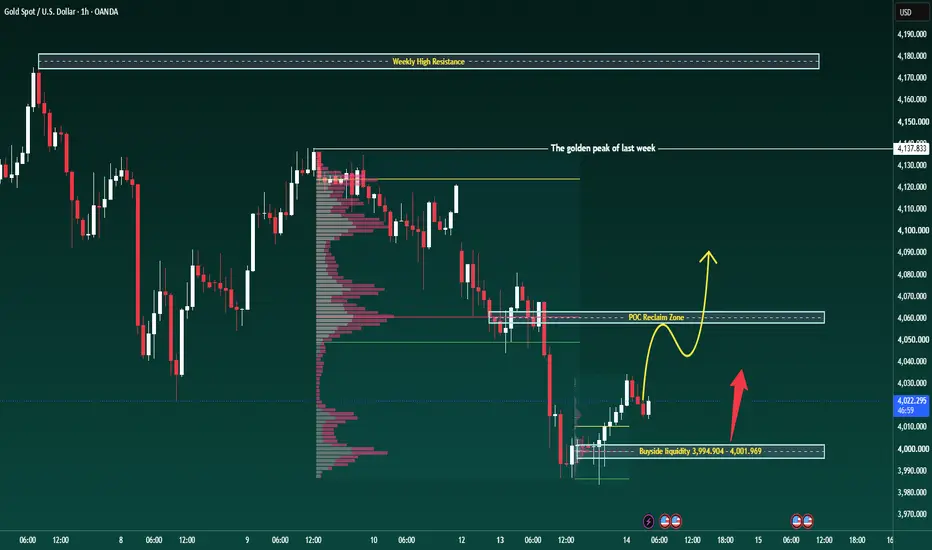
Gold is starting to recover from the lower value area after reacting around the buyside liquidity zone near 3,995 - 4,002. The move is not strong enough to confirm a full reversal yet, but price is no longer trading with clean downside continuation.
Today’s CPI release can become the main trigger for the next move. Headline inflation is expected to soften due to lower gasoline prices, but the real focus will be on core CPI. That number matters more because it shows whether underlying inflation is still sticky.
At the same time, Fed Chair Kevin Warsh’s first official monetary policy testimony may influence rate expectations and short-term USD direction. For gold, this creates a clear risk event: price can expand quickly once the market receives confirmation.
Technical structure
On the H1 chart, gold has reacted from the lower liquidity base and is now pushing back towards the POC Reclaim Zone around 4,055 - 4,060.
This is the key area I am watching. If price breaks and holds above this zone, buyers can start to rebuild acceptance and open the path towards the golden peak of last week near 4,137.
However, if gold fails at the POC Reclaim Zone, the rebound remains weak and price may rotate back towards the buyside liquidity area.
Important zones
Buyside liquidity: 3,995 - 4,002
Lower reaction zone where buyers stepped in.
POC Reclaim Zone: 4,055 - 4,060
Main value area buyers need to reclaim.
The golden peak of last week: 4,137
Next upside target if price accepts above POC.
Weekly High Resistance: 4,175 - 4,180
Major resistance if CPI triggers stronger bullish momentum.
Trading scenario
Buy reaction after POC reclaim 4,055 - 4,060
Entry:
Look for buy positions only if price breaks and holds above 4,055 - 4,060, then retests this zone with clear bullish rejection.
Stop Loss:
Below the POC Reclaim Zone or below the local swing low.
Take Profit:
TP1: 4,100
TP2: 4,137
TP3: 4,175 - 4,180 if CPI supports further upside
This setup is based on gold reclaiming value after reacting from lower liquidity. Without acceptance above the POC zone, the buy setup remains incomplete.
Final view
Gold is trying to recover before CPI, but the real confirmation is still at 4,055 - 4,060.
If buyers reclaim this POC zone, gold can continue towards 4,137 and possibly 4,175.
If price fails there, the market can rotate back towards 4,000 and the rebound becomes only a weak reaction from liquidity.
Today is not the day to chase candles. Let CPI confirm direction. Let price reclaim value. Then trade the reaction.
Long 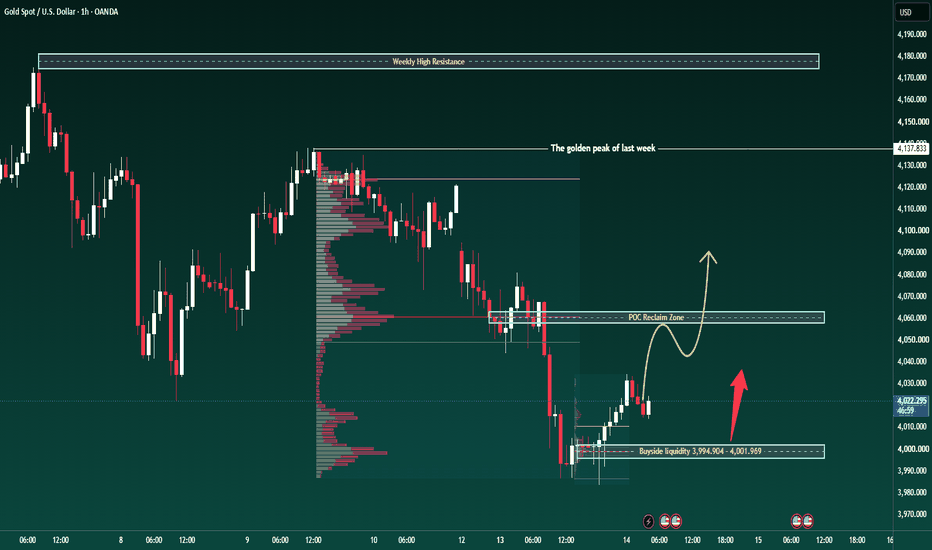
 Long
Long
 Long
Long
PREMIERENE Trend Continuation SetupRecent Updates for Premier Energies
Premier Energies has been making significant moves in the green energy sector, highlighted by major order inflows and robust capacity expansions:
1. Massive Order Book Boost: Premier Energies secured fresh orders worth ₹3,011 crore during the April–June quarter (Q1 FY27). The contracts involve supplying a total of 1,846 MW of solar cells and modules, with deliveries scheduled across FY2027 and FY2028. The orders come from a diverse mix of power producers, module manufacturers, and EPC companies. Read more on Saurenergy.
2. Rapid Capacity Expansion: The company is aggressively scaling up to meet booming domestic demand:
Solar Modules: Reached a capacity of 11.1 GW following the commissioning of its 5.6 GW facility in Seetharampur.
Solar Cells: Anticipated to skyrocket from 3.6 GW to 10.6 GW by September 2026 (accelerating its previous target timelines).
Current Price Action
Current Market Price (CMP): ₹1,055.70 (up +3.05% or +₹31.20 during the session).
Daily Range: Opened at ₹1,025.50, hit a high of ₹1,064.90, and a low of ₹1,021.60.
Trend Sign: The chart highlights a recent "Support Bounce" from the ₹1,012.90–₹1,021.60 zone, indicating buyers are stepping in at lower levels.
Key Trading Levels
The chart outlines a clear breakout setup with specific targets and risk management levels:
Entry Trigger: Above ₹1,055.70 (the current level is flagged right at the entry trigger line).
Stop Loss: Set strictly at ₹1,044.00 to limit downside risk if the support bounce fails.
Technical Indicators: The Williams %R (14) stands at -10.85, indicating the stock is entering overbought momentum territory on a short-term basis, aligning with the bullish bounce.
Forward-Looking Outlook
Expected Revenue Growth: Revenue is projected to grow at an average rate of 24% to 29% per annum over the next three years, outperforming the broader domestic semiconductor and solar component industry expectations in India.
Earnings Forecast: Annualized earnings growth is expected to sit at around 14.7%, with a robust forecast Return on Equity (ROE) of 25.6% over the next three years.
Strategic Factors to Watch: In upcoming quarterly earnings calls, the market will closely monitor the operational integration of its new subsidiary Transcon Industries (acquired in April) and updates regarding its fundraising plans aimed at a debt-free transition.
Key Performance Trends (Recent Quarters)
The company's financial performance has consistently outpaced earnings expectations even when revenues faced minor variance
Profitability & Margins: Net income growth has routinely outpaced top-line revenue growth due to expanding profit margins (climbing toward 18%–20%), driven by high capacity utilization and a strategic shift toward high-efficiency TOPCon technology.
Full-Year Benchmark: The company closed out the previous fiscal year with an EPS of ₹33.63 (surpassing average analyst estimates), a massive jump from ₹21.35 in the prior period.
Disclaimer: aliceblueonline.com Short 
XAUUSD — 3,983 Sparked the BounceXAUUSD — 3,983 Sparked the Bounce
Gold finally gave buyers a small window to breathe, but I do not think this is the kind of move we should read blindly as a full bullish reversal yet.
Price swept down into 3,983.545, grabbed the sell-side liquidity below the recent low, and then started climbing back toward 4,030.895. That reaction matters because the market did not just keep sliding after the sweep. It paused, absorbed the selling pressure, and began walking back up like it wanted to test whether late sellers were trapped near the lows.
For newer traders, this is the main story: when price breaks into a low, pulls liquidity, and then starts recovering, that low can become the starting point of a short-term bounce. In this case, I am leaning bullish while gold holds above 3,983.545, but I am treating it as a recovery move inside a still-heavy wider environment.
The USD has paused after its recent strength, and that gives gold room to rebound in the short term. But with CPI ahead, Fed commentary in focus, and geopolitical tension still supporting USD demand, I do not expect the upside to be completely clean. That is why the next reaction around 4,054.400 is important. If gold can hold above 4,030.895 and reclaim 4,054.400, the upper FVG around 4,085 - 4,100.355 becomes the next area price may want to revisit.
This bullish recovery idea becomes weak if gold loses 3,983.545 again and fails to recover. If that happens, the sweep did not hold, and sellers may start hunting deeper liquidity near 3,960.275.
Key price zones to watch
Current reaction area: 4,030.895
Main demand / sweep zone: 3,983.545 - 4,030.895
Bullish confirmation zone: 4,054.400
Main upside FVG target: 4,085 - 4,100.355
Upper resistance if recovery expands: 4,100.355
Lower support if buyers fail: 3,983.545
Major lower liquidity: 3,960.275
Invalidation: clean close below 3,983.545
Do you see this 3,983 sweep as the start of a real recovery, or just a bounce before CPI brings sellers back in?
Long 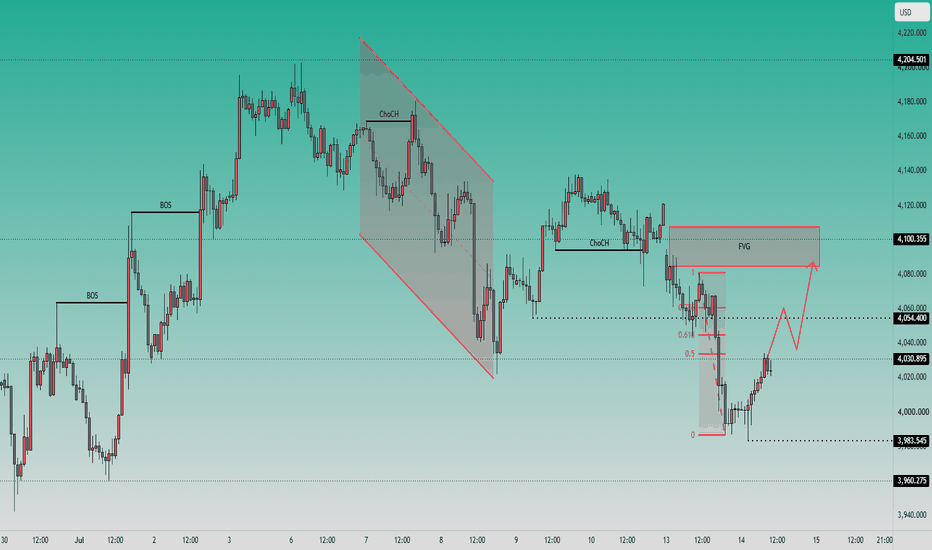
XAU/USD (Gold) 45-Minute Chart Analysis## **Market Overview**
The 45-minute XAU/USD chart shows that gold is attempting a short-term recovery after a strong bearish impulse. Price has bounced from a recent swing low near **4,000**, but it remains below the dominant resistance zone, indicating that the broader trend is still under pressure.
The multi-timeframe dashboard confirms this mixed market structure:
| Timeframe | Trend |
| --------- | ---------- |
| 5-Min | 🟢 Bullish |
| 15-Min | 🟢 Bullish |
| 45-Min | 🟢 Bullish |
| 4-Hour | 🔴 Bearish |
| Daily | 🔴 Bearish |
**Conclusion:** Short-term momentum favors buyers, while the higher-timeframe trend still favors sellers.
---
# **Trend Analysis**
### **Short-Term Trend (Bullish Recovery)**
* Price has produced a strong rejection from the recent low.
* Bullish candles are beginning to close above the lower dynamic trend band.
* Momentum is improving as buyers regain control on intraday timeframes.
This suggests a **corrective bullish move** rather than a confirmed long-term trend reversal.
---
### **Higher-Timeframe Trend (Bearish)**
Despite the current rebound:
* Price remains beneath the major bearish trend cloud.
* Lower highs remain intact.
* Sellers continue defending resistance zones.
Until price breaks above recent swing highs, the dominant market structure remains bearish.
---
# **Dynamic Support & Resistance**
### **Immediate Support**
* **4,020–4,024**
* **4,003**
* **3,984** (major support)
A break below **4,003** could expose the previous swing low around **3,984**.
---
### **Immediate Resistance**
* **4,035**
* **4,050**
* **4,070**
The strongest resistance lies around **4,050–4,070**, where previous selling pressure entered the market.
---
# **Momentum Assessment**
Current price action indicates:
✅ Bullish momentum is strengthening.
However,
* Buyers have not yet broken the bearish trend structure.
* Volume confirmation is still required.
* Price is approaching an important resistance cluster.
Momentum favors additional upside only while price remains above **4,020**.
---
# **Trade Scenarios**
## **Bullish Scenario (Higher Probability Intraday)**
If buyers maintain control above **4,020**, price may continue toward:
* **Target 1:** 4,035
* **Target 2:** 4,050
* **Target 3:** 4,065–4,070
This aligns with the projected recovery path shown on the chart.
---
## **Bearish Scenario**
If price fails around resistance and loses **4,020**, sellers may regain control.
Potential downside targets:
* **4,003**
* **3,984**
* Previous swing low
This would reinforce the prevailing higher-timeframe bearish trend.
---
# **Risk Factors**
Watch for:
* Rejection candles near **4,050**
* Increasing selling volume
* False breakout above resistance
* Major economic news that could increase volatility
---
# **Professional Outlook**
### **Intraday Bias:** 🟢 Moderately Bullish
The recent bounce suggests buyers have regained short-term momentum. A move toward **4,050** appears achievable if current support holds.
### **Swing Bias:** 🔴 Bearish
The 4-hour and daily trends remain negative. Unless gold breaks above the recent lower-high structure with strong momentum, rallies are more likely to be corrective than the start of a new bullish trend.
---
# **Trading Plan**
* **Bias:** Buy on pullbacks while price remains above **4,020**.
* **Bullish Target Zone:** **4,035 → 4,050 → 4,070**.
* **Invalidation:** Sustained move below **4,003**.
* **Higher-Timeframe View:** Treat long positions as countertrend trades until the 4-hour trend shifts to bullish.
## **Final Verdict**
**Short-Term:** 🟢 Bullish recovery in progress.
**Medium-Term:** 🟡 Neutral-to-bearish as price approaches resistance.
**Long-Term:** 🔴 Bearish until a decisive breakout above the recent lower highs confirms a reversal.
Long 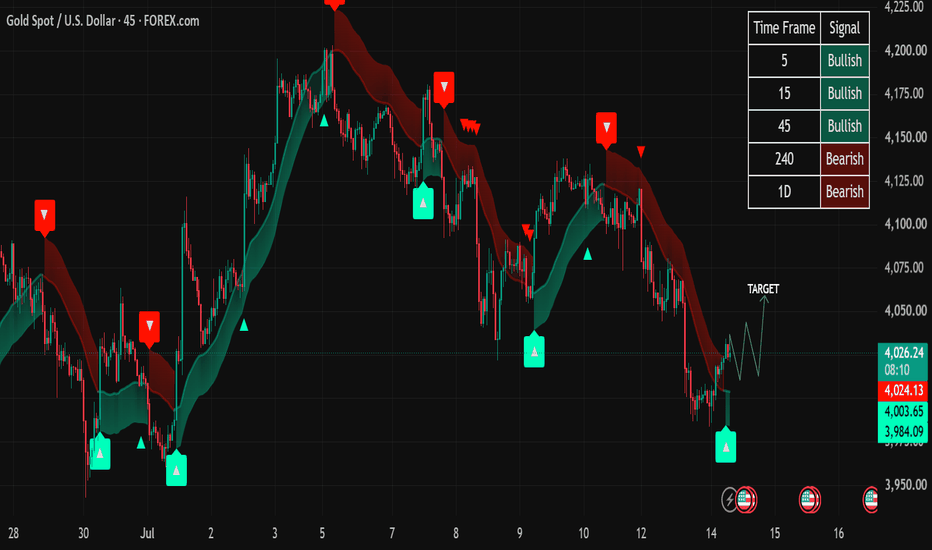
Divi's Laboratories Ltd📈 Divi's Laboratories Ltd. (1W) – Fresh Breakout Opens the Door to New Highs 🚀
Divi's Laboratories has delivered a decisive breakout above a key resistance zone after months of consolidation. The stock is now trading above a major supply area, indicating renewed bullish momentum and the possibility of a fresh medium-term uptrend. 👀
🔍 Technical Highlights
✅ Breakout Above ₹7,084
The stock has successfully crossed the ₹7,084 resistance zone, which had capped price advances over the past few months. This breakout signals a positive shift in the overall market structure.
✅ Strong Bullish Trend
After finding support near ₹5,630, Divi's Labs has formed a series of higher highs and higher lows, confirming that buyers remain firmly in control.
✅ Healthy Price Action
The rally has been gradual with consistent bullish candles rather than a single sharp spike, indicating steady institutional accumulation and improving market sentiment.
🎯 Measured Move Projection
If the stock sustains above ₹7,084 on a weekly closing basis, the measured move projects a potential advance towards the ₹8,600 zone, representing an upside of approximately 20–22% from the breakout level.
⚠️ What Traders Should Watch
🔹 A weekly close above ₹7,084 would strengthen the breakout confirmation.
🔹 Any healthy pullback that successfully retests ₹7,084 as support could offer a higher-probability continuation setup.
🔹 While the momentum remains bullish, avoid chasing extended moves and focus on disciplined entries with proper risk management.
📌 Key Levels
🟢 Breakout Level: ₹7,084
🛡️ Major Support: ₹6,750 followed by ₹6,300
🎯 Potential Target: ₹8,600
💡 Final Thoughts
Divi's Laboratories has emerged from a prolonged consolidation with a convincing breakout on the weekly chart. As long as the stock sustains above the ₹7,084 breakout zone, the technical structure remains bullish and favors a potential move toward ₹8,600 over the coming months.
📢 Do you think Divi's Labs is gearing up for a fresh all-time high, or will it consolidate around the breakout zone before the next leg higher? Share your thoughts below! 👇  Long
Long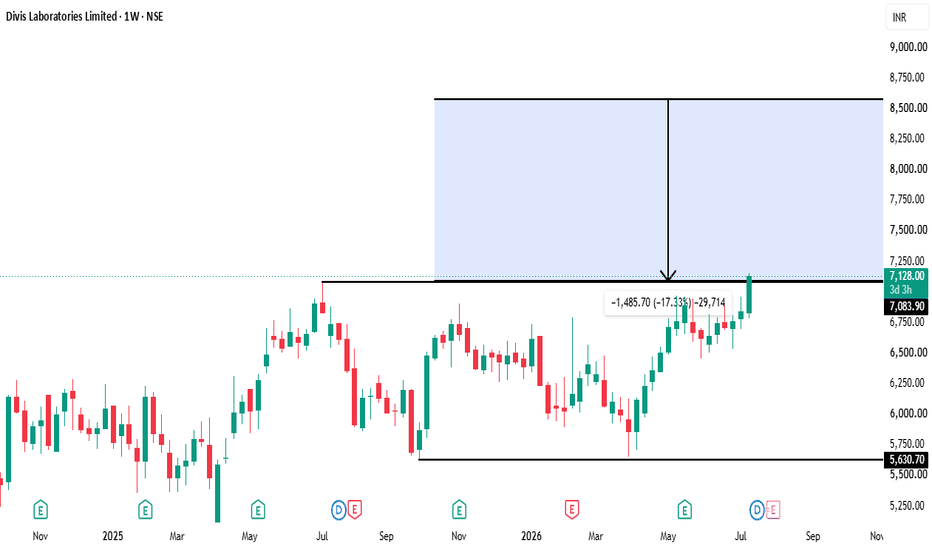
XAUUSD — Is 4,034 the Bull Trap?
Gold is now standing at a very important reaction area.
After moving inside the descending price channel, price has recovered back into the 4,028 - 4,034 zone.
This is not a random area.
It is the short zone on the chart, and it also lines up with the Fibonacci reaction area around 0.5 - 0.618.
That means one thing:
Gold is testing resistance, not confirming a reversal yet.
The simple read
Gold remains inside a descending channel.
The short-term pressure is still bearish while price stays below 4,034 and below the middle structure of the channel.
The current bounce may only be a retest before another downside move.
If gold rejects from 4,028 - 4,034, sellers may try to push price back toward 3,992 first.
If 3,992 breaks, the next reaction area is 3,969.
Below that, the key support zone around 3,945 becomes the main area to watch.
Key price zones
Current price area: 4,025 - 4,030
Short reaction zone: 4,028 - 4,034
Fibo reaction area: 4,031 - 4,026
First support: 3,992
Secondary reaction zone: 3,969
Key support zone: 3,945
Bearish pressure weakens above: 4,034
Trading plan
📉 Sell reaction scenario
If gold rejects from 4,028 - 4,034:
The descending channel structure remains active.
Sellers may try to push price toward 3,992.
If 3,992 fails, price may continue toward 3,969 and later 3,945.
For me, this scenario needs rejection confirmation first.
No rejection = no sell.
📈 Breakout scenario
If gold breaks and holds above 4,034:
The short setup becomes weaker.
Gold may try to escape the short reaction zone and build a stronger recovery.
A buy idea only becomes cleaner if price holds above 4,034 and confirms with a retest.
No confirmation = no trade.
📉 Deeper support scenario
If gold loses 3,992:
The correction may extend lower.
3,969 becomes the next reaction level.
If buyers still fail to defend that area, the key support zone around 3,945 becomes the main downside target.
Tiara’s View
Gold is bouncing, but the bounce is happening inside resistance.
That is why I do not want to call this bullish too early.
A recovery inside a descending channel can easily become a trap if buyers cannot reclaim the short zone.
For today, 4,028 - 4,034 is the key decision area.
If sellers defend it, the next move may be lower.
If buyers break it cleanly, the chart needs to be re-read.
Main view:
Gold stays cautious below 4,034.
4,028 - 4,034 is the trap zone to watch.
3,992, 3,969 and 3,945 are the downside reaction zones.
Reaction first.
Confirmation second.
Trade last.
No confirmation = no trade.
Do you think gold will reject from 4,034, or break out of this short zone?
━━━━━━━━━━━━━━━━━━━━━━━━━━━━━━
🌸 Tiara PrimeGold · XAUUSD · Price Action made simple
⚠️ Personal analysis only — not financial advice
━━━━━━━━━━━━━━━━━━━━━━━━━━━━━━
Tags:
Gold, XAUUSD, Price Action, Support and Resistance, Fibonacci, Descending Channel, Technical Analysis, Gold Analysis, Trading Plan
Short 
407X ZONE - Will CPI trigger gold's next selling opportunity?Today's U.S. CPI release is expected to be the key macro catalyst for Gold this week. After yesterday's sharp decline, buyers have started to defend price around the lower boundary of the descending channel, producing a technical rebound. However, the recovery remains relatively weak, suggesting institutional flows are still waiting for inflation data before committing to a larger directional move.
If CPI comes in above expectations, markets could further reinforce the "higher-for-longer" Federal Reserve narrative, supporting the U.S. dollar and Treasury yields while limiting Gold's upside. On the other hand, softer inflation could weaken the dollar and trigger a relief rally. Even so, one inflation report alone is unlikely to completely change the broader macro outlook, with PPI and Retail Sales still ahead later this week.
Technically, Gold continues to trade within a well-defined descending channel on the H4 timeframe. The recent bounce from the lower trendline has stabilized short-term selling pressure, but buyers have yet to reclaim the Demand + Fibonacci 0.382 area. The 4,070 region remains the key confluence of Demand, Descending Trendline, and Fibonacci 0.50–0.618, making it the primary institutional supply zone to monitor. Unless price confirms a Break of Structure (BOS) above this resistance cluster, the current recovery is likely to remain a corrective rally within the broader bearish trend.
PRIMARY SCENARIO
A softer-than-expected CPI could lift Gold toward the 4,070 resistance cluster, where the Demand + Trendline + Fibonacci 0.50–0.618 confluence may attract renewed selling interest. As long as this area continues to cap price, the broader bearish structure remains valid, with the 3,970–3,980 support zone likely to be retested.
ALTERNATIVE SCENARIO
If buyers manage to secure a confirmed H4 close above 4,070 and break the descending trendline with a clear BOS, bearish momentum could fade, opening the door for a deeper recovery toward higher premium levels. Until then, any rally should be treated as a potential Sell the Rally opportunity rather than evidence of a confirmed trend reversal.
MARKET VIEW
Current Bias: Bearish
Preferred Strategy: Sell the Rally – Wait Confirmation
LucasGrayTrading Short 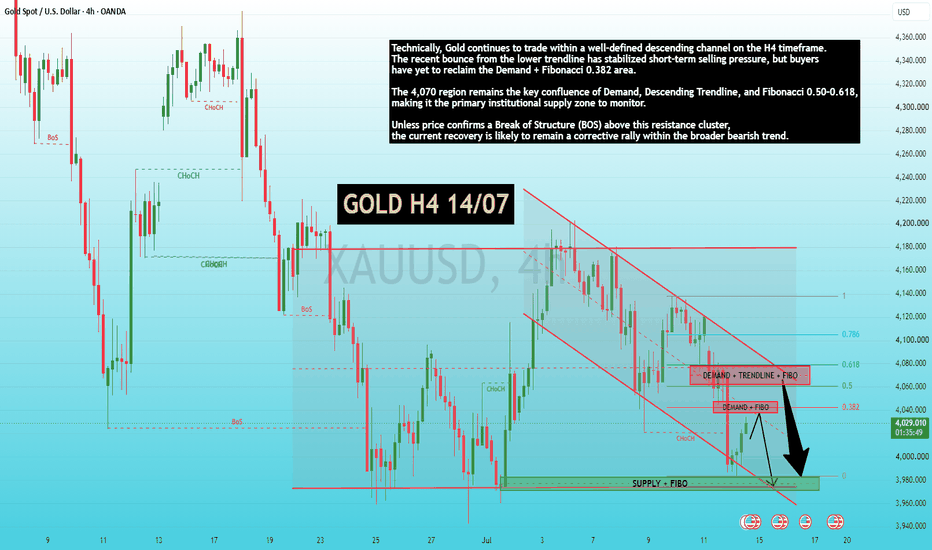
XAUUSD: ABC Recovery Forming After Elliott DropGold is trying to recover after completing a sharp bearish Elliott wave sequence near the lower price area. From Kelly’s view, the market has already reacted from the recent low, but the current move still looks more like an ABC corrective recovery rather than a confirmed bullish reversal.
The key idea is simple: gold may continue to rebound in the short term, but the reaction around each resistance zone will decide whether buyers can keep control.
⟡ Market structure
The chart shows gold previously moved in a strong bearish sequence, creating lower highs and lower lows before reaching the final wave 5 area near the lower base. After that, price started to recover and is now forming a short-term ABC structure.
Price is currently trading around 4,027, close to the small sell zone near 4,038. If gold can hold above the buy wave C area around 4,011, the recovery may continue towards the higher reaction zones.
The important resistance above is the Elliott wave completed sell zone around 4,060–4,070. This is where buyers need to prove strength, because rejection from this area may bring another pullback.
➤ Key levels
◌ 4,011: buy wave C zone and short-term support
◌ 4,027: current reaction area
◌ 4,038: nearest sell zone
◌ 4,060–4,070: Elliott completed zone and main resistance
◌ 3,985–3,990: lower support if wave C fails
◌ Above 4,070: area where recovery gains stronger quality
⌁ Elliott Wave view
From an Elliott Wave perspective, gold appears to have completed a bearish 5-wave move near the lower low. After that, the market is now building an ABC correction.
Wave A created the first rebound from the low.
Wave B pulled back into the current structure.
Wave C may develop from the 4,011 area if buyers defend support.
If wave C holds and price breaks above 4,038, gold may continue towards 4,060–4,070. However, if price fails to hold 4,011, the ABC recovery weakens and gold may retest the lower base again.
▸ Trading scenario
Preferred scenario: wait for price to hold the buy wave C zone and show bullish confirmation.
Entry zone: 4,011–4,020 if bullish confirmation appears
Stop loss: below the confirmed wave C low
Take profit 1: 4,038
Take profit 2: 4,060–4,070
Take profit 3: 4,090 if momentum expands
Alternative scenario: if gold breaks below 4,011 and fails to reclaim this area, the ABC structure loses quality. In that case, price may return towards 3,985–3,990 before forming a new base.
⌁ Kelly’s view
For Kelly, this is a short-term ABC recovery setup after a completed bearish Elliott wave. The market is no longer in clean sell momentum at the low, but buyers still need to confirm strength through resistance.
The cleaner plan is to watch the reaction around 4,011 first. If buyers defend this zone, gold may continue recovering towards the sell zones above.
Gold is forming an ABC rebound.
If wave C holds, the next move may continue towards 4,038 and 4,060.
Share your view below. Long 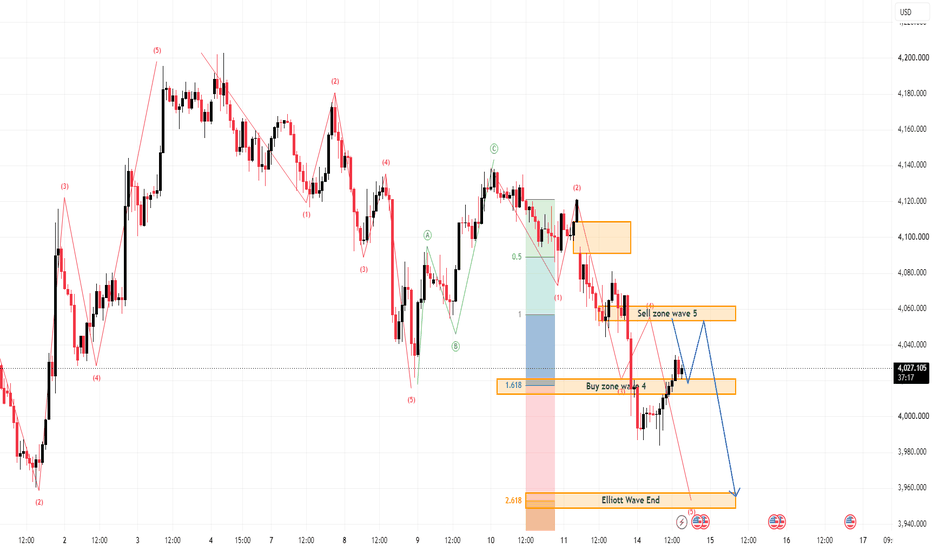
XAUUSD — Is 4,080 the Sell Trap?Gold is still moving inside a descending price channel.
Price is trading around 4,050 - 4,060, right near the middle zone of the channel.
This is not a clean buy area.
And it is not the best place to chase a sell either.
For me, today’s chart is about one question:
Will gold retest the sell zone first before dropping deeper?
The simple read
Gold remains under short-term bearish pressure while price stays inside the descending channel.
The nearest sell reaction area is around 4,080 - 4,091.
This zone also lines up with the Fibonacci reaction area and the upper part of the current correction.
If gold pushes into this zone and shows rejection, sellers may try to take control again.
The first downside area to watch is 4,043 - 4,027.
If that support fails, the next deeper target becomes 3,985, then the key support zone near 3,945.
Key price zones
Current price area: 4,050 - 4,060
Middle channel zone: 4,050
Sell reaction zone: 4,080 - 4,091
First support: 4,043 - 4,027
Fibo extension support: 3,985
Key support zone: 3,945
Bearish pressure weakens above: 4,091
Trading plan
📉 Sell reaction scenario
If gold retests 4,080 - 4,091 and shows clear rejection:
Sellers may try to push price back toward 4,043 - 4,027.
If this support zone breaks, the next downside area to watch is 3,985.
A deeper move may target the key support zone near 3,945.
I prefer waiting for rejection confirmation instead of selling randomly in the middle.
📈 Short-term bounce scenario
If gold holds above 4,043 - 4,027:
A small recovery may appear.
Price could retest 4,080 - 4,091 again.
But this bounce is still only a reaction while gold remains inside the descending channel.
A stronger bullish view needs price to break and hold above 4,091.
📉 Deeper correction scenario
If 4,027 fails clearly:
The correction structure becomes stronger.
Gold may continue toward 3,985, where the Fibonacci extension support is waiting.
If buyers still fail to react there, the key support zone near 3,945 becomes important.
Gold is not giving a clean reversal signal yet.
The chart is still respecting the descending channel.
That means I do not want to chase the current price.
I want to see either:
A clean rejection from 4,080 - 4,091.
Or a confirmed reaction from 4,043 - 4,027.
Main view:
Gold remains cautious below 4,091.
4,080 - 4,091 is the sell reaction zone.
4,043 - 4,027 is the first support.
3,985 and 3,945 are the deeper zones if the correction continues.
Reaction first.
Confirmation second.
Trade last.
No confirmation = no trade.
Do you think gold will reject from 4,080 - 4,091, or break the channel first? Short 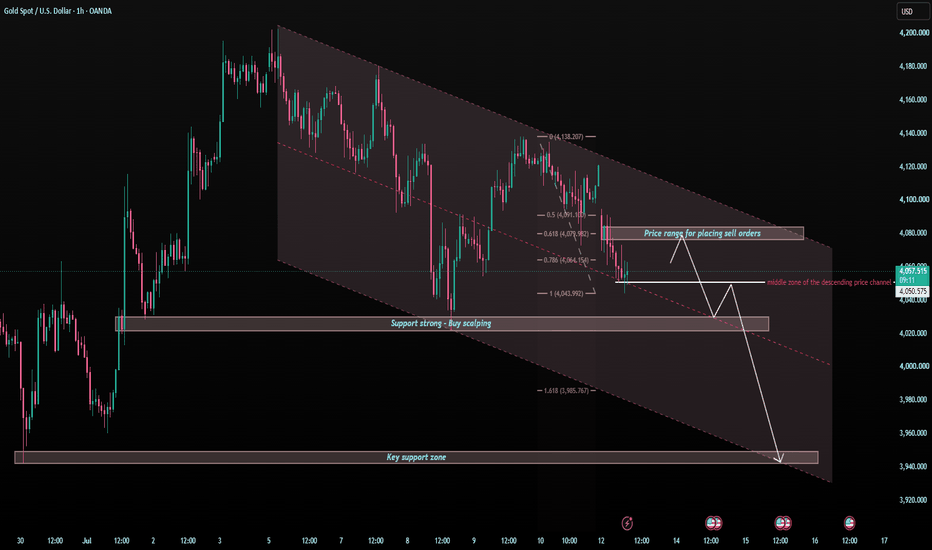
XAUUSD — Bearish Pressure Below Liquidity Sell Zone
Fundamental Analysis
Gold remains sensitive to USD momentum, Treasury yields, and upcoming U.S. macro data. For now, the market is still showing defensive price action, with sellers controlling the structure after price failed to hold above the previous trendline.
Technical Analysis
On the 1H chart, XAUUSD is trading around 4,026 after breaking below the short-term uptrend structure. The nearest reaction area is the liquidity buy scalping zone at 3,998 - 4,004, where price may create a short bounce. However, the main area to watch is 4,074 - 4,080. This zone aligns with previous liquidity, Fibonacci reaction, and the broken trendline retest. If gold recovers into this area and rejects, the bearish continuation setup remains valid toward the lower target around 3,890.
Important Key Levels
Current price: 4,026
Buy scalping zone: 3,998 - 4,004
Liquidity sell test zone: 4,074 - 4,080
Short-term resistance: 4,040 - 4,050
Main downside target: 3,890 - 3,885
Invalidation: above 4,080
Trading Scenario
Main Sell Setup
Entry: 4,074 - 4,080
Stop Loss: 4,105
Take Profit 1: 4,004
Take Profit 2: 3,950
Take Profit 3: 3,890 - 3,885
Sell Condition
Wait for gold to recover into the 4,074 - 4,080 liquidity sell test zone. A valid sell setup needs bearish rejection, such as a long upper wick, failed reclaim, bearish engulfing candle, or price closing back below the zone. If price rejects and breaks below 3,998 - 4,004, downside momentum may expand toward 3,950 and 3,890. If price breaks and holds above 4,080, the sell setup becomes weaker.
Overall View
The main view remains bearish while XAUUSD trades below the broken trendline and under the liquidity sell test zone. Gold may bounce first from 3,998 - 4,004, but the preferred plan is to wait for a cleaner sell reaction around 4,074 - 4,080 before looking for continuation toward the lower Fibonacci target.
Do you share the same bearish view on gold, or are you waiting for a stronger rejection from the 4,074 - 4,080 zone?
Short 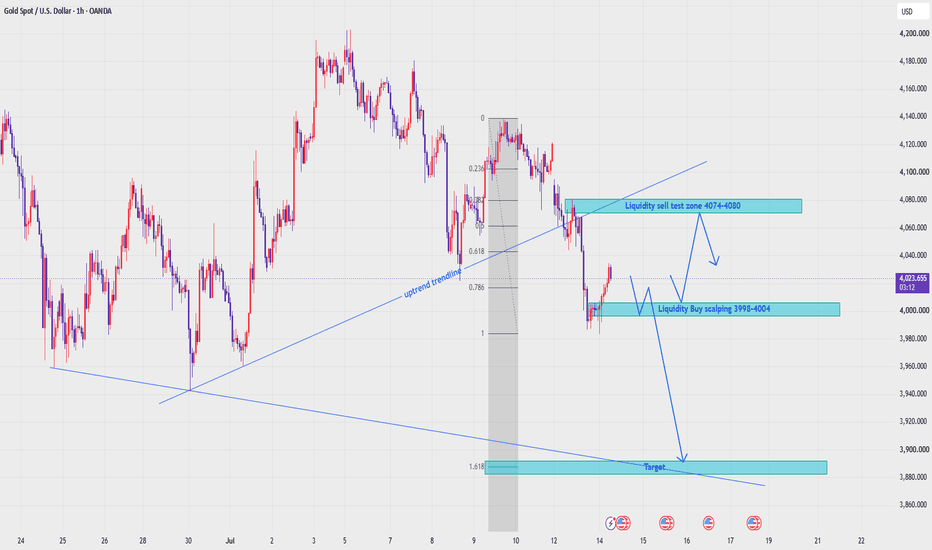
Long 
Long