Short
Short
Can Gold clear 4153 to confirm new trend?Gold has regained bullish momentum over the past two sessions as the U.S. dollar eases from recent highs and risk sentiment stabilizes. However, the broader macro narrative has not changed significantly. The Federal Reserve continues to favor a restrictive policy stance, while markets remain cautious about pricing aggressive rate cuts. Without a meaningful shift in Fed expectations, Gold's recovery is still being driven more by short-term positioning than by a structural change in institutional flows.
This leaves the current rally approaching an important test. Rather than chasing higher prices, institutional traders are likely to focus on whether buyers have enough momentum to reclaim the major resistance zone that has capped price throughout July.
From a technical perspective, Gold has successfully broken the short-term descending trendline and is now trading within an ascending channel on the H4 timeframe, indicating improving short-term momentum. Price is approaching the 4,153 resistance, where Demand, Fair Value Gap (FVG), and previous supply converge. This zone represents the final barrier before a broader trend reversal can be confirmed. A decisive breakout above 4,153 would strengthen the bullish structure and expose the next liquidity zone around 4,200. Until then, this remains a high-probability area for sellers to defend.
PRIMARY SCENARIO
Gold may continue extending toward the 4,153 Demand + FVG resistance. As long as this confluence caps price, the recovery is likely to remain corrective, with sellers potentially re-entering the market and driving Gold back toward the 4,100–4,080 support region.
ALTERNATIVE SCENARIO
A confirmed H4 close above 4,153 would invalidate the current bearish bias, confirming a higher high and opening the path toward the 4,200 resistance zone. Such a breakout would suggest institutional buyers are beginning to regain control of the medium-term trend.
MARKET VIEW
Current Bias: Bearish
Preferred Strategy: Sell the Rally – Wait Confirmation  Short
Short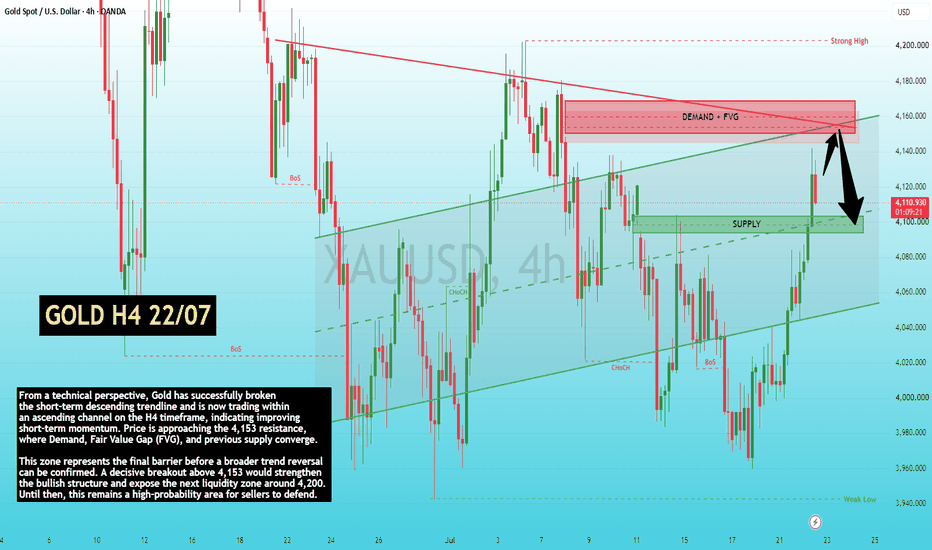
 Long
Long
Short 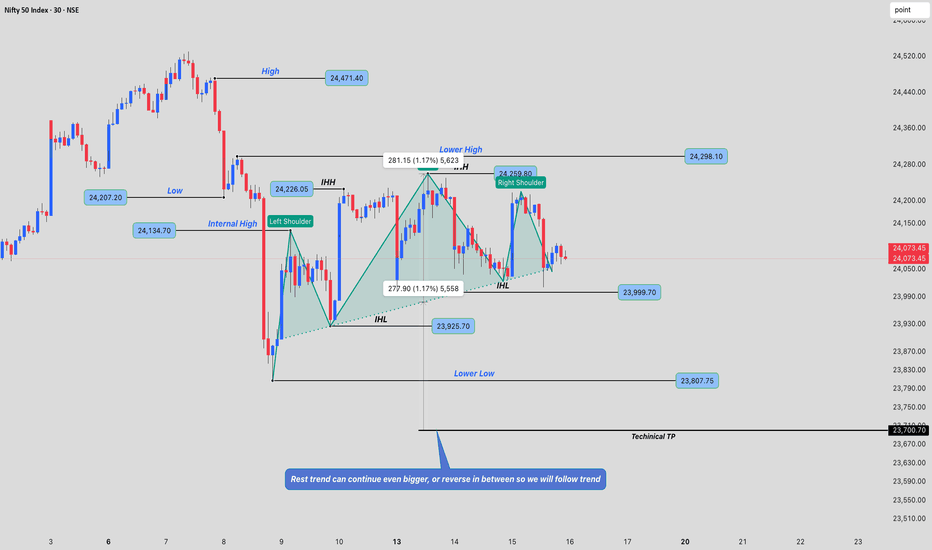
 Long
Long
XAUUSD: Bullish Wave 5 may begin after pullback.Gold is showing a clear recovery structure after completing the previous bearish cycle near the lower area. From Kelly’s view, the chart is now shifting into a bullish Elliott sequence, but price may still need one corrective pullback before wave 5 continues higher.
The key idea is simple: gold is bullish in the short term, but the better setup may come from a clean retest of the buy zone, not from chasing the current push.
⟡ Market structure
The chart shows gold has reacted strongly from the lower base near 3,960 and created a sequence of higher lows. Price has already broken back above the descending pressure line, which is an important sign that sellers are losing control in the short-term structure.
Gold is now trading around 4,075 after a strong recovery move. However, price is approaching the 4,090–4,100 sell wave 4 zone, so a short correction from this area would be normal.
The main support to watch is the 4,040–4,050 buy zone wave 5. If gold pulls back into this area and buyers defend it, the next upside leg may continue towards the Fibonacci 2.618 target near 4,145–4,155.
➤ Key levels
◌ 4,040–4,050: buy zone wave 5 and key pullback area
◌ 4,075: current price reaction area
◌ 4,090–4,100: sell wave 4 / short-term resistance
◌ 4,138: previous Fibonacci reference zone
◌ 4,145–4,155: final wave 5 completion area
◌ Below 4,030: area where the bullish setup starts to weaken
◌ Below 4,000: area where the wave count needs reassessment
⌁ Elliott Wave view
From an Elliott Wave perspective, gold appears to be building a bullish 5-wave recovery after the previous bearish structure ended.
Wave 1 created the first upside reaction from the low.
Wave 2 corrected back but held above the base.
Wave 3 expanded strongly and pushed gold back above the broken trendline.
Wave 4 may now form as a controlled pullback into the 4,040–4,050 buy zone.
If that zone holds, wave 5 may begin and aim for the 4,145–4,155 completion area.
This is why Kelly would not chase the current price directly into resistance. The stronger setup is to wait for wave 4 to finish, then look for confirmation that wave 5 is starting.
▸ Trading scenario
Preferred scenario: wait for gold to pull back into the buy zone wave 5 and show bullish confirmation.
Entry zone: 4,040–4,050 if bullish confirmation appears
Stop loss: below the confirmed wave 4 low or below 4,030
Take profit 1: 4,090–4,100
Take profit 2: 4,138
Take profit 3: 4,145–4,155
Alternative scenario: if gold breaks above 4,100 without a pullback and holds strongly, price may continue directly towards the wave 5 target. In that case, a retest of 4,090–4,100 as support would become the cleaner continuation setup.
⌁ Kelly’s view
For Kelly, the bullish recovery structure is improving, but the market is now close to a short-term resistance zone. That means the best plan is patience.
If gold corrects into 4,040–4,050 and buyers defend the zone, the next wave 5 move may continue towards the higher Fibonacci target.
Gold is building a bullish Elliott structure.
A controlled pullback may prepare the next move higher.
Share your view below. Long 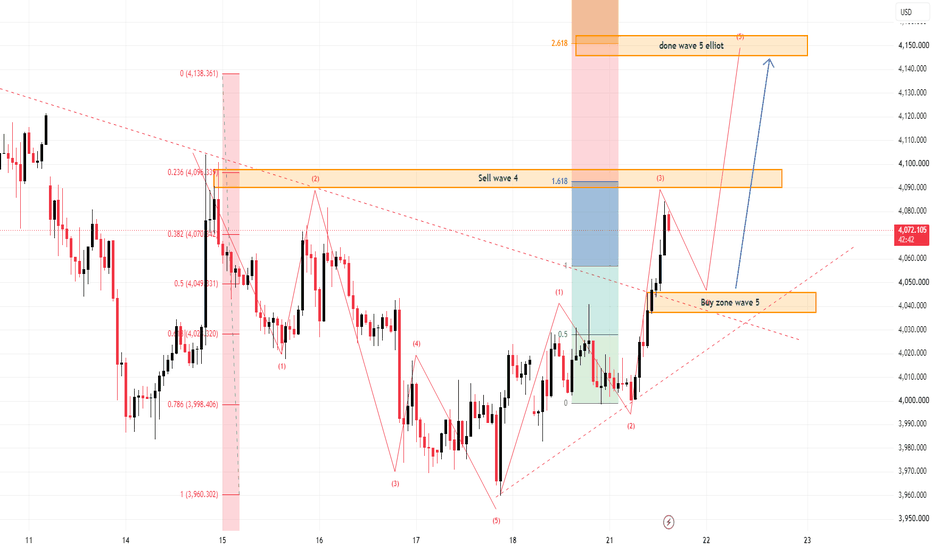
 Long
Long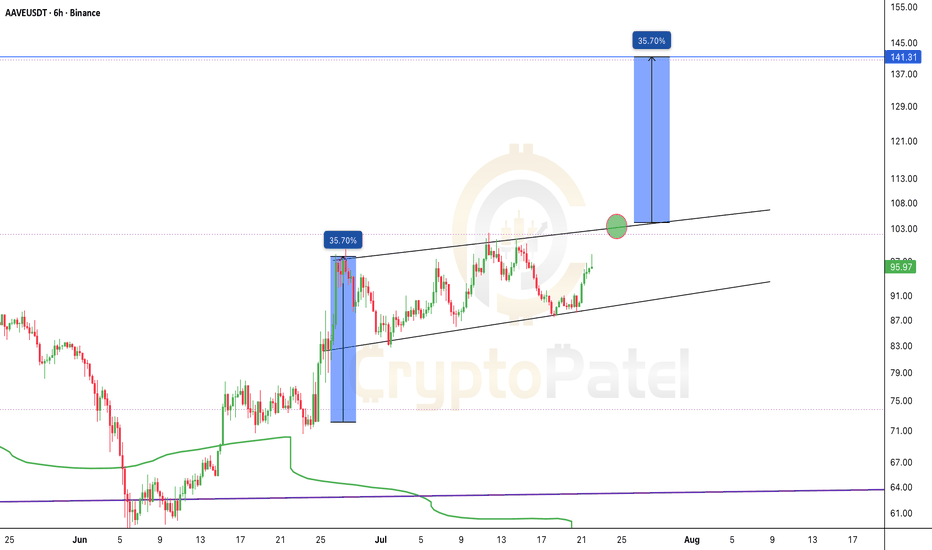
Bullish Breakout & Demand Zone Retest | High-Probability?🔍 Market Structure Analysis
The chart begins with a series of well-defined pivot points, where buyers repeatedly stepped into the market to defend price. Each successful defense created confidence among market participants while gradually weakening sellers.
As price approached resistance multiple times, every rejection became smaller than the previous one. This indicates that selling pressure was fading while buyers continued to absorb supply.
Eventually, the market gained enough momentum to break above the resistance, confirming a Bullish Break of Structure (BOS). This shift signals that market control has transitioned from sellers to buyers.
🟢 Pivot Points – The Foundation of the Trend
The highlighted pivot points represent the areas where institutional buyers entered the market.
Why are they important?
They reveal where demand consistently overwhelmed supply.
Every pivot created higher buying interest.
They established a sequence of higher reactions, proving buyers were becoming increasingly aggressive.
These zones served as the launching pads for the next bullish impulse.
Each pivot is evidence that the market respected support before preparing for the breakout.
🚀 Multiple Breakout Attempts – Building Pressure
Rather than breaking resistance immediately, the market tested it several times.
This behavior is extremely significant because:
Every breakout attempt consumed more sell orders.
Sellers gradually lost control.
Buyers continued accumulating positions.
Resistance weakened with every test.
When resistance was finally broken, it wasn't a random move—it was the result of sustained buying pressure built over time.
🔵 Demand Zone – The Institutional Entry Area
After the breakout, price returned to the highlighted Demand Zone.
This retest is one of the strongest confirmations in technical analysis because it demonstrates that:
Previous resistance has transformed into new support.
Institutions often revisit these areas to add positions.
Weak hands exit during the pullback.
Strong buyers defend the zone before continuing higher.
A successful retest confirms that the breakout is genuine rather than a false move.
📊 Price Action Psychology
The chart perfectly illustrates market psychology.
Stage 1: Buyers quietly accumulate near support.
Stage 2: Resistance is tested repeatedly, reducing selling pressure.
Stage 3: A strong breakout traps late sellers.
Stage 4: Price revisits the breakout area.
Stage 5: Buyers defend demand.
Stage 6: Momentum resumes toward higher targets.
This sequence reflects how professional traders build positions before major market moves.
🎯 Bullish Outlook
As long as price remains above the highlighted Demand Zone, the overall market structure remains bullish.
The current setup suggests:
✅ Buyers are defending higher prices.
✅ Market structure favors continuation.
✅ The breakout has already been confirmed.
✅ Demand remains intact.
If buying momentum continues, the market is likely to advance toward the projected target levels shown on the chart.
⚠️ Risk Management
Every trading setup has an invalidation point.
The bullish scenario remains valid only while price holds above the Demand Zone.
A decisive close below this zone would indicate:
Buyers are losing strength.
The breakout has failed.
Price may revisit the Strong Support Zone before another attempt higher.
Professional traders always protect capital by respecting invalidation levels.
💡 Key Takeaways
✔ Strong institutional support established the bullish foundation.
✔ Multiple breakout attempts weakened resistance.
✔ A confirmed Break of Structure shifted market control to buyers.
✔ The demand zone now acts as the primary buying area.
✔ A successful retest increases the probability of bullish continuation.
✔ Holding above demand keeps the path open toward higher targets. Long 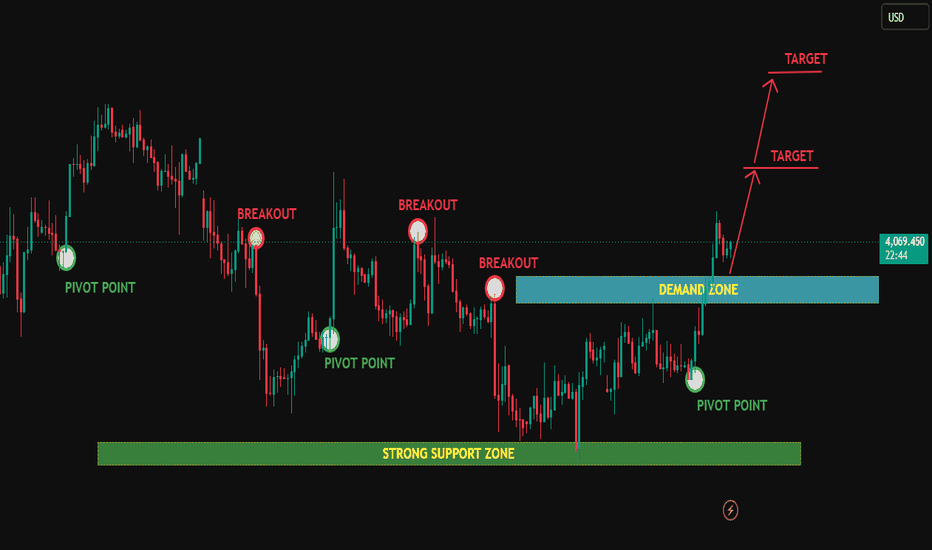
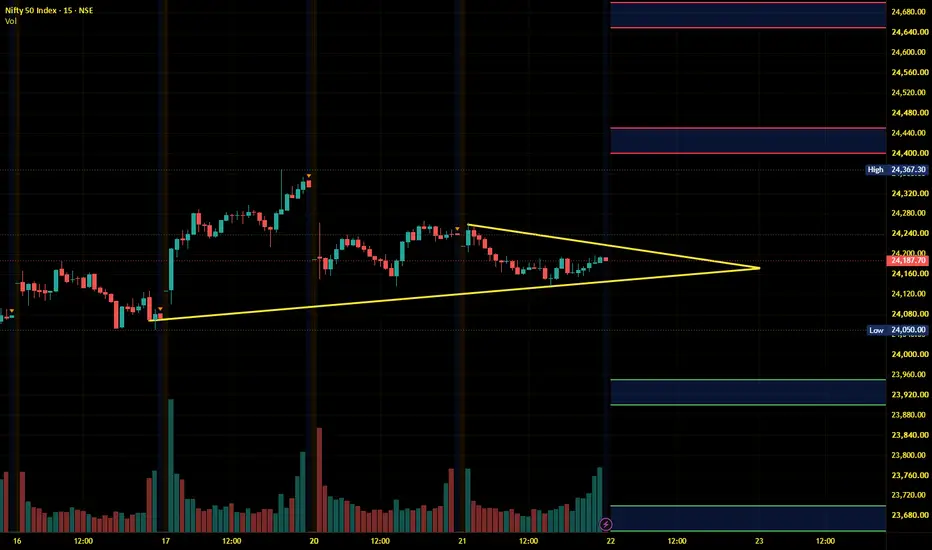
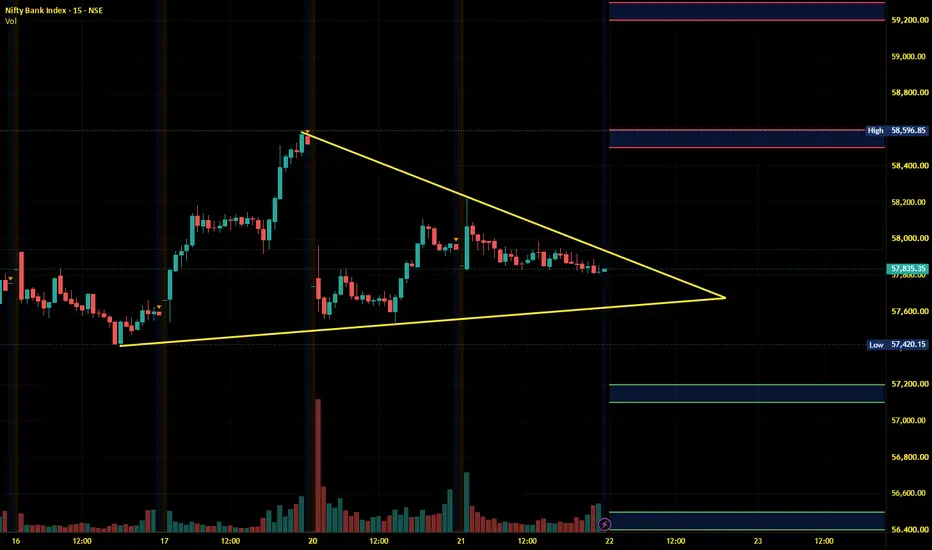
NIFTY: 24,200 Remains the Deciding ZoneNIFTY: 24,200 Remains the Deciding Zone
NIFTY continues to trade in a sideways range, and nothing has changed structurally.
Last week, the index attempted a bullish breakout above 24,300, but the move lacked follow-through. Instead of attracting fresh buying, it slipped back into the same consolidation zone. Failed breakouts often indicate a lack of institutional conviction rather than a change in trend.
The daily chart shows NIFTY still trading below the 200 EMA (24,393), keeping the broader trend cautious. Until this level is reclaimed, every rally should be viewed as a recovery within a larger corrective structure.
The option chain also highlights 24,200 as the immediate pivot. Call writers remain active above this level, while Put OI is concentrated around 24,000–24,100, creating a narrow trading range.
My approach remains simple:
- Above 24,200: The short-term bias improves, with potential towards 24,300–24,400.
- Below 24,200: Selling pressure is likely to increase, bringing 24,100 and 24,000 back into focus.
However, I'm not interested in the first move. This is a premium-decay market where false breakouts are common. I want confirmation before taking directional trades.
Trading Lesson
Range-bound markets are designed to frustrate option buyers. When price keeps returning to the same zone, patience becomes more valuable than prediction. Let the market prove its direction before committing capital. Short 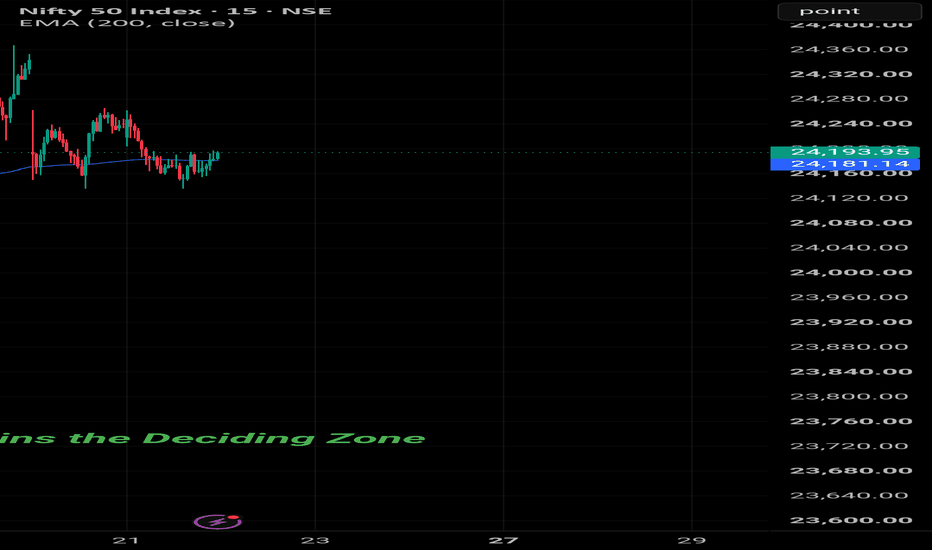

DXY: Ready for the Next Leg? Flagpole Pattern!!The U.S. Dollar Index appears to be forming a Bull Flag after a strong impulsive rally.
A healthy trend rarely moves in a straight line. Strong markets often pause, consolidate, and absorb profit booking before attempting the next move. That's exactly what DXY is doing at the moment.
The initial rally formed the flagpole, reflecting strong buying momentum. Since then, price has been correcting inside a downward-sloping channel, creating the flag. This type of consolidation usually indicates that sellers are unable to reverse the trend, while buyers gradually absorb supply.
What's encouraging is that the entire correction is taking place above the previous breakout zone near 100, suggesting that former resistance is now acting as support. This is a constructive sign from a market structure perspective.
A decisive breakout above the flag would indicate that the correction is complete and could trigger the next leg higher. Until then, the pattern remains under development, and patience is essential.
This isn't just a Forex chart.
The next move in DXY can influence Gold, Silver, Crude Oil, USDINR, emerging markets, FII flows, and global equity indices.
Rather than predicting the direction, I'm simply identifying a high-probability structure and waiting for the market to confirm it.
Sometimes the best trades begin with a simple continuation pattern.  Long
Long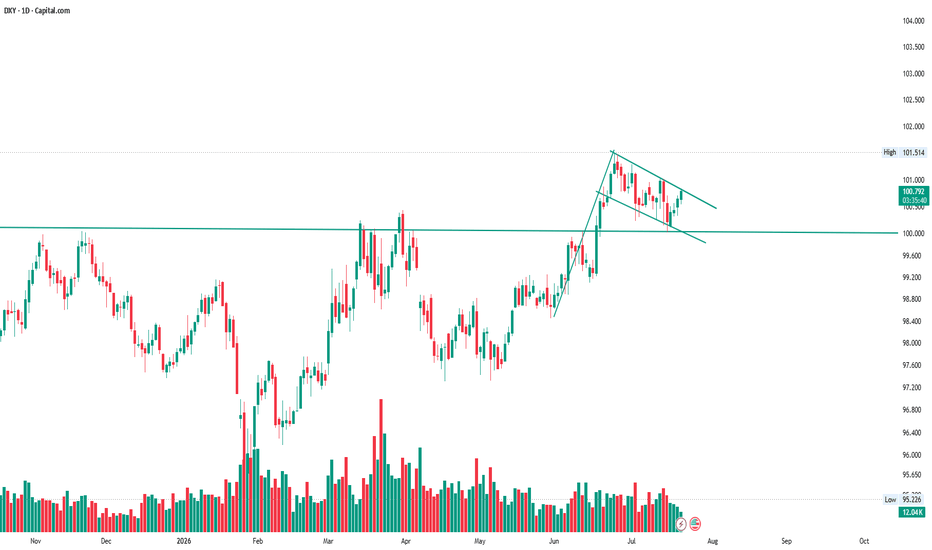
 Long
Long

 Long
Long