Reliance: Bears Still Have the Upper HandI'm not interested in buying Reliance at current levels. If I had to take a trade today, I'd rather be on the short side.
The stock continues to trade below its 20, 50, 100 and 200-day moving averages, which tells me the broader trend is still bearish. While Reliance is holding an upward trendline, every bounce is getting sold near the ₹1,300 zone. That's a sign of distribution, not accumulation.
The derivatives market supports this view. Heavy Call open interest at ₹1,300, ₹1,310 and ₹1,350 suggests option writers are defending higher levels. A PCR of 0.63 also indicates bearish positioning continues to dominate.
On the daily chart, Reliance is trading below the pivot level of ₹1,302, while the 15-minute chart shows fading momentum with lower highs. Buyers have had multiple opportunities to push the stock higher but haven't been able to sustain above resistance.
As long as Reliance remains below ₹1,302–1,306, I see every pullback as a potential shorting opportunity rather than a buying opportunity.
I'm watching ₹1,279 as the first downside target. If that level breaks, the stock could extend towards ₹1,250–1,260.
I'll change my view only if Reliance closes decisively above ₹1,306 and follows through above ₹1,317. Until then, the trend favours the bears.
My trade: Sell on strength. The risk-reward currently favors the downside.  Short
Short
Nifty Outlook: I'm Still Waiting for ConfirmationOver the last few sessions, I've been watching Nifty defend higher lows consistently. Buyers are clearly stepping in on every dip, but one thing hasn't changed—the market is still struggling to clear the resistance zone around 24,250–24,300.
For me, this is not the place to get aggressive. The reward doesn't justify the risk until the market proves itself.
From the daily chart, Nifty continues to respect the rising structure, but it is trading just below the 200-day moving average near 24,410, which remains the biggest hurdle. Until we close above it, I consider this a recovery phase rather than a confirmed uptrend.
The option chain tells a similar story.
The strongest Put writing is sitting at 24,000, with fresh additions at 24,100 and 24,200. That tells me buyers are confident defending lower levels.
At the same time, heavy Call writing has shifted to 24,300, 24,400 and 24,500, showing that option writers are still expecting resistance overhead.
In other words, the market is trapped between confident buyers and equally confident sellers.
My approach is simple.
If Nifty closes above 24,300, I'll look for long positions targeting 24,450, 24,600 and possibly 24,800.
If the index loses 24,150, I'll expect a move back toward 24,000, and only a break below that would turn me cautious.
For now, I'm choosing patience over prediction.
The trend is improving, but I don't want to pay premium prices before the market confirms the breakout. I'd rather miss the first 50 points of the move than get trapped inside another range.
Levels I'm Watching
Resistance: 24,250–24,300
Major Resistance: 24,410 (200 DMA)
Support: 24,150
Strong Support: 24,000
My View: The bulls have an edge, but the market still needs to prove it. Until 24,300 is convincingly reclaimed, I prefer to stay selective and let price confirm the next move.  Short
Short
HCLTECH Falling Wedge Breakout After Strong Q1 FY27 Results📊 HCL Technologies: Daily Technical Snapshot – Falling Wedge Breakout After Strong Q1 FY27 Results
📊 STWP Technical Analysis
________________________________________
MARKET STRUCTURE SNAPSHOT | NSE: HCLTECH | DAILY
Closing Price: 1,221.20 (+57.10 | +4.91%)
Core Trend: Recovery within Long-Term Uptrend
Market State: Confirmed Falling Wedge Breakout
Price Structure: Price has broken above a multi-month Falling Wedge, supported by a strong bullish breakout candle and significantly higher trading volume. The breakout signals weakening selling pressure and improving buyer conviction.
________________________________________
OPERATIONAL PRICE GRID & KEY REFERENCE LEVELS
Model Reference Level: 1,237.00
Hard Invalidation Level: 1,119.00
Structural Risk: 118.00 (9.54%)
Resistance Levels: R1 1,251.47 | R2 1,281.73 | R3 1,326.47
Support Levels: S1 1,176.47 | S2 1,131.73 | S3 1,101.47
Range Structure: Low 1,119.00 | High 1,326.47
Higher Timeframe Observation Zones: 1,355.00 | 1,472.95
________________________________________
MOMENTUM, PARTICIPATION & CPR DATA
Volume Profile: 9.03 Million Shares
Volume Character: Very High Relative Participation
RSI: 62.89 (Strong Momentum Zone)
ADX: 14.20 (Early Trend Development Phase)
ROC: +10.78%
MACD Status: Fresh Bullish Momentum Structure
CCI: +174.99 (Strong Bullish Momentum)
Stochastic Reading: 92.37 (Extended Momentum Zone)
Current Bias: BUY ON PULLBACKS
CPR State: Bullish Zone | CPR Moving Up (Wide)
Today's CPR: Pivot 1,169.70 | Top 1,166.90 | Base 1,172.50
Tomorrow's CPR (Projected): Pivot 1,206.75 | Top 1,213.95 | Base 1,199.50
________________________________________
📚 EDUCATIONAL OBSERVATION
HCL Technologies has confirmed a breakout from a multi-month Falling Wedge, a chart pattern widely regarded as a bullish reversal formation that often develops after an extended corrective phase. The breakout is supported by a strong bullish candle, improving momentum indicators and significantly higher trading volume, reflecting renewed buying interest and strengthening market participation.
A Falling Wedge forms as prices create progressively lower highs and lower lows within converging trendlines. As the pattern matures, selling pressure gradually weakens while buyers begin accumulating at lower levels. A decisive breakout above the upper boundary often signals that the corrective phase may be ending and that a fresh upward trend could be developing.
Momentum indicators continue to support the improving technical structure. The RSI at 62.89 reflects healthy bullish momentum without entering an extreme overbought zone. MACD has generated a fresh bullish crossover, indicating strengthening upside momentum, while the ROC of +10.78% highlights strong price acceleration. The CCI reading of +174.99 confirms robust buying pressure, and the Stochastic reading of 92.37 reflects sustained momentum, although elevated readings also suggest that short-term consolidations or pullbacks remain a normal possibility after a sharp breakout.
The projected Central Pivot Range (CPR) for the next trading session has shifted higher, with the projected Pivot at 1,206.75. A rising and widening CPR generally reflects improving market acceptance of higher prices and often supports trend continuation when accompanied by healthy participation. The current dashboard therefore maintains a constructive outlook with a preference for buying on pullbacks rather than chasing extended moves.
Immediate attention remains focused on the resistance zone between 1,251 and 1,282. A sustained move above this region could strengthen the breakout further and bring the higher-timeframe observation zones near 1,355 and 1,473 into focus. On the downside, 1,176 remains the first important support, while the structural invalidation level is positioned near 1,119.
________________________________________
🏢 BUSINESS & FUNDAMENTAL UPDATE
HCL Technologies recently announced its Q1 FY27 financial results (quarter ended June 2026), delivering a strong operational performance despite a challenging environment for the global IT services sector.
Key Highlights
Net Profit: 4,624 crore, up 20.32% year-on-year from 3,843 crore.
Revenue: 34,579 crore, representing 13.94% year-on-year growth from 30,349 crore.
Interim Dividend: The Board declared an interim dividend of 12 per equity share (face value 2) for FY27. The record date is 17 July 2026, while the dividend will be paid on 27 July 2026.
FY27 Guidance: Management reiterated its constant currency revenue growth guidance of 1–4%, maintaining its earlier outlook despite macroeconomic uncertainty.
The quarterly performance comes at a time when the broader IT sector continues to face headwinds from cautious enterprise technology spending, reduced discretionary budgets and increasing discussions around AI-driven pricing pressure across traditional IT services. Against this backdrop, HCLTech's stronger-than-expected profitability, double-digit revenue growth and stable guidance demonstrate operational resilience and disciplined execution.
Interestingly, the stock had already attracted strong buying interest ahead of the earnings announcement, rallying nearly 5% in the previous trading session. The combination of robust quarterly earnings, a healthy dividend announcement, stable management guidance and a technically confirmed Falling Wedge breakout provides both fundamental and technical support for the improving market structure.
________________________________________
📖 Educational Note
Support and resistance levels should be viewed as observation zones rather than predictive targets. Chart patterns, price action, volume analysis, momentum indicators and CPR are educational tools that help market participants understand evolving market structure within a disciplined risk-management framework. Similarly, strong quarterly results can improve investor sentiment but should always be evaluated alongside broader market conditions, valuation and risk management principles.
________________________________________
⚠️ Disclaimer
This analysis is provided strictly for educational and informational purposes.
It does not constitute financial, investment or trading advice and should not be interpreted as a recommendation to buy or sell any security.
Stock market investments are subject to market risks, including the possible loss of capital.
Past performance, historical observations, chart patterns, earnings performance and technical indicators do not guarantee future results.
Please conduct your own research and consult a SEBI-registered investment adviser before making investment decisions.
STWP assumes no responsibility or liability for any financial loss arising directly or indirectly from the use of this analysis.
 Long
Long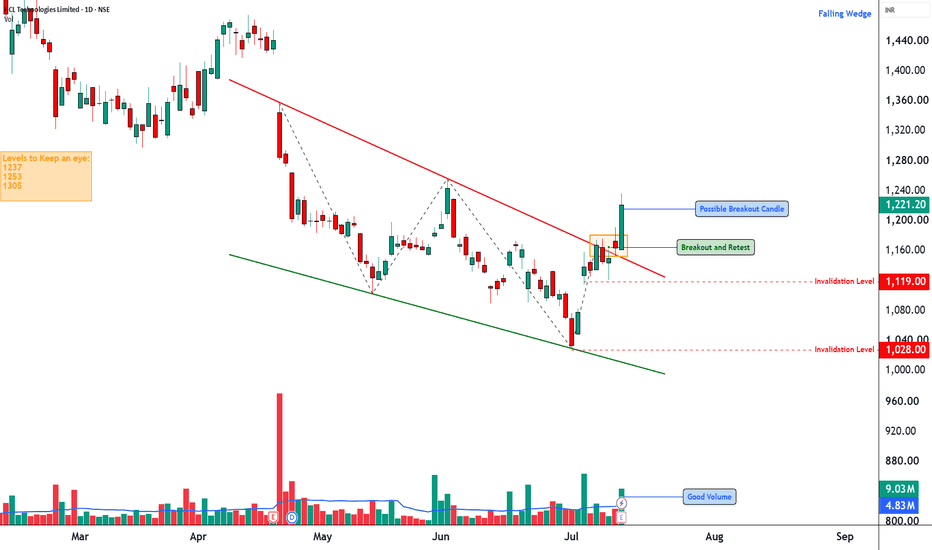
 Short
Short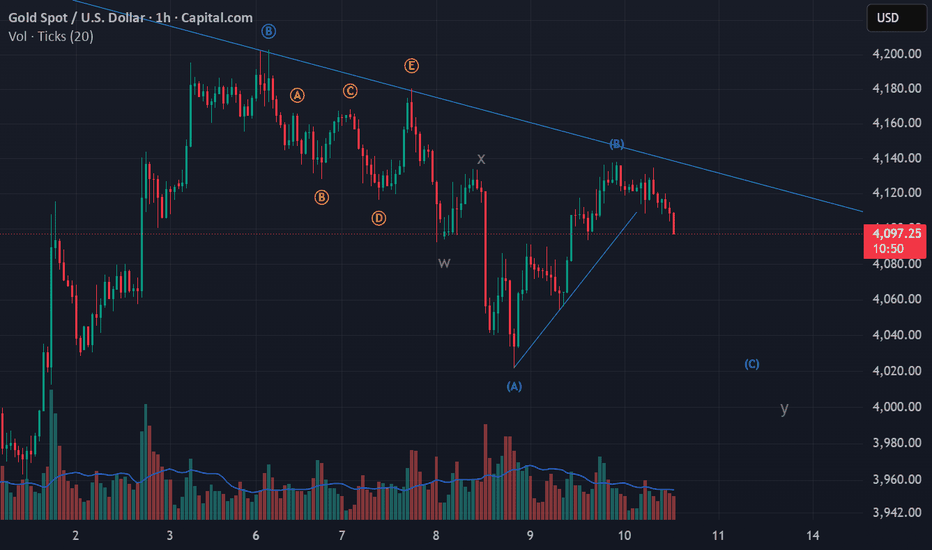
Gold Analysis & Trading Strategy | July 13-14✅ 4-Hour Trend Analysis
From the 4-hour timeframe, gold has already broken below the 4-hour Bollinger Band lower line at 4001.42 and has continuously lost key support levels around 4046 and 4020, indicating an accelerated downward move. However, the price has moved significantly away from the moving averages, suggesting the possibility of a short-term oversold rebound or sideways consolidation. Until gold regains and holds above the 4020–4047 area, the current trend cannot be considered reversed.
✅ 1-Hour Trend Analysis
From the 1-hour chart, gold has experienced consecutive large bearish candles, with the current price testing the 1-hour Bollinger Band lower line around 3988.40. The moving averages are clearly diverging downward, confirming a strong bearish structure on the 1-hour timeframe.
At this stage, chasing further downside carries increased risk. Gold may first consolidate around the 3986–4001 range, or rebound toward the 4020–4030 area before resuming the downward move. Only a sustained recovery above 4048 would reduce the short-term bearish pressure.
🔴 Key Resistance Levels
● 4020–4030: Short-term resistance zone
● 4048–4065: Key resistance zone
● 4090–4108: Structural resistance zone
🟢 Key Support Levels
● 3986–3965: Short-term support zone
● 3943–3940: Strong support zone
● 3924–3904: Structural support zone
✅ Trading Strategy Reference
🔰 Short Position Strategy: Focus on short opportunities after price rebounds into resistance areas.
👉 Sell Zone 1: 4020–4030
👉 Sell Zone 2: 4045–4060
🎯 TP: 4000 → 3986 → 3965 → 3943
⚠️ If gold regains 4048 and continues trading above this level, the short-term bearish momentum will weaken, and gold may further rebound toward 4082–4084.
🔰 Long Position Strategy: Wait for the price to stabilize and form a clear 1-hour reversal signal before considering long entries.
👉 Buy Zone 1: 3986–3970
👉 Buy Zone 2: 3950–3940
🎯 TP: 4000 → 4020 → 4045 → 4082
⚠️ The 4-hour and 1-hour trends are both clearly bearish at the moment. Long positions are considered counter-trend rebound trades, so position size should be controlled and profits should be taken in a timely manner. If gold breaks below 3943 decisively, the price may continue declining toward 3924 and even 3904.
🔔 If you find my analysis helpful, please like, share, and stay tuned for future updates. Your support is my motivation to continue sharing professional insights. Wishing everyone smooth trading and steady profits! Short 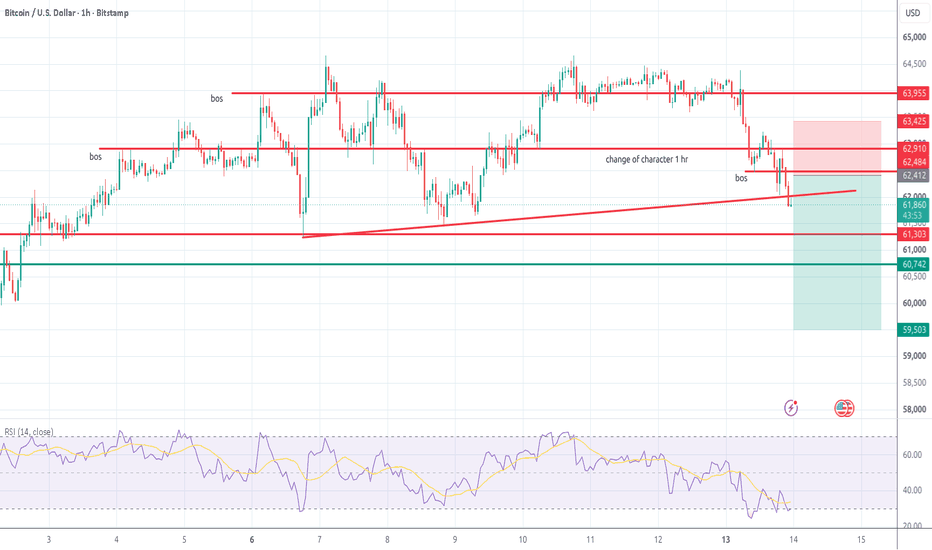
 Long
Long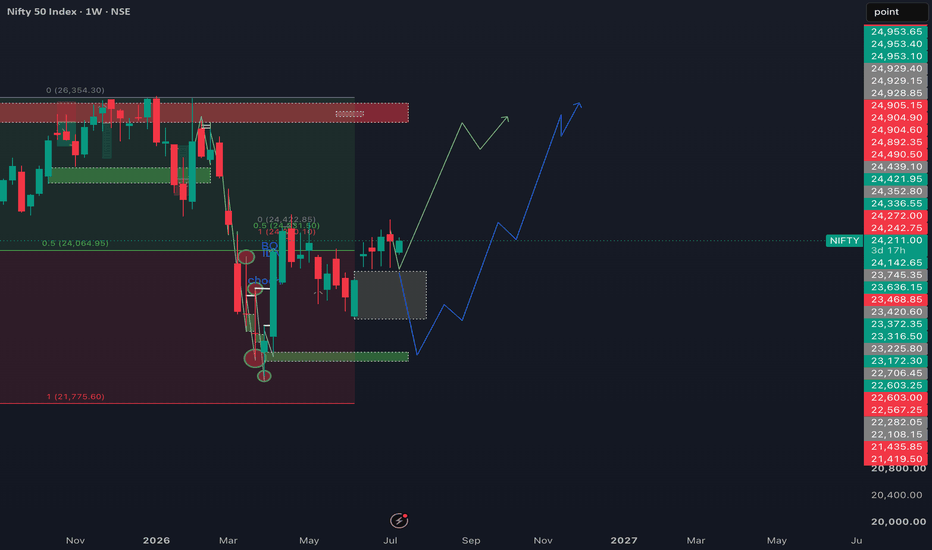
 Long
Long
XAUUSD – Gold Remains Heavy, Sellers Still Control The StructureXAUUSD – Gold Remains Heavy, Sellers Still Control The Structure
Gold is starting the new week under clear pressure.
Price is currently trading around 4,053 after breaking below the rising support structure. The chart shows that buyers failed to protect the trendline, while sellers are now trying to keep control below the 4,071 sell zone.
This is not a clean bullish recovery yet. Gold is still weak, and the next reaction around 4,071 may decide whether the market continues lower toward 4,004 and 3,955.
FUNDAMENTAL ANALYSIS
Gold is facing pressure as the U.S. dollar recovers, supported by higher oil prices and renewed inflation concerns.
Middle East tensions and the Hormuz headlines may create volatility, but rising inflation expectations can also support a more hawkish Fed outlook. That keeps pressure on gold because higher rates increase the opportunity cost of holding non-yielding assets.
For now, the fundamental tone is mixed, but the chart still favours sellers unless buyers can reclaim the broken structure.
TECHNICAL ANALYSIS – SMC + FIBONACCI
From an SMC perspective, gold has broken below the previous upward trendline and is now trading under a short-term sell zone.
The 4,071 area is important because it is marked as the current sell zone. If price pulls back into this level and rejects, sellers may continue to push price lower.
Below the current price, 4,022 is the nearest support. If gold loses this level, the next area to watch is the buy scalping zone around 4,004. This may create a short-term reaction, but it does not change the broader bearish view unless buyers show a strong reclaim.
The main downside target is the 2.618 liquidity area around 3,955. This is where the chart suggests sellers may try to draw price if bearish pressure continues.
KEY PRICE ZONES TO WATCH
Current price: 4,053
Sell zone: 4,071
Nearest support: 4,022
Buy scalping zone: 4,004
Target liquidity 2.618: 3,955
Bearish pressure remains: Below 4,071
Invalidation for sell view: Above 4,071
TRADING SCENARIOS
Sell Scenario – Priority View
Sell Zone: Around 4,071
Entry: Bearish rejection, failed reclaim, or lower-timeframe bearish CHoCH
SL: Above 4,071 or above the nearest swing high
TP1: 4,022
TP2: 4,004
TP3: 3,955
Breakdown Sell
Condition: Clean break below 4,022
Entry: Retest and bearish confirmation
Target: 4,004 then 3,955
Buy Scenario – Only Short-Term Reaction
Buy Zone: 4,004
Entry: Liquidity sweep, bullish rejection, or lower-timeframe bullish CHoCH
TP1: 4,022
TP2: 4,053
Invalidation: If price breaks and holds below 4,004, the buy reaction idea becomes weaker.
MY VIEW ON GOLD
My current view for gold is bearish while price stays below 4,071.
The chart shows sellers are still in control after the trendline break. A small bounce can happen from 4,022 or 4,004, but the stronger setup is still a sell reaction if price fails to reclaim 4,071.
For me, the key level is simple: 4,071.
If gold rejects from this zone, the next downside path toward 4,004 and 3,955 remains open. If buyers reclaim 4,071 with strength, then the short-term bearish pressure becomes weaker.
For now, gold is still heavy — and sellers have not lost control yet.
Do you think gold will reject from 4,071, or will buyers manage to reclaim this level first?
Short 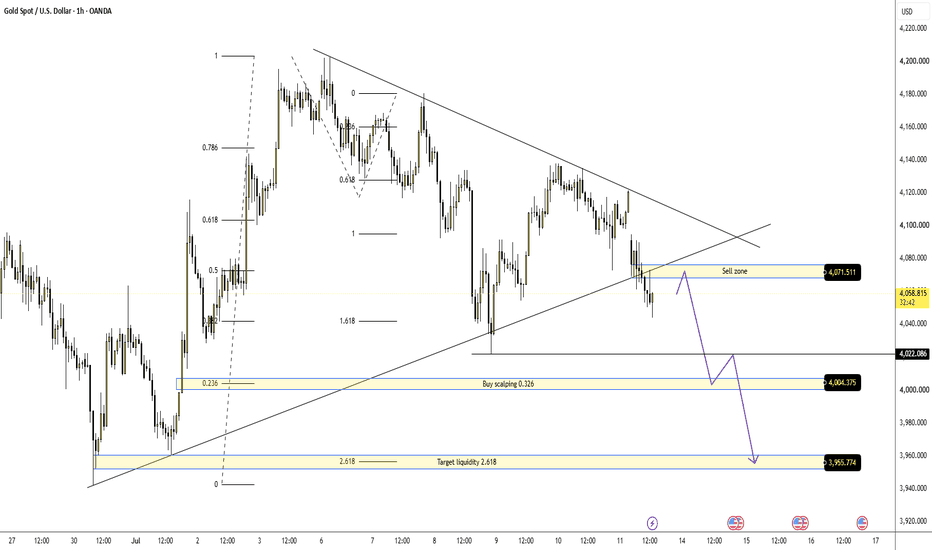
Long 
NIFTY : Trading levels and Plan for 14-Jul-2026Previous Close: 24,208.60 | Instrument: NIFTY 50 Index (Spot/Options)
Namaste Traders! 🙏 Here's my structured educational trading plan covering all three opening scenarios for tomorrow's session. Please treat this as a study framework to understand price action around key levels — not a buy/sell recommendation.
🟠 Note on Chart Lines: The Orange Zone (24,242–24,276) represents the "No-Trade / Sideways Zone" — price often chops here before choosing direction. Green = Bullish/Long bias. Red = Bearish/Short bias. Dashed lines = Probable/Unconfirmed trend (wait for confirmation).
🟢 SCENARIO 1: GAP UP OPENING (100+ points, i.e., open above 24,308)
📈 A gap-up of 100+ points shows strong overnight positive sentiment (global cues/FII flows). But remember — gap-ups often get "filled" or tested before continuation, so patience is key.
🟢 Bullish Continuation Plan:
⁘ If Nifty opens above 24,308 and sustains above 24,375 (Last Intraday Resistance) with strong volume, treat it as a breakout confirmation.
⁘ Entry: On a 15-min candle close above 24,375.
⁘ Target 1: 24,420 | Target 2: 24,461 (Extended Resistance).
⁘ Stop Loss: Below 24,320 (re-entry into opening zone invalidates breakout).
🔴 Gap-Up Reversal/Fade Plan (Dashed/Cautious):
⁘ If price opens with gap-up but immediately faces rejection near 24,375–24,400 and starts forming red candles, watch for a fade back into the Opening S/R zone (24,242–24,276).
⁘ This is a "maybe" scenario — confirm with a lower-high structure before shorting.
⁘ Target: 24,276 → 24,242. SL: Above the day's high.
⁘ ⁘ ⁘
💡 Action Tip: Never chase a gap-up directly. Let the first 15–30 mins candle close to confirm direction. Avoid buying naked calls right at open — IV crush + reversal risk is high.
🟡 SCENARIO 2: FLAT OPENING (within Opening S/R Zone: 24,242 – 24,276)
⚖️ A flat opening within this orange zone means the market is undecided. This is the "No-Trade Zone" — best approach is to wait and watch, not to force a trade.
🟠 Range-Bound Approach:
⁘ As long as price oscillates between 24,164 (Opening Support) and 24,276 (Opening Resistance), avoid directional option buying.
⁘ Best strategy here: Iron Condor / Short Straddle (for experienced traders only) to capture theta decay in sideways market.
🟢 Breakout Above Zone (Bullish Trigger):
⁘ Sustained move & candle close above 24,276 → opens door to 24,375 (Last Intraday Resistance).
⁘ Entry: Above 24,280 with volume confirmation.
⁘ SL: 24,242 (back inside zone = invalid).
🔴 Breakdown Below Zone (Bearish Trigger):
⁘ Candle close below 24,242 → 24,164 → 24,032 (Last Intraday Support) becomes the target zone.
⁘ Entry: Below 24,235.
⁘ SL: 24,276 (back inside zone = invalid).
⁘ ⁘ ⁘
💡 Action Tip: Flat opens are trap-prone. Wait for a clean breakout/breakdown candle with volume before entering options. Avoid FOMO trades in the first 15 minutes.
🔴 SCENARIO 3: GAP DOWN OPENING (100+ points, i.e., open below 24,108)
📉 A gap-down of 100+ points signals negative overnight sentiment. Similar to gap-ups, the first reaction (fill vs. continuation) determines the day's trend.
🔴 Bearish Continuation Plan:
⁘ If Nifty opens below 24,108 and sustains below 24,032 (Last Intraday Support) on a 15-min close, treat it as breakdown confirmation.
⁘ Entry: Below 24,032.
⁘ Target 1: 23,970 | Target 2: 23,902 (Extended Support).
⁘ Stop Loss: Above 24,080 (recovery back into support zone invalidates breakdown).
🟢 Gap-Down Recovery/Fade Plan (Dashed/Cautious):
⁘ If gap-down finds buyers early and starts reclaiming levels, watch for a pullback rally toward Opening S/R zone (24,164–24,242).
⁘ Confirm with higher-low structure before going long — this is a "maybe" reversal, not guaranteed.
⁘ Target: 24,164 → 24,242. SL: Below the day's low.
⁘ ⁘ ⁘
💡 Action Tip: In gap-down sessions, avoid panic-selling puts blindly. Wait for the first pullback/retest to gauge real strength of sellers before committing capital.
🛡️ OPTIONS TRADING — RISK MANAGEMENT TIPS
⁘ 🎯 Position Sizing: Never risk more than 2% of your capital on a single options trade.
⁘ ⏱️ Time Decay Awareness: Avoid buying far OTM options intraday — theta decay can eat profits even if direction is right.
⁘ 🚫 No Averaging on Losing Trades: If SL is hit, exit. Don't average down on options — it's not the same as equity.
⁘ 📉 IV Check: Before buying options, check India VIX — high IV can lead to premium crush post-move even if direction is correct.
⁘ 🔔 Use Alerts, Not Emotions: Set price alerts at key levels rather than staring at charts all day.
⁘ 💰 Book Partial Profits: Scale out at Target 1, trail SL to cost for the remaining position at Target 2.
⁘ 🕐 Avoid First 15 Minutes: Volatility is highest at open; let structure form before entering.
📝 SUMMARY & CONCLUSION
Tomorrow's session hinges on how price behaves around the Opening S/R zone (24,242–24,276).
⁘ A sustained move above 24,375 opens bullish targets toward 24,461.
⁘ A sustained move below 24,032 opens bearish targets toward 23,902.
⁘ Flat/range-bound action within the zone favors patience and non-directional strategies.
Across all scenarios, the golden rule remains: confirmation before entry, and strict stop-loss discipline. Markets reward patience, not predictions. 🧘♂️📚
⚠️ DISCLAIMER: I am not a SEBI registered analyst. This post is purely for educational purposes to help traders understand price structure, support/resistance behavior, and risk management concepts. This is not investment advice. Please consult a registered financial advisor and do your own research (DYOR) before making any trading/investment decisions. Trading in equities and options involves substantial risk of loss.
📚 Happy Learning & Trade Safe! 🙏 Long 
Bitcoin Remains Bearish Below $64K–$66K Despite Modest ReboundBitcoin has rebounded modestly from its July 1 low, while Ethereum has shown relative strength by avoiding a new July low.
However, Bitcoin continues to form lower highs and lower lows, keeping the broader trend bearish. The recent sideways action looks more like consolidation than a confirmed recovery.
Key Trading Levels
Resistance: $64,000–$66,000
Support: $53,000–$56,000
Downside Target: $40,000–$45,000
Outlook: Bearish to sideways
Bitcoin remains bearish unless it can reclaim and hold above $66,000.  Long
Long
 Long
Long
 Long
Long
Nifty 50 Trade Plan [14.07.2026: Tuesday]Probable Scenario Analysis and Trade Plan for Nifty 50 Index NSE:NIFTY for the 14th of July, 2026. The day is Tuesday.
🟢 Bullish Scenario
Be bullish if the price sustains above 24250 for at least 30 minutes and forms a sustained bullish candle. The probable bullish targets above 24250 would be - 24312.5 and 24375. There is an unfilled GAP at 24355.1. The price would receive strong resistance at 24375. Next, if the price sustains above 24375, then the probable bullish targets would be - 24437.5 and 24500.
🔴 Bearish Scenario
Be bearish if the price decisively breaks down below 24125 and sustains. In this case, the probable bearish targets would be - 24062.5 and 24000. There will be strong support at 24000. There is a minor unfilled GAP at 24981.9. Probably, the market would fill this GAP. Next, if the price decisively sustains below 24000, then there will be sharp selling. The probable bearish targets below 24000 would be - 23937.5 and 23875. There is an unfilled GAP at 24981.9.
🟡 No Trading Zone (NTZ): (24250 - 24125).
⏺ Range of Consolidation (ROC): (24375 - 24125).
Here, 24250 is the median of the ROC. The median works like an intraday sentiment evaluator. The price trading above the median would offer bullish sentiment, while the price trading below the median would trigger bearish sentiment within the ROC.
● Event
No high-impact event this week. No holidays this week. However, there is a NIFTY 50 weekly expiry. We can expect a price anomaly on the expiry day. Best to trade in the second half of the trading session. Lastly, geopolitical issues are omnipresent.
● Intraday Bias
Establish intraday bias with respect to the opening price. If the price sustains above the opening price, then don't think of shorting. Look for bullish trades only. On the contrary, if the price sustains below the opening price, then don't think of going long. Look for bearish trades in that case.
● Disclaimer + End Note
- All the analyses would fail in the case of a major gap up, gap down, or price structure anomaly. Thus, practice PRAGMATISM in the live session.
- Trade only if there is a set-up. Remember, not trading is an extension of the trading activity.
- Mark your points. Trade your points. Price is GOD. Anything can happen in the markets. Thus, trade what you see, not what you believe.
- Always PRACTICE RISK MANAGEMENT. Always PROTECT YOUR CAPITAL. Be RESPONSIBLE.
- Be Strategic. Be Courageous. Be Patient. Be Wise.
- Every day is a new day. Thus, do not carry the baggage of past successes or failures. Leave the gardens of winning and losing. Establish yourself in equanimity. Always think from a new perspective.
- Let the joy of trading drive your effectiveness, not greed or fear. Believe in Possibilities.
Happy Trading!


