Nifty : Intraday Trading Plan: 24-Jul-2026Date: 24th July 2026
Instrument: Nifty 50 Index
Timeframe: 15 Minutes
Current Close: 23,872.20
Overall Nifty Trend & Market Sentiment
The Nifty 50 has been witnessing a corrective phase from the recent swing high of 24,350. The price action shows a series of lower highs and lower lows, indicating a short-term Bearish Bias. However, the market is currently consolidating in a critical zone.
Primary Trend: Bearish (Correction from highs).
Intraday Bias: Neutral to Bearish (until 23,911 is crossed).
Key Observation: The market is currently sitting inside a "No Trade Zone" (23,835 - 23,911). This is a decision-making area.
🗺️ Key Levels to Watch
🔴 Major Resistance: 24,247.00
🔴 Last Intraday Resistance: 24,087.00
Opening Resistance: 23,911.00
🟠 Opening Support: 23,835.00
🔵 Last Intraday Support Zone: 23,609 - 23,650
🚀 Scenario 1: Gap Up Opening (100+ Points)
(Expected Open: ~23,975 or higher)
If Nifty opens with a strong Gap Up above 23,972, it immediately clears the "Opening Resistance" of 23,911. This invalidates the immediate bearish structure and suggests strong buying interest.
Action: Bullish / Long Side (Green Line) 🟢
Plan: Wait for the first 15-minute candle to settle. If the price sustains above 23,911, look for Call (CE) buying opportunities.
Target 1: 24,087 (Last Intraday Resistance).
Target 2: 24,247 (Major Resistance).
Stop Loss: Strict SL below the Opening Resistance (23,911).
Chart Logic: Follow the Solid Green Line. If the market faces rejection at 24,087, watch the Dashed Green Line which indicates a potential pullback or consolidation before the next move.
⚖️ Scenario 2: Flat Opening (Inside No Trade Zone)
(Expected Open: Between 23,835 and 23,911)
This is the most critical scenario. The market opens right inside the grey box labeled "No Trade Zone". This indicates indecision and a battle between buyers and sellers.
Action: No Trade / Sideways (Orange Line) 🟠
Plan: Do not trade inside this zone. Option buyers will suffer from Theta Decay (time value loss) here.
Bullish Trigger: Wait for a 15-min candle close above 23,911. Then go Long.
Bearish Trigger: Wait for a 15-min candle close below 23,835. Then go Short.
Chart Logic: The Orange Line/Zone represents the "No Trade" area. The Dashed Orange Line shows that even if it moves up to 24,000, it might face selling pressure and come back down (uncertainty).
📉 Scenario 3: Gap Down Opening (100+ Points)
(Expected Open: ~23,770 or lower)
If Nifty opens with a significant Gap Down below 23,772, it breaks the "Opening Support" of 23,835. This confirms the continuation of the bearish trend.
Action: Bearish / Short Side (Red Line)
Plan: Wait for a pullback to retest 23,835 as resistance. If rejected, enter Short (PE buying).
Target 1: 23,700 (Psychological support).
Target 2: 23,609 - 23,650 (Last Intraday Support Zone).
Stop Loss: Above the Opening Support (23,835).
Chart Logic: Follow the Solid Red Line. The Dashed Teal/Green Line at the bottom indicates that once the price hits the support zone (23,609), a reversal or bounce is possible, so book profits there.
🎓 Educational Insight: Understanding the Chart Lines
🟠 Orange Line/Zone: Represents the "No Trade Zone". In trading, consolidation zones are dangerous for option buyers. The market lacks direction here.
🟢 Green Line: Indicates a Bullish/Long trend. When price breaks resistance, momentum shifts upward.
🔴 Red Line: Indicates a Bearish/Short trend. When price breaks support, panic selling or profit booking ensues.
〰️ Dashed Lines: These indicate "Maybe" or Uncertainty. For example, a dashed line after a rise suggests the trend might pause or pull back. It warns traders not to chase the price blindly at resistance levels.
🛡️ Risk Management Tips for Options Trading
🔹 Avoid the "No Trade Zone": Never buy options when the market is sideways (Flat Open scenario). Time decay (Theta) will eat your premium.
🔹 Position Sizing: Never risk more than 2-5% of your total capital on a single intraday trade.
🔹 Stop Loss is Mandatory: In options, premiums can drop 20-30% in minutes. Always have a system SL (e.g., 10-15% of premium price).
🔹 Trail your SL: If Nifty moves 50 points in your favor, move your Stop Loss to your entry price (Cost-to-Cost) to make it a risk-free trade.
📝 Summary & Conclusion
For 24-Jul-2026, the Nifty is at a crucial junction.
Bullish View: Only valid above 23,911. Targets are 24,087 and 24,247.
Bearish View: Only valid below 23,835. Targets are 23,609 - 23,650.
Neutral View: Between 23,835 and 23,911. Stay away.
The chart suggests that the path of least resistance is currently downwards (Red Line), but a Gap Up can change the narrative instantly. Respect the levels and wait for confirmation!
⚠️ Disclaimer:
I am not a SEBI registered analyst. This post is for educational purposes only and does not constitute financial advice. Trading in F&O involves high risk and can lead to capital loss. Please consult your financial advisor before taking any trades. Past performance is not indicative of future results.
#Nifty50 #TradingPlan #IntradayTrading #OptionBuying #TechnicalAnalysis  Long
Long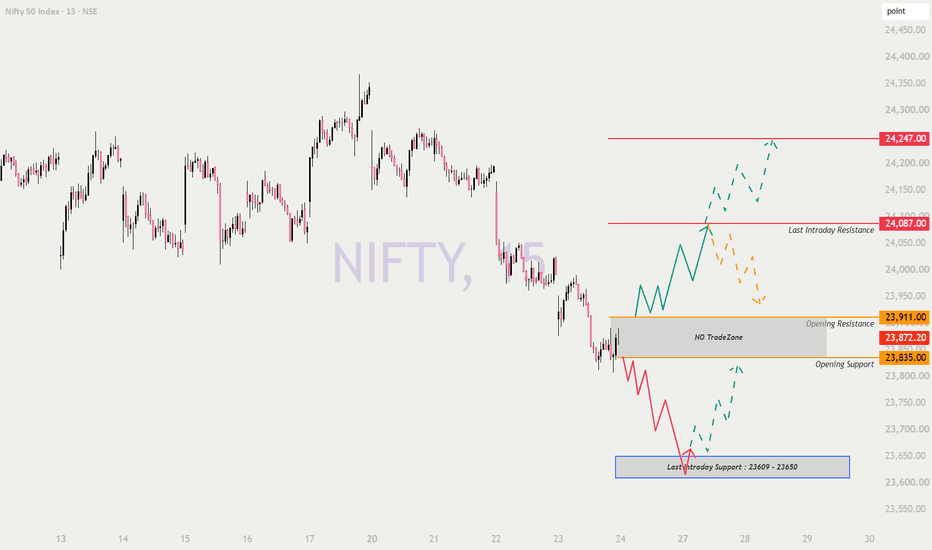
Short 
Nifty at AVWAP Support | Potential Short-Covering BounceAfter two consecutive sessions of selling pressure, I believe Nifty could be setting up for a short-covering rally in the next session.
On the daily timeframe, this Anchored VWAP (AVWAP) has acted as a strong support zone in the past, where buyers stepped in and defended the level. I'm watching to see if history repeats itself, provided the market doesn't open with a significant gap-down.
Trade Plan
✅ Wait for the first hourly candle to close above the AVWAP.
✅ If confirmed, I'll look for a long entry.
🛑 Stop Loss: Previous day's low.
🎯 Target: 1:4 Risk-to-Reward.
This is a confirmation-based setup, not a prediction. If buyers successfully defend this AVWAP level, the probability of a relief rally increases. However, a decisive break below the previous day's low would invalidate the bullish view.
Market always comes first—I'll follow price, not my bias.
📌 What do you think? Do you agree that this AVWAP level can trigger a short-covering bounce, or do you expect the downtrend to continue? Any disagreement or alternate view is welcome. Long 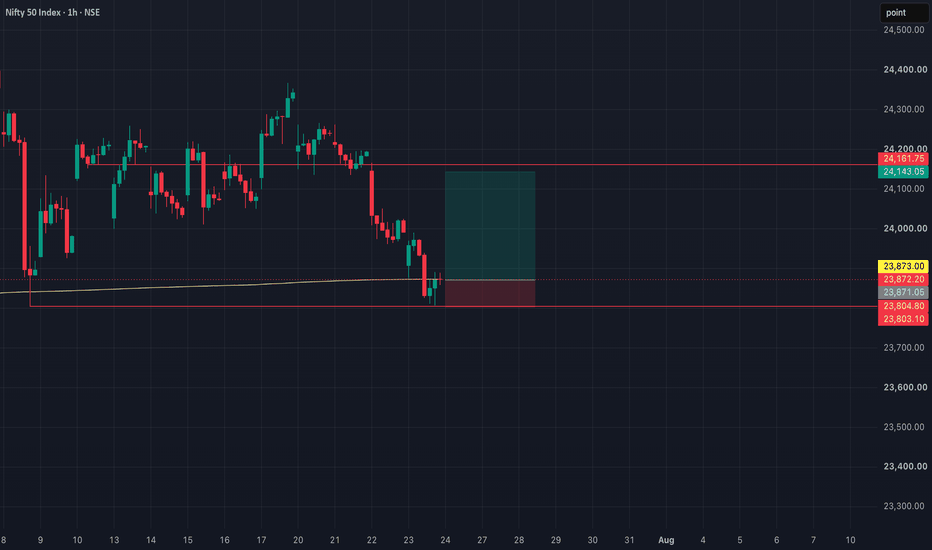
Short 
 Long
Long
 Long
Long
Nifty MidCap Select Trade Plan [24.07.2026: Friday]Probable Scenario Analysis and Trade Plan for the Nifty MidCap Select Index NSE:NIFTY_MID_SELECT for the 24th of July, 2026. The day is Friday.
🟢 Bullish Scenario
There is no observable bullish setup. Doubt every up move. In fact, an up move will act as an opportunity to short the market. However, if the price breaks out above 14600, then a weak bullish move can be expected. The probable weak bullish targets above 14600 would be - 14650 and 14700.
🔴 Bearish Scenario
Presently, the price is in a bearish phase. Stay bearish if the price remains below 14400. The probable bearish targets below 14400 would be - 14350, 14300, and 14250. There is an unfilled gap near 14250.
🟡 No Trading Zone (NTZ): (14600 - 14400).
Here, the zone (14600 - 14550) is a super strong resistance. It is very difficult for the price to break out above this zone.
⏺ Range of Consolidation (ROC): (14600 - 14400).
Here, 14500 is the median of the ROC. The median works like an intraday sentiment evaluator. The price trading above the median would offer bullish sentiment, while the price trading below the median would trigger bearish sentiment within the ROC.
● Event
No high-impact event this week. It is the last day of the week. Lastly, geopolitical issues are omnipresent.
● Intraday, Weekly, and Monthly Bias
Establish bias with respect to the opening price (of the particular session - Intraday, Weekly, and Monthly). If the price sustains above the opening price, then don't think of shorting. Look for bullish trades only. On the contrary, if the price sustains below the opening price, then don't think of going long. Look for bearish trades in that case.
● Disclaimer + End Note
- All the analyses would fail in the case of a major gap up, gap down, or price structure anomaly. Thus, practice PRAGMATISM in the live session.
- Trade only if there is a set-up. Remember, not trading is an extension of the trading activity.
- Mark your points. Trade your points. Price is GOD. Anything can happen in the markets. Thus, trade what you see, not what you believe.
- Always PRACTICE RISK MANAGEMENT. Always PROTECT YOUR CAPITAL. Be RESPONSIBLE.
- Be Strategic. Be Courageous. Be Patient. Be Wise.
- Every day is a new day. Thus, do not carry the baggage of past successes or failures. Leave the gardens of winning and losing. Establish yourself in equanimity. Always think from a new perspective.
- Let the joy of trading drive your effectiveness, not greed or fear. Believe in Possibilities.
Happy Trading! NIFTY DAILY / Short Range Level Analysis for 24th Jul 2026🔕 SGMN SplD BULLISH Above => 23907.
🔕 SGMN SplD Bearish BELOW => 23833.
Mentioned analysis based on 2 consecutive candle close in 15 min Time Frame.
━━━━━🟥🟧🟨🟩🟦🟪⬛━━━━━
💥Level Interpretation / description:
✍🏻L#1: If the candle crossed & stays above the “Buy Gen”, it is treated / considered as Bullish bias. Cfm=> Confirmation.
L#2: Possibility / Probability of REVERSAL near 🔕RL/TF1 & 🔔RL/TF2
L#3: If the candle stays above “Sell Gen” but below “Buy Gen”, it is treated / considered as Sidewise. Aggressive Traders can take Long position near “Sell Gen” either retesting or crossed from Below & vice-versa i.e. can take Short position near “Buy Gen” either retesting or crossed downward from Above.
L#4: If the candle crossed & stays below the “Sell Gen”, it is treated / considered a Bearish bias.
L#5: Possibility / Probability of REVERSAL near 🔕RL/TF1 & 🔔RL/TF2
HZB (Buy side) & HZS (Sell side) => Hurdle Zone,
✍🏻 *** Specialty of “HZB#1, HZB#2 HZS#1 & HZS#2” is Sidewise (behaviour in Nature)
Rest Plotted and Mentioned on Chart
Color code Used:
Green, BLUE =. Positive bias.
Safron, RED =. Negative bias.
RED in Between Green means Trend Finder / Momentum Change
/ CYCLE Change and Vice Versa.
Notice One thing: HOW LEVELS are Working.
Use any Momentum Indicator / Oscillator or as you "USED to" to Take entry.
━━━━━🟥🟧🟨🟩🟦🟪⬛━━━━━
⚠️ DISCLAIMER:
The information, views, and ideas shared here are purely for educational and informational purposes only. They are not intended as investment advice or a recommendation to buy, sell, or hold any financial instruments. I am not a SEBI-registered financial adviser.
Trading and investing in the stock market involves risk, and you should do your own research and analysis. You are solely responsible for any decisions made based on this research.
"🔔As HARD EARNED MONEY IS YOUR's, So DECISION SHOULD HAVE TO BE YOUR's".
━━━━━🟥🟧🟨🟩🟦🟪⬛━━━━━
❇️ Follow notification about periodical View
💥 Do Comment for Stock WEEKLY Level Analysis.🚀
📊 Do you agree with this view?
✈️ HIT THE PLANE ICON if this technical observation resonates with you. It will Motivate me.
━━━━━🟥🟧🟨🟩🟦🟪⬛━━━━━
💡 If You LOOKING any CHART & want for Level and ANALYZE?
Share your desired stock names in the comments below! I will try to analyze the chart Levels, patterns and share my technical view (so far my Knowledge).
If Viewers think It can identify meaningful setups. Looking forward to hearing from all of you — let's keep this discussion going and help each other make better trading decisions.
___________🔕^^^⚫⚪^🙏🏼🙏🏼🙏🏼^⚪⚫^^^🔔___________ Nifty 50 Trade Plan [24.07.2026: Friday]Probable Scenario Analysis and Trade Plan for the Nifty 50 Index NSE:NIFTY for the 24th of July, 2026. The day is Friday.
🟢 Bullish Scenario
There is no observable bullish setup. Doubt every up move. In fact, an up move will act as an opportunity to short the market. However, if the price breaks out above 24000, then a weak bullish move can be expected. The probable weak bullish targets above 24000 would be - 24050 and 24100. Please note, it is highly recommended to avoid executing bullish trades. It might be a trap. The market is in a perfectly lower-lows and lower-highs structure.
🔴 Bearish Scenario
Presently, the price is in a bearish phase. However, wait for a decisive breakdown below 23800. Stay bearish if the price remains below 23800. The probable bearish targets below 23800 would be - 23750, 23700, and 23650.
🟡 No Trading Zone (NTZ): (24000 - 23800).
Here, the zone (24000 - 23800) is a super strong resistance. It is very difficult for the price to break out above this zone.
⏺ Range of Consolidation (ROC): (24000 - 23800).
Here, 23900 is the median of the ROC . The median works like an intraday sentiment evaluator. The price trading above the median would offer bullish sentiment, while the price trading below the median would trigger bearish sentiment within the ROC.
● Event
No high-impact event this week. It is the last day of the week. Lastly, geopolitical issues are omnipresent.
● Intraday, Weekly, and Monthly Bias
Establish bias with respect to the opening price (of the particular session - Intraday, Weekly, and Monthly). If the price sustains above the opening price, then don't think of shorting. Look for bullish trades only. On the contrary, if the price sustains below the opening price, then don't think of going long. Look for bearish trades in that case.
● Disclaimer + End Note
- All the analyses would fail in the case of a major gap up, gap down, or price structure anomaly. Thus, practice PRAGMATISM in the live session.
- Trade only if there is a set-up. Remember, not trading is an extension of the trading activity.
- Mark your points. Trade your points. Price is GOD. Anything can happen in the markets. Thus, trade what you see, not what you believe.
- Always PRACTICE RISK MANAGEMENT. Always PROTECT YOUR CAPITAL. Be RESPONSIBLE.
- Be Strategic. Be Courageous. Be Patient. Be Wise.
- Every day is a new day. Thus, do not carry the baggage of past successes or failures. Leave the gardens of winning and losing. Establish yourself in equanimity. Always think from a new perspective.
- Let the joy of trading drive your effectiveness, not greed or fear. Believe in Possibilities.
Happy Trading!  Long
Long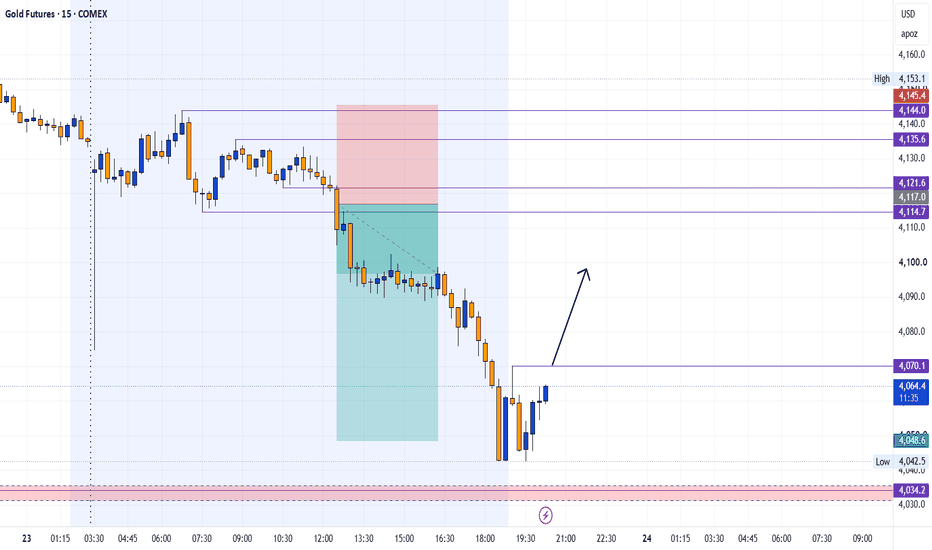
Short 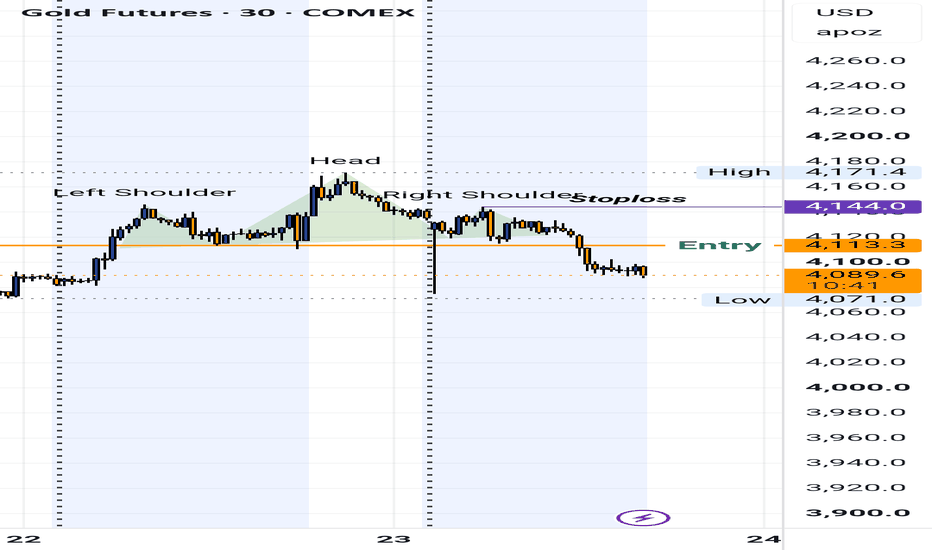
GOLD XAUUSD Extreme POI Buy Setup–Liquidity Sweep Completed
Gold experienced an aggressive bearish expansion after failing to sustain above the 4,120 region, sweeping sell-side liquidity and driving price directly into the Extreme Point of Interest (POI) around the 4,030–4,040 zone. This area aligns with a previously unmitigated demand zone and represents a high-probability reaction point.
From a market structure perspective, the recent decline appears overextended, suggesting that institutional participants may use this discount level for accumulation. The current candle behavior indicates seller exhaustion, while the liquidity sweep beneath short-term lows increases the probability of a counter-trend move.
A sustained hold above the Extreme POI could trigger a bullish market structure shift (MSS) on the lower timeframes, opening the path toward:
Traders should monitor for bullish confirmation signals such as engulfing candles, higher lows, or a break of the immediate bearish structure before committing to long positions. As long as price remains above the POI, the risk-to-reward profile continues to favor buyers.
Long 
 Long
Long
XAUUSD — Supply Rejection Sell Setup
Market Context
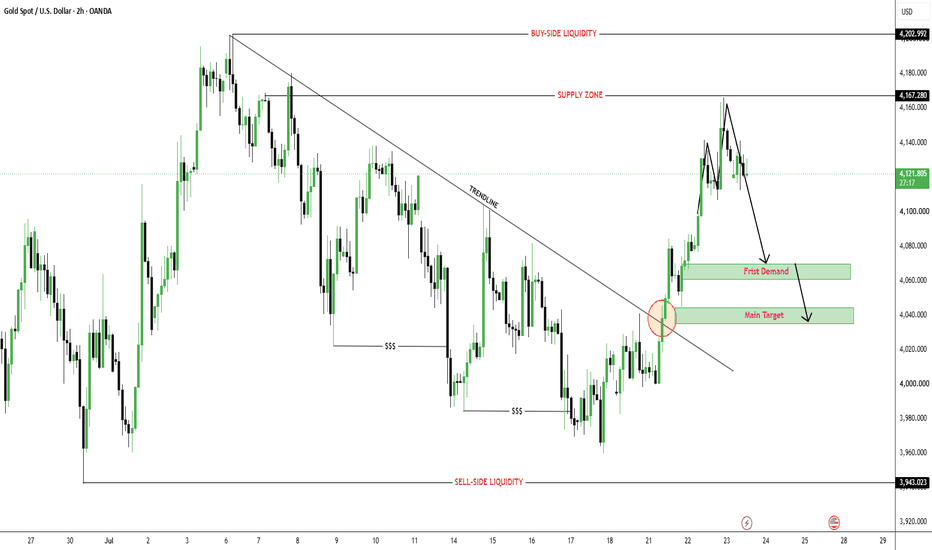
Gold is trading around $4,122 after breaking above the descending trendline and expanding into the $4,168.769 supply area. The breakout improved short-term momentum, but price failed to maintain the initial push and is now reacting below supply.
The preferred sell idea is not to chase price at the current level. A retracement toward the recent high and supply zone would offer a cleaner location to assess whether sellers can regain control.
SMC View
The trendline breakout created a bullish displacement, but price has moved into a higher-timeframe supply area where buy-side liquidity may attract selling pressure. This makes the upper range the main decision zone.
Because the recent structure is still bullish, a sell setup requires clear confirmation. Bearish rejection followed by a lower-timeframe MSS or CHOCH would indicate that the upward move is losing strength.
Main Trading Scenario
Condition:
Gold retraces toward the $4,140–$4,168.769 supply area and forms a clear bearish rejection. A lower-timeframe bearish MSS or CHOCH is required before entry.
Entry: $4,140–$4,168.769 after bearish confirmation
SL: Above $4,168.769 and the rejection high
TP1: $4,122
TP2: $4,056–$4,068
TP3: $4,029–$4,040
Key Zones to Watch
Current price: $4,122.645
Main sell zone: $4,140–$4,168.769
Buy-side liquidity: $4,202.511
First demand: $4,056–$4,068
Main target: $4,029–$4,040
Invalidation: Acceptance above $4,168.769
Confirmation: Bearish rejection with MSS or CHOCH
Prime Gold View
The sell bias depends on price remaining below the $4,168.769 supply level and confirming bearish structure. The preferred plan is to wait for a retracement rather than sell in the middle of the current range.
If sellers regain control, price could rotate toward $4,056–$4,068 and potentially $4,029–$4,040. Acceptance above supply would weaken the current setup.
No confirmation, no trade. Short