Eternal Ltd Q1 FY27: Fundamentals Strong, Charts NeutralThis analysis is published solely for educational and informational purposes. The views expressed are based on publicly available information and technical chart analysis and should not be construed as investment advice, a recommendation, or an offer to buy or sell any financial instrument. Stock market investments are subject to market risks, and past performance does not guarantee future results. Investors and traders should conduct their own research and consult a SEBI-registered investment advisor before making any investment decisions.
Overview
Eternal Ltd reported its Q1 FY27 financial results with strong year-on-year growth in both revenue and profitability. Following the earnings announcement, the stock continues to trade near its recent highs while entering a consolidation phase on the daily and lower timeframes.
From a technical perspective, the long-term trend remains positive as the price continues to trade above its key moving averages. However, short-term price action suggests that the stock is currently attempting to establish direction after a strong rally.
Q1 FY27 Earnings Highlights
According to the company's quarterly results:
Consolidated net profit increased 268% YoY to ₹92 crore.
Revenue from operations rose 182% YoY to ₹20,211 crore.
Sequentially (QoQ), revenue improved while net profit declined compared to the previous quarter, indicating mixed short-term earnings momentum despite strong annual growth.
Growth was supported by continued expansion across the company's businesses, with the quick commerce segment remaining a significant contributor.
The quarterly numbers indicate continued business expansion, although investors may also monitor profitability trends over the coming quarters.
Daily Chart Analysis (1D)
The daily chart continues to reflect a constructive trend.
Technical Observations
Price is trading above the 20, 50, 100 and 200-period moving averages.
The broader higher high and higher low structure remains intact.
RSI is around 61, indicating positive momentum without entering extreme overbought territory.
After the recent rally toward the ₹300 zone, price has started moving sideways, suggesting consolidation rather than a confirmed trend reversal.
Overall, the primary trend remains positive while the stock digests recent gains.
4-Hour Chart Analysis
The 4-hour timeframe highlights a range-bound structure.
Observations
Price is oscillating between nearby support and resistance levels.
RSI is near 53, reflecting balanced momentum.
Moving averages continue to slope upward, indicating that the intermediate trend remains constructive.
No confirmed bearish trend reversal is visible at present.
This suggests that buyers and sellers are currently in equilibrium while awaiting the next directional move.
1-Hour Chart Analysis
The hourly chart reflects short-term consolidation.
Key Points
Price is trading close to the short-term moving averages.
RSI is around 48, indicating neutral momentum.
Intraday volatility has reduced following the recent earnings-related move.
Volume has moderated compared to the breakout sessions earlier in the month.
Short-term traders may prefer to wait for confirmation before assuming a new trend.
Key Technical Levels
Support
Immediate Support: ₹285
Strong Support: ₹280
Major Support Zone: ₹269–₹265
Resistance
Immediate Resistance: ₹290
Major Resistance: ₹300
These levels are based on recent price action and may evolve as new market data becomes available.
Conclusion
Eternal Ltd's Q1 FY27 results reflected strong year-on-year growth in revenue and consolidated net profit, supported by continued business expansion.
From a technical perspective, the stock continues to maintain its broader uptrend while consolidating below the ₹300 region. Price action across the daily, 4-hour, and hourly charts suggests that market participants are currently assessing the next directional move after a strong rally.
As always, traders should monitor price action, volume, and broader market conditions before making trading decisions.  Long
Long
 Long
Long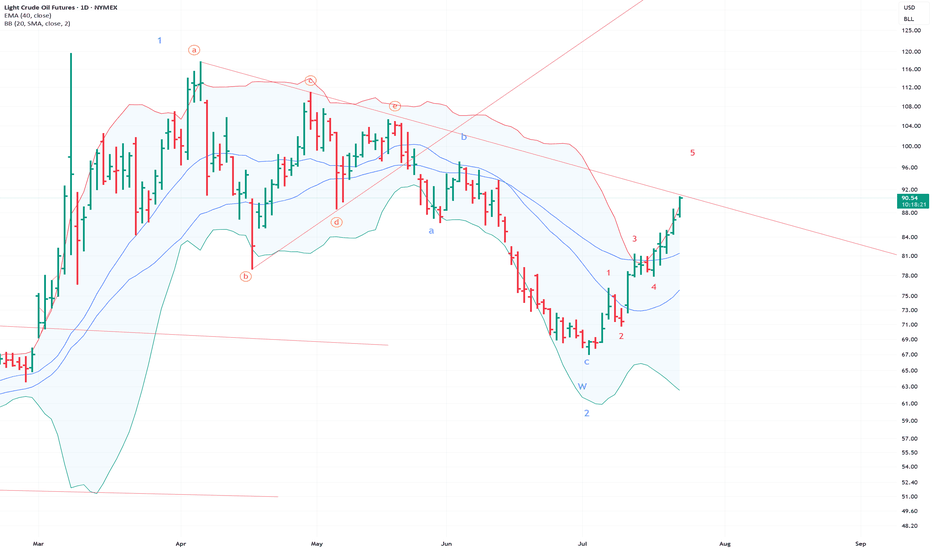
EMAMIPAP: Extreme Valuation Dis. Meets Multi-Timeframe Bull. BOOverview :
EMAMIPAP (Emami Paper Mills Limited) is exhibiting an explosive trend reversal on the daily (1D) and weekly (1W) charts, trading near the ₹122.88 level. The stock has delivered staggering momentum (+35.1% in 1 week and +57.4% over 6 months), backed by a massive 380% YoY net income surge and an extraordinary valuation discount relative to its paper sector peers.
1. Technical Analysis and Trend Direction
Trend Alignment: The technical structure reflects strong bullish alignment across higher timeframes. The daily gauge rates a "Strong Buy" (16 buy signals vs. 1 sell), with weekly (1W) and monthly (1M) charts also aligned in "Strong Buy" territory.
Momentum Oscillators: The daily RSI stands at an overbought 88.68 (weekly RSI at 78.5 and monthly RSI at 58.8). While an overbought daily RSI warrants caution for a potential short-term pullback or consolidation, the MACD indicator confirms robust bullish expansion (MACD at 6.52 vs Signal line at 3.14).
Immediate Resistance Levels: Watch ₹133.70 (52-week high) and ₹146.12 (weekly decisive entry level).
Macro Resistance Target: The ultimate multi-year chart ceiling sits at ₹204.95 (2019 onwards yearly range high).
Immediate Support Levels: Watch ₹122.00 (broken swing high resistance turned support) and ₹114.80 (secondary structural support).
Macro Support Levels: Watch ₹81.38 (9-month support) and ₹57.50 (3-month support near the 52-week low of ₹55.00).
2. Fundamental Analysis and Financial History
Earnings & Operational Expansion: TTM Revenue expanded by +6.6% YoY to ₹20.1B, while EBITDA surged +78.5% YoY to ₹2.4B and Net Income exploded +379.9% YoY to ₹937M (diluted EPS up +404.7% to ₹13.57).
Multi-Year Financial Trajectory: After facing revenue headwinds following FY2021 (-16.1% in FY2022, -3.3% in FY2023, and -0.9% in FY2024), revenue has stabilized and returned to positive growth. Free cash flow turned strongly positive at ₹1.16B. Additionally, total debt has been reduced significantly from its FY2018 peak of ₹15.5B down to ₹8.17B.
Deep Valuation Discount: EMAMIPAP is heavily discounted across all key multiples—trading at a P/E of 9.1x (73% discount to the sector median of 32.9), EV/EBITDA of 3.0x (85% discount to the median of 20.4), and P/S of 0.4x (87% discount to the median of 3.2). Overall, it trades at an ~82% discount to its broader sector.
3. Paper Sector Peer Comparison
JKPAPER: Current Price ₹391.55 (+0.58% 1D), Market Cap ₹70.55B, P/E 24.63x, YoY Revenue Growth +6.5%, Analyst Consensus Strong Buy.
WSTCSTPAPR: Current Price ₹560.70 (+2.13% 1D), Market Cap ₹36.10B, P/E 24.59x, YoY Revenue Growth +5.7%, Analyst Consensus Strong Buy.
SESHAPAPER: Current Price ₹229.64 (+4.09% 1D), Market Cap ₹13.91B, P/E 16.76x, YoY Revenue Growth -2.5%, No Consensus Rating.
ANDHRAPAP: Current Price ₹62.08 (+2.83% 1D), Market Cap ₹12.05B, P/E 66.31x, YoY Revenue Growth +10.4%, Analyst Consensus Strong Buy.
Peer Takeaway: While EMAMIPAP is the smallest by market cap (₹7.17B) in this group, it commands the lowest P/E ratio (9.1x) and leads the entire paper sector in 1-week (+35.1%) and 1-month (+39.7%) momentum.
4. Directional Bias and 1-to-3 Year Holding Strategy
Directional Bias: DECISIVELY BULLISH (1-to-3 Year Horizon)
Trade Execution Strategy: Due to the overbought daily RSI (88.68), a minor near-term retest or sideways cooling toward the ₹114.80 – ₹122.00 support band is possible. For a 1-to-3-year investment horizon, phased accumulation within this demand zone offers a high-probability risk-to-reward ratio. A decisive weekly close above ₹133.70 – ₹146.12 will confirm structural price discovery toward the ₹204.95 multi-year target.
Disclaimer: This analysis is for educational purposes only and does not constitute financial advice. Always perform your own research and manage your risk/position sizing accordingly.  Long
Long
 Short
Short
XAUUSD — 4,134 Was the Trap XAUUSD — 4,134 Was the Trap
Gold pushed into the upper area with a strong four-day recovery, but this latest reaction feels like the market finally showed us where buyers started running out of breath.
Price climbed aggressively from the lower order block around 4,003.038, broke structure, and reached the upper side near 4,134.920. At first, that looked like buyers were taking control again. But when price touched that higher area, it failed to continue cleanly and started rolling back down with a sharp rejection. That is the part that catches my eye.
For newer traders, this is where the trap story becomes important. A strong rally into a previous high can attract late buyers, but if price cannot hold above that area, smart money may simply be using the move to collect buy-side liquidity before sending price back into the imbalance below.
That is why my main view is bearish for a corrective move while gold stays below 4,134.920. The broader context also fits this idea, with oil-driven inflation concerns, Fed expectations, and gold now waiting for confirmation around the daily structure. RSI near the middle tells me momentum is not clearly one-sided yet, so the next reaction matters.
The first key area is the FVG around 4,068.875 - 4,080. If price only gives a weak bounce there, I would expect sellers to keep pressing toward 4,044.060, and then possibly back into the order block around 4,003.038.
This bearish idea becomes weak only if gold reclaims 4,134.920 and holds above it. That would tell me the rejection failed, and buyers may try to continue higher instead.
Key price zones to watch
Current reaction area: 4,090 - 4,110
Main supply / trap zone: 4,134.920
Bearish confirmation zone: clean break below 4,068.875
First downside FVG target: 4,068.875 - 4,080
Next downside level: 4,044.060
Main downside order block target: 4,003.038
Lower liquidity if selling expands: 3,983.545
Invalidation: clean reclaim and hold above 4,134.920
Do you see this 4,134 rejection as a real liquidity trap, or would you wait for the FVG at 4,068 to break before trusting the bearish move? Short 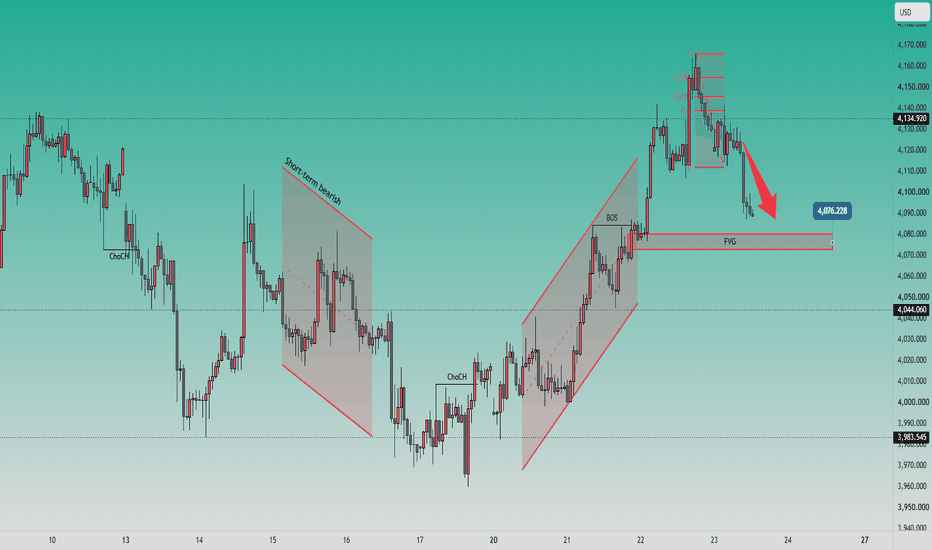
 Long
Long
# **XAU/USD (Gold) Technical Analysis – Bullish Retest Opportuni### **Market Overview**
Gold remains in a **strong bullish market structure**, despite the latest corrective decline. The recent impulsive rally established a series of **higher highs and higher lows**, confirming that buyers are still controlling the broader trend.
After reaching a swing high near **4,160**, price has entered a healthy pullback, which appears to be targeting a previously broken resistance zone that is now expected to act as **new support**.
---
## **Market Structure**
* ✅ Overall trend remains **bullish**.
* ✅ Previous resistance around **4,055–4,062** has been broken convincingly.
* ✅ The current decline looks corrective rather than a bearish reversal.
* ✅ As long as price holds above the highlighted support zone, the bullish structure remains intact.
---
## **Key Support Zone**
**Support:** **4,055 – 4,062**
This area is technically significant because it combines:
* Previous breakout resistance
* Fresh demand zone
* Potential liquidity area
* Expected buy-on-retest level
A successful rejection from this zone would indicate that buyers are defending the breakout.
---
## **Resistance Levels**
Immediate resistance:
* **4,100**
* **4,120**
* **4,140**
* Major swing high near **4,160**
A break above these levels would confirm continuation of the primary uptrend.
---
## **Bullish Trade Setup**
**Entry:**
* Wait for price to retrace into the **4,055–4,062 support zone**.
* Look for bullish confirmation such as:
* Bullish engulfing candle
* Pin bar rejection
* Strong buying momentum
* Higher low formation
**Stop Loss:**
* Below **4,050** or below the recent swing low for additional protection.
**Take Profit Targets:**
* **TP1:** 4,095
* **TP2:** 4,120
* **TP3:** 4,140
* **Final TP:** 4,160+
---
## **Technical Outlook**
The correction currently appears to be a **retracement within an established uptrend**, not a change in market direction. Pullbacks into former resistance zones are common during strong bullish trends and often provide higher-probability buying opportunities.
A confirmed bullish reaction from support could trigger another impulsive leg higher, with buyers targeting the recent highs.
However, if price closes decisively below the highlighted support zone, the bullish scenario would weaken, increasing the likelihood of a deeper correction toward lower support levels.
---
## **Trading Bias**
**Bias:** **Bullish**
**Strategy:** **Buy the retest of the 4,055–4,062 support zone after bullish confirmation.**
A disciplined approach—waiting for price action confirmation rather than buying immediately—offers a more favorable risk-to-reward setup while trading in the direction of the prevailing trend.
Long 
XAUUSD — Buy the Liquidity PullbackFundamental Analysis
Gold has pulled back from its recent two-week high as higher crude oil prices, stronger US Treasury yields, and renewed expectations of further Federal Reserve tightening continue to cap the upside. Ongoing tensions in the Middle East may still support safe-haven demand, but the resilience of the US Dollar is likely to keep short-term volatility elevated.
Technical Analysis
On the 1-hour chart, XAUUSD is trading around 4,125 after facing rejection from the 4,157–4,165 resistance zone. The overall market structure remains bullish, supported by consecutive Break of Structure (BOS) formations and a series of higher highs.
A deeper retracement towards the 4,062–4,070 region would allow price to retest the key Fibonacci support along with the previous breakout structure. If buyers defend this area with strong bullish confirmation, gold could recover towards 4,100, revisit 4,157–4,165, and potentially continue its rally towards the 4,220–4,228 target zone.
Important Key Levels
Current Price: 4,125.29
Main Buy Zone: 4,062–4,070
Short-term Support: 4,080–4,100
Short-term Resistance: 4,157–4,165
Liquidity Zone: 4,157–4,165
Main Target: 4,220–4,228
Invalidation: Below 4,045
Trading Scenario
Main Buy Setup
Entry: 4,062–4,070
Stop Loss: 4,045
Take Profit 1: 4,100
Take Profit 2: 4,157–4,165
Take Profit 3: 4,220–4,228
Buy Conditions
Wait for the price to retrace into the main buy zone and look for clear bullish confirmation before entering. Signals such as a long lower wick, a bullish engulfing candle, a failed breakdown, or a 1-hour candle closing back above 4,070 would indicate renewed buying interest. If the price breaks below 4,045 and sustains there, the bullish outlook will be invalidated.
Overall Outlook
The 1-hour trend remains bullish, although the current price is trading between the key support and resistance levels. Rather than chasing the market, the preferred strategy is to wait patiently for a pullback into 4,062–4,070 and seek confirmation before targeting the next bullish expansion towards 4,220–4,228.
Do you think gold will revisit the main buy zone before beginning its next bullish move? Long 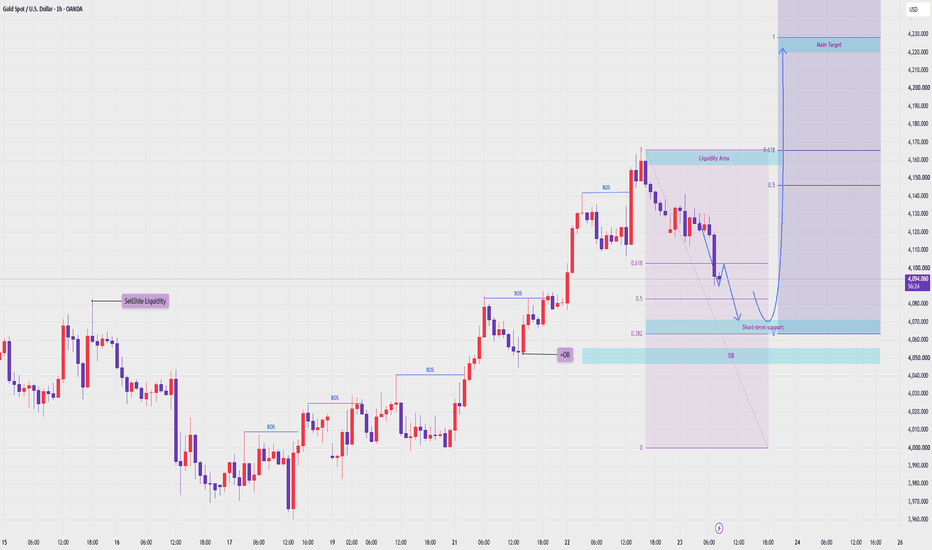
XAUUSD — 4,131 Trap or 4,071 Retest?Gold is showing early weakness after failing to extend above the recent high area.
Price is now trading around 4,115 - 4,120, below the OB sell zone near 4,131.
This is where the chart becomes interesting.
Because the short-term bullish move is still visible.
But buyers are starting to lose momentum near resistance.
The question today is simple:
Is gold only taking a small pause, or is the market preparing for a deeper retest?
The simple read
Gold recently created a strong upside move from the 4,000 area.
But after reaching the upper zone, price started forming lower reactions near resistance.
The 4,131 area is now the key OB sell zone.
As long as gold stays below 4,131, sellers may still try to push price lower.
The first weak line is around 4,110.
If this level breaks clearly, gold may continue toward the 4,071 OB buy / Fibo reaction zone.
A deeper support area is waiting near 4,027, which is also marked as a liquidity buy zone.
Key price zones
Current price area: 4,115 - 4,120
OB sell zone: 4,131
Weak line / short-term support: 4,110
OB buy / Fibo reaction zone: 4,071
Liquidity buy zone: 4,027
Bullish recovery improves above: 4,131
Trading plan
📉 Bearish retest scenario
If gold stays below 4,131 and loses 4,110:
The correction may continue toward 4,071.
This would be a normal retest after the previous strong bullish move.
I do not want to chase the sell too late.
The cleaner plan is to wait for confirmation below 4,110 or rejection from 4,131.
📈 Buy reaction scenario
If gold reaches 4,071 and shows a clean bullish reaction:
Buyers may try to rebuild the recovery structure.
Price could attempt to move back toward 4,110 and 4,131.
But without reaction from 4,071, there is no reason to force a buy.
📉 Deeper pullback scenario
If 4,071 fails clearly:
Gold may continue lower toward 4,027.
This is the deeper liquidity buy zone on the chart.
A strong reaction from 4,027 could become important later, but confirmation is still needed.
Tiara’s View
Gold is not fully bearish yet.
But the short-term momentum is no longer clean while price stays below 4,131.
For today, I am watching 4,110 first.
If 4,110 breaks, 4,071 becomes the main decision zone.
If gold reclaims 4,131, the bearish pressure weakens and buyers may try to recover again. Short 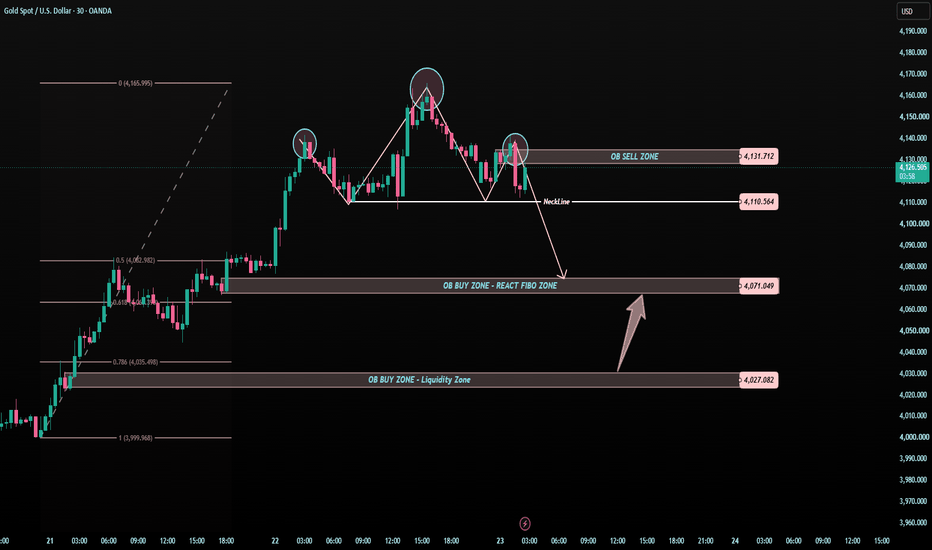
XAUUSD Forms Classic Head & Shoulders Pattern: Wait for retestXAUUSD had been moving in a strong uptrend, with buyers clearly in control. Each push higher carried solid momentum, but near the top, that strength began to fade.
The first pullback formed the left shoulder and gave the earliest sign of hesitation. Buyers then tried to regain control, driving price to a new high and forming the head, but the move failed to continue. That lack of follow-through was an important warning.
When price pulled back again and recovered into a lower high, the right shoulder was formed. This time, sellers responded with more conviction, showing that the balance was beginning to shift.
The break below the neckline is what confirms the pattern. If price now retests that level and gets rejected, it could offer a strong bearish continuation setup, with 4,075 as the next downside target. Short 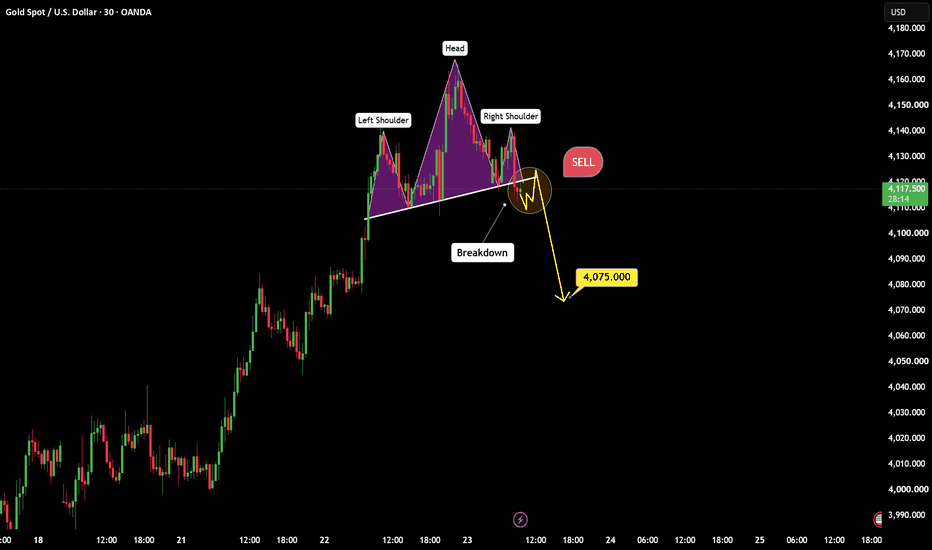
Mahindra and Mahindra Stock Analysis📊 Mahindra & Mahindra (M&M) | 1H Technical Analysis
Mahindra & Mahindra has delivered a strong breakout above the recent resistance zone around ₹3,216 after spending several sessions in consolidation. The breakout is supported by bullish price structure, indicating buyers have regained control in the short term.
The previous resistance between ₹3,203–₹3,216 has now turned into an important support area. As long as the price sustains above this zone, the bullish momentum remains intact and the probability of continuation towards higher levels increases.
Key Support:
• ₹3,216
• ₹3,203
• ₹3,079 (Major Swing Support)
breakdown below ₹3,203 could lead to profit booking and a retest of ₹3,079.
⚠️ This analysis is based purely on price action and chart structure. Always wait for confirmation and follow proper risk management before taking any trade.  Long
Long
Brian XAUUSD – Gold retreats from two-week highBRIAN XAUUSD – GOLD PULLS BACK FROM TWO-WEEK HIGH, BUT VALUE STILL HOLDS
Gold is extending its pullback from the two-week high around 4,166, even while the US dollar remains under pressure. That tells me this move is not only about USD weakness. It is also about profit-taking after a strong recovery from the lower value base.
From a macro view, risk around possible Japanese intervention is keeping dollar traders cautious. At the same time, stronger sentiment from US tech earnings and AI infrastructure spending is supporting risk appetite in Asia, which can reduce demand for the safe-haven dollar.
But the chart is still the main guide here. Gold has already moved fast from the lower POC reclaim area into the upper liquidity zone. Now price is cooling down, and the next real test is whether buyers defend value on the pullback.
Technical structure
On the H1 chart, gold rejected from the profit-taking zone near 4,130 - 4,140 after failing to extend cleanly above the two-week high area.
The current pullback is still normal as long as price holds above the key intraday value structure. The zone I am watching is the Buy scalping level around 4,097.988. This is where buyers may try to defend the next reaction.
If this area holds, gold can rotate back towards 4,130 and possibly retest the upper liquidity area. If it fails, price may dip deeper into the 4,075 region before rebuilding.
Important zones
Profit-Taking Zone: 4,130 - 4,140
Current resistance where sellers started to react.
Buy scalping: 4,097.988
Main short-term buy reaction level.
Upper trendline support: 4,075 - 4,080
Deeper support if the first buy zone fails.
POC Reclaim / Buyer Reload Zone: 4,005 - 4,015
Major lower value support if gold loses the recovery structure.
Trading scenario
Buy scalping from 4,097.988
Entry:
Look for buy positions only if price pulls back into 4,097.988 and shows clear bullish rejection.
Stop Loss:
Below the local pullback low or below the next support structure.
Take Profit:
TP1: 4,120
TP2: 4,130 - 4,140
TP3: Trail only if gold reclaims the profit-taking zone with strength
This setup is based on a controlled pullback into value after gold rejected from the upper liquidity area. It is not a blind buy. The reaction must be clear.
Final view
Gold is pulling back from a two-week high, but the bullish recovery structure has not fully broken yet.
The key is whether buyers defend 4,097.988. If they do, the market can attempt another rotation back towards 4,130 - 4,140.
If this level fails, I will not force the buy. Gold may need to test deeper value around 4,075 before the next reaction appears.
For now, the plan is simple: do not chase the high, wait for value, and trade the reaction.
Is this only profit-taking before another push higher, or the start of a deeper correction? Short 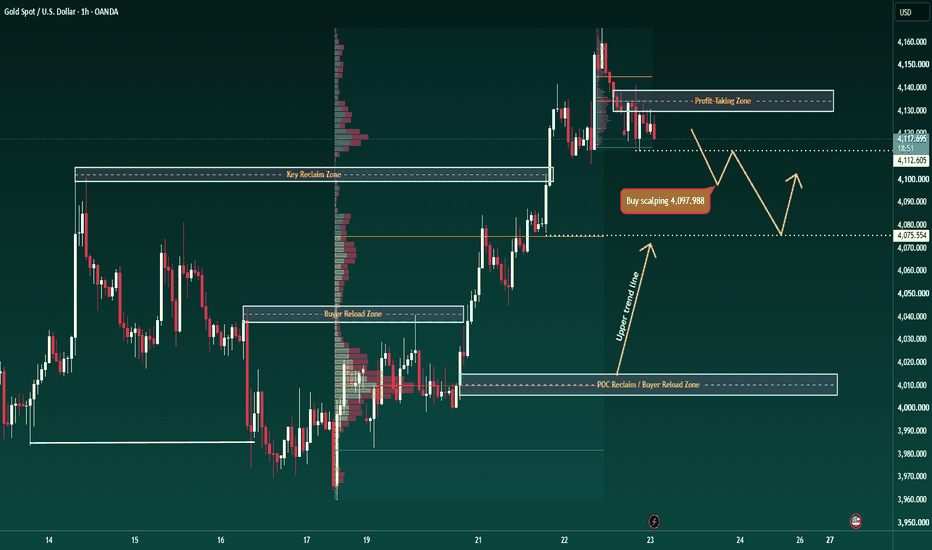
XAUUSD – Gold Is At A Crossroad After Four Days Of Recovery XAUUSD – Gold Is At A Crossroad After Four Days Of Recovery
Gold is slowing down after a strong four-day recovery.
Price is currently trading around 4,121 after reacting near the resistance area around 4,141 – 4,166. The market is no longer moving straight up, but buyers have not lost control yet.
This is an important point on the H1 chart. Gold is now testing whether the recent pullback is only a healthy retest of the Buy Order FVG zone, or the beginning of a deeper correction.
FUNDAMENTAL ANALYSIS
Gold cooled down as higher oil prices brought inflation concerns back into focus. Rising geopolitical tension in the Middle East may keep the market volatile, especially when energy prices move sharply.
The U.S. dollar is still not fully strong, but inflation risk can make traders cautious about the Fed outlook. With RSI around the neutral zone and the market waiting for clearer direction, gold may need more confirmation before extending the next move.
For now, the chart is at a decision point.
TECHNICAL ANALYSIS – SMC + FIBONACCI
From an SMC perspective, gold has already broken the previous descending trendline and created a strong bullish recovery from the lower area. This shows that buyers were active and the short-term structure improved.
However, after reaching the upper resistance near 4,166, price started to pull back. This does not automatically mean bearish reversal. It may simply be a retest of the Buy Order FVG zone.
The key area is 4,102 – 4,121. This is the Buy Order FVG zone on the chart. If gold holds this zone and forms a bullish reaction, buyers may attempt another push toward 4,141 and 4,166.
Above that, the bigger upside target is around 4,202 – 4,209, where the Fibonacci 2.618 target resistance aligns with previous resistance. This is the area where the next strong reaction may appear.
If gold breaks below 4,102, the recovery structure becomes weaker and price may revisit the strong support around 4,045.
KEY PRICE ZONES
Current price: 4,121
Buy Order FVG zone: 4,102 – 4,121
Short-term support: 4,102
Nearest resistance: 4,141
Recent high resistance: 4,166
Target resistance: 4,202 – 4,209
Strong support: 4,045
Bullish structure valid: Above 4,102
Invalidation for recovery view: Below 4,045
TRADING SCENARIOS
Buy Scenario
Buy Zone: 4,102 – 4,121
Entry: Bullish reaction, FVG retest, liquidity sweep, or lower-timeframe CHoCH
SL: Below 4,102 or below the nearest swing low
TP1: 4,141
TP2: 4,166
TP3: 4,202 – 4,209
Breakout Buy
Condition: Break and hold above 4,166
Target: 4,202 – 4,209
Sell Scenario
Sell is not the priority while gold holds above the Buy Order FVG zone.
Sell Zone: 4,166 or 4,202 – 4,209
Entry: Bearish rejection, failed breakout, or lower-timeframe bearish CHoCH
TP1: 4,121
TP2: 4,102
TP3: 4,045
Invalidation: If price breaks and holds above 4,209, the sell reaction idea becomes weaker.
MY VIEW
Gold is at a clean decision zone.
The recovery from last week was strong, but today’s pullback shows that buyers need to defend the 4,102 – 4,121 FVG zone. If this area holds, the bullish path toward 4,166 and 4,209 remains open.
If the FVG fails, gold may return to 4,045 before choosing the next larger direction.
For now, gold is not weak yet — but buyers must protect this zone.
Do you think gold will defend the 4,102 – 4,121 FVG and continue toward 4,209?
Long 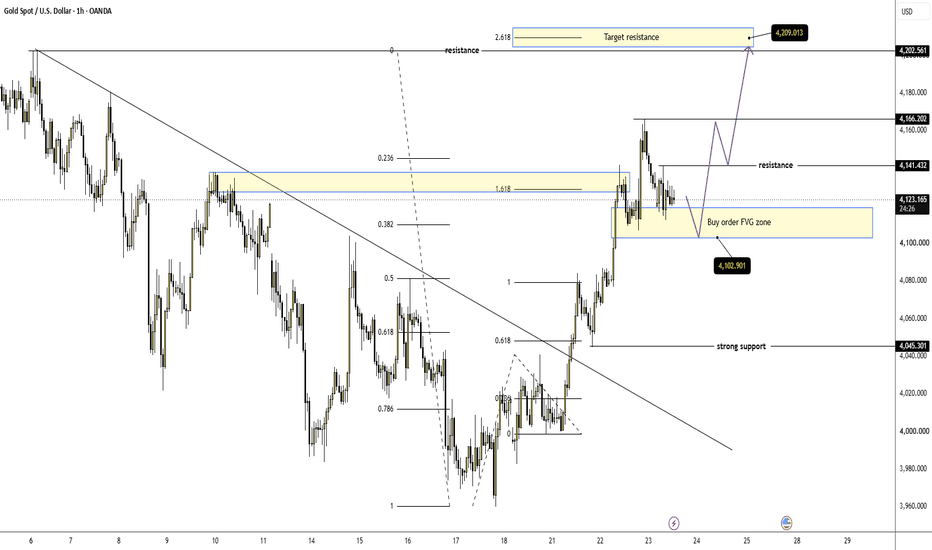
Reliance Nears Multi-Month BreakoutHighlights
* Reliance Industries has regained momentum after a prolonged consolidation phase, supported by strength across its retail, digital, and O2C businesses. The stock has been steadily attracting institutional interest and is now trading near a crucial technical resistance.
* The stock is currently trading near the **₹1,620–₹1,640** resistance zone. A decisive close above this range could confirm a fresh breakout and open the door for an advance towards **₹1,700–₹1,760** in the near term.
* On the downside, **₹1,550–₹1,570** serves as immediate support, while the **₹1,500** level remains a strong medium-term demand zone. Holding above these levels would keep the bullish outlook intact.
* Momentum indicators such as RSI and MACD have turned constructive, while the stock continues to trade above its key short- and medium-term moving averages, indicating improving trend strength.
* Reliance has formed a higher-low pattern on the daily chart after several months of range-bound movement, suggesting that buyers are gradually regaining control. Trading volumes have also picked up during recent up moves, indicating accumulation.
* Expectations surrounding the upcoming IPOs and value unlocking opportunities in the retail and telecom businesses, coupled with continued investments in new energy initiatives, continue to provide a favorable fundamental backdrop for the stock.
Takeaway
Reliance is displaying encouraging signs of a medium-term trend reversal after an extended consolidation phase. A sustained move above **₹1,640** could accelerate buying momentum and push the stock towards the **₹1,700–₹1,760** zone. As long as Reliance holds above the **₹1,550–₹1,570** support range, the technical bias remains positive, making short-term pullbacks potential buying opportunities rather than indications of a trend reversal.
Long