BAJAJ FINANCE: Bullish Reversal at Key Confluence Zone, LONG set
Overview
1. Trade Setup & Parameters
Current Market Price (CMP): ₹1,040.30 (+2.49%).
Entry Strategy: Buy in the range of ₹1,020.00 – ₹1,045.00 as the price confirms support off the trendline.
Stop Loss (SL): ₹995.00 on a daily candle closing basis (placed safely below the support zone and ascending trendline).
Target 1 (Intermediate): ₹1,100.40 (immediate horizontal swing resistance).
Target 2 (Main Objective): ₹1,150.00 – ₹1,170.60 (major overhead resistance area).
Risk-to-Reward Ratio: Exceeds 1:3 based on the entry-to-stop ratio.
2. Technical Analysis & Confluence Factors
Dual Confluence Zone: Price has retraced to test a key horizontal support level around ₹1,003.10 – ₹1,020.00, which served as a previous breakout pivot.
Ascending Trendline Support: A multi-month trendline extending from the April lows directly intersects with this horizontal support zone, creating strong technical demand.
Reversal Candle Signal: A strong bullish reaction was formed right at the confluence point (marked 'D' on the chart), signaling potential exhaustion of the selling pressure.
Setup Invalidation: A decisive daily candle close below ₹1,000.00 breaks both the trendline and the structural horizontal level, rendering the trade setup invalid.
3. Fundamental Profile
Market Capitalization: Large-Cap Non-Banking Financial Company (NBFC) sector leader in India.
Valuation Metrics: Price-to-Earnings (P/E) ratio is near 32.5x–33.6x, trading at historical fair value relative to its historic averages.
Financial Health: Robust annual AUM growth driven by consumer finance expansion and strong Return on Equity (ROE) near ~18.6%.
4. Economic Calendar & Catalyst News Events
As a major non-banking financial stock, Bajaj Finance is sensitive to rate changes, credit liquidity, and quarterly earnings announcements:
RBI Monetary Policy Committee (MPC) Meeting (October 5–7, 2026):
Impact: Highly Critical. Interest rate decisions, Repo rate stance, and RBI commentary on retail lending, unsecured credit, or liquidity affect NBFC cost of funds directly.
Bajaj Finance Q2 FY27 Earnings Report (Tentative: October 26, 2026):
Impact: High. Quarterly AUM growth, asset quality (Gross NPA / Net NPA), and Net Interest Margins (NIMs) will directly drive price action into target zones.
Festive Season Credit Growth Metrics (October – November 2026):
Impact: Medium-High. Consumer spending and retail loan disbursal updates during Navratri/Diwali sales serve as operational growth catalysts for consumer finance companies.
5. Risk Management Guidelines
Position Sizing: Risk no more than 1–2% of total trading capital on this setup.
Partial Profit Booking: Consider booking 50% profits near Target 1 (₹1,100.00) and trailing the stop loss to breakeven (₹1,040.00) to de-risk the position.
PNG
Event Caution: Be cautious of volatile price gaps around major catalyst dates (such as the RBI policy announcement).
Disclaimer: This analysis is for educational and informational purposes only and does not constitute financial or trading advice. Trading in equities involves risk of capital loss. Always perform independent research and consult a certified financial advisor prior to making investment decisions.  Long
Long
 Long
Long
XAUUSD — Weekly Wave 5 Lower Toward 4,060
From Kelly’s view, gold enters next week inside a broader bearish corrective structure. Price is currently trading around 4,378, after recovering from the 4,240–4,250 area, but the rebound is still developing beneath a descending channel and an important sell zone around 4,390–4,410.
The key idea is simple: the current recovery may represent a corrective Wave (4), while the main weekly scenario remains a continuation lower into Wave (5) if sellers defend the upper resistance zone.
⟡ Market structure
Gold remains inside a descending structure after the major peak near 4,680. Recent rebounds have continued to form below important resistance, while the descending channel is still controlling the broader direction.
The current recovery from around 4,240 has pushed price back toward the 4,390–4,410 sell zone, where Fibonacci resistance and the projected Wave (4) completion area overlap.
For next week, 4,334 is the first important support. A clean break below this level could confirm renewed bearish momentum and expose the 4,240–4,255 area.
If that support also fails, the larger Wave (5) projection points toward the 4,045–4,075 zone.
➤ Key levels
◌ Current price area: 4,375–4,385
◌ Main sell zone: 4,390–4,410
◌ Strong resistance: 4,410–4,430
◌ Strong support: 4,334
◌ Secondary support: 4,240–4,255
◌ First target: 4,334
◌ Second target: 4,240–4,255
◌ Main target: 4,045–4,075
◌ Invalidation: Above 4,430
⌁ Elliott Wave view
Wave (1): The first bearish leg pushed price lower from the previous recovery high.
Wave (2): Gold produced a corrective rebound before sellers regained control.
Wave (3): The stronger bearish impulse extended toward the 4,240 area.
Wave (4): The current rebound may be completing near 4,390–4,410, where the descending channel and Fibonacci resistance overlap.
Wave (5): If sellers reject this zone, the final bearish leg could develop toward 4,240 first, followed by the larger 4,045–4,075 target area.
▸ Trading scenario
Preferred bearish scenario
Entry: 4,390–4,410 after bearish confirmation
Stop Loss: Above 4,430
Take Profit 1: 4,334
Take Profit 2: 4,240–4,255
Take Profit 3: 4,045–4,075
The cleaner plan is to wait for rejection from the sell zone rather than chase price lower around current levels. A bearish reaction near 4,390–4,410, followed by a break below 4,334, would strengthen the Wave (5) scenario.
Alternative scenario:
If gold breaks above 4,410–4,430 and holds above the descending structure, the bearish Wave (5) setup may be delayed and price could extend toward the next higher resistance before sellers regain control.
◌ Invalidation
The main bearish scenario would weaken if price gains sustained acceptance above 4,410, and a confirmed break above 4,430 would invalidate the preferred Wave (5) structure for next week.
⌁ Kelly’s view
Kelly’s main view remains bearish for next week while gold stays below 4,390–4,430.
The current rebound may still have room to test the sell zone, but the broader structure favors another bearish leg if sellers defend resistance. 4,334 is the first confirmation level, while 4,240–4,255 remains the next major support before the larger 4,045–4,075 Wave (5) target comes into focus.
Do you think gold will reject the 4,390–4,410 sell zone first, or break 4,334 directly next week?  Short
Short
XAUUSD — 4,365 Retest or 4,310 Sweep?
Gold is trading around 4,346 after losing the rising M30 trendline.
Short-term momentum has weakened, with 4,338 now acting as the first support.
Treasury yields remain elevated after the Fed rate hike, while officials continue to warn that inflation is still too high. Oil prices are easing, which may reduce some inflation pressure, but higher yields remain a headwind for Gold.
The simple read
If 4,338 holds, Gold may recover toward 4,360–4,365.
If that resistance rejects, sellers could rotate price back toward 4,338 and potentially the deeper 4,310 support.
A clean reclaim above 4,365 would improve the structure and bring 4,397 back into focus.
Key price zones
4,338 — immediate support
4,360–4,365 — key resistance
4,310 — major support
4,397 — major swing high
The trendline break keeps short-term pressure bearish.
I prefer waiting for the 4,365 reaction rather than chasing price.
Can Gold reclaim 4,365, or will sellers push toward 4,310? Short 
XAUUSD Weekly Outlook — Breakout Needs a Retest
Gold is sitting around 4,378 after breaking the H4 descending trendline.
The structure is improving, but price is now testing the 4,385–4,405 immediate resistance area.
The simple read
A pullback toward 4,290–4,320 would be the cleaner test for buyers.
If this zone holds, Gold may recover toward 4,400 first, followed by the major 4,485–4,510 resistance.
A clean break above 4,510 could later expose the H4 resistance around 4,630.
If 4,290 fails, the major swing support near 4,235 becomes important again.
Key price zones
4,385–4,405 — immediate resistance
4,290–4,320 — key pullback support
4,235 — major swing low
4,485–4,510 — major resistance
4,630 — H4 resistance
The trendline break is encouraging, but I prefer a retest before continuation.
Do not chase the breakout.
Wait for the zone.
Can buyers defend 4,30x and open the path toward 4,500? Long 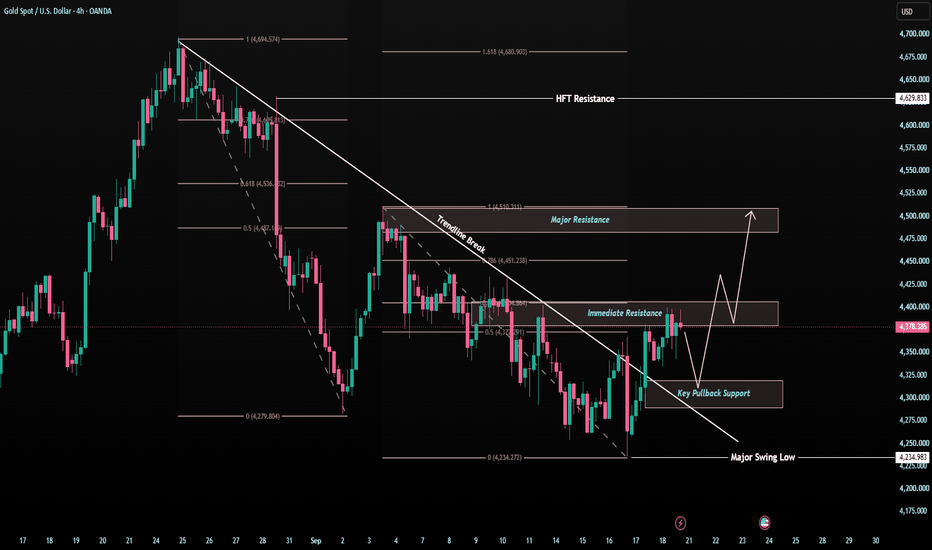
Long 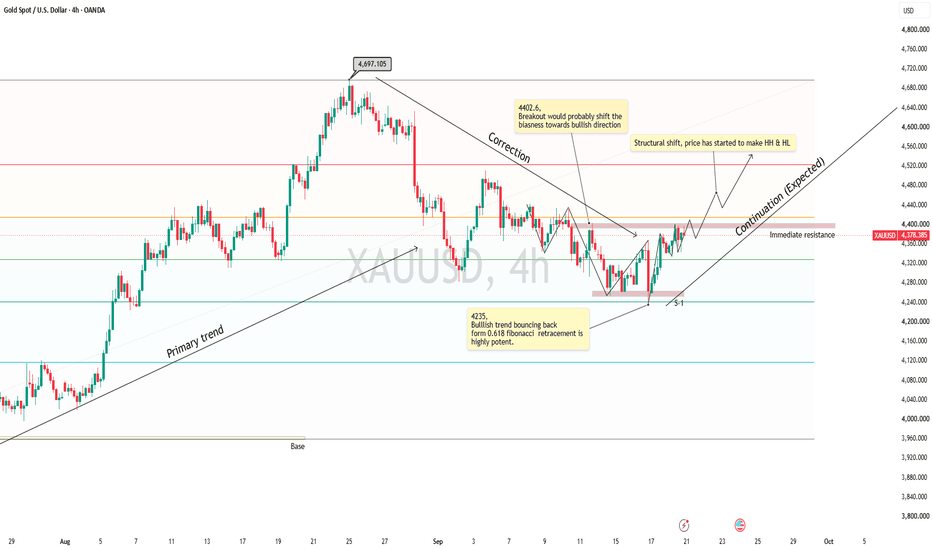
 Long
Long
JSW INFRASTRUCTURE LTD – WEEKLY CHART - Breakout doneLONG-TERM BULLISH SETUP
JSW Infrastructure has formed a Double Bottom pattern, followed by a breakout and successful retest of the neckline. Price is now holding above the breakout zone, setting up a potential long-term move higher.
🎯 TRADE LEVELS:
🟢 Entry: Above ₹350
🛑 Stop Loss: ₹318
🎯 Target 1: ₹370
🎯 Target 2: ₹400
🎯 Target 3: ₹425
🔥 Double Bottom breakout + retest completed — long-term setup is ready.
📌 For long-term view, consider holding with disciplined risk management and trail the stop-loss as the trend develops.
💬 Like • Comment • Follow for more setups!
DISCLAIMER :
This content is created by Logic Trade Room for educational and informational purposes only.
It is not financial advice, investment advice, trading advice, or a recommendation to buy or sell any security, index, futures contract, or options contract.
Trading and investing in the stock market involve substantial risk, including the risk of losing your entire invested capital. Past performance does not guarantee future results.
The entry, stop-loss, and target levels mentioned are illustrative chart-based levels and may change with market conditions. No trade setup or market prediction is guaranteed to be accurate.
Always conduct your own research, verify live market prices, and consult a qualified financial advisor before making investment decisions.
Trade with logic. Risk with discipline.
Logic Trade Room  Long
Long
 Long
Long
XAUUSD — Wave 5 Lower Toward 4,280
From Kelly’s view, gold is still trading inside a broader bearish structure. Price is currently around 4,352, while the recent rebound remains below the previous lower-high area near 4,380–4,395.
The key idea is simple: the current move may be completing a corrective Wave (4) around resistance, while the main structure still favors another bearish leg toward 4,320, 4,305, and potentially the 4,280 Wave (5) target zone.
⟡ Market structure
Gold continues to show a sequence of lower highs after failing around the 4,390 area.
The immediate resistance zone sits around 4,340–4,350, where the chart marks the projected Wave (4) sell zone. Price is currently testing this area, so the next reaction becomes important.
If sellers defend this zone and price breaks back below 4,320, bearish momentum could strengthen.
The 4,305 level is the next structural support. A confirmed breakdown below this level may expose the 4,278–4,288 area, where the projected Wave (5) completion and Fibonacci extension overlap.
➤ Key levels
◌ Current price area: 4,350–4,355
◌ Main sell zone: 4,340–4,350
◌ Strong resistance: 4,380–4,395
◌ First support: 4,318–4,325
◌ Strong support: 4,305
◌ First target: 4,320
◌ Second target: 4,305
◌ Main target: 4,278–4,288
◌ Invalidation: Above 4,395
⌁ Elliott Wave view
Wave (1): The first bearish impulse started from the recent local high and pushed price lower.
Wave (2): Gold produced a corrective rebound before sellers returned.
Wave (3): The next bearish leg extended toward the 4,320 area.
Wave (4): Price is now attempting another corrective recovery toward the 4,340–4,350 resistance zone.
Wave (5): If sellers reject this area, the final bearish leg could extend below 4,305 toward the 4,278–4,288 completion zone.
▸ Trading scenario
Preferred bearish scenario
Entry: 4,340–4,350 after bearish confirmation
Stop Loss: Above 4,395
Take Profit 1: 4,320
Take Profit 2: 4,305
Take Profit 3: 4,278–4,288
The cleaner plan is to wait for rejection around the projected Wave (4) resistance area. A break below 4,320, followed by loss of 4,305, would strengthen the continuation toward the Wave (5) target.
Alternative scenario:
If gold breaks above 4,350 and holds with strong bullish momentum, price could retest 4,380–4,395 before the broader bearish structure is reassessed.
◌ Invalidation
The bearish scenario would weaken if price gains sustained acceptance above 4,380, while a confirmed break above 4,395 would invalidate the preferred Wave (5) continuation setup.
⌁ Kelly’s view
Kelly’s main view remains bearish while gold stays below 4,380–4,395.
The current rebound looks more like a corrective Wave (4) than a confirmed trend reversal. If sellers defend 4,340–4,350, the next downside sequence may target 4,320, then 4,305, before the larger 4,278–4,288 Wave (5) zone comes into focus.
Do you think sellers will defend the Wave (4) zone, or will gold retest 4,390 first? Short 
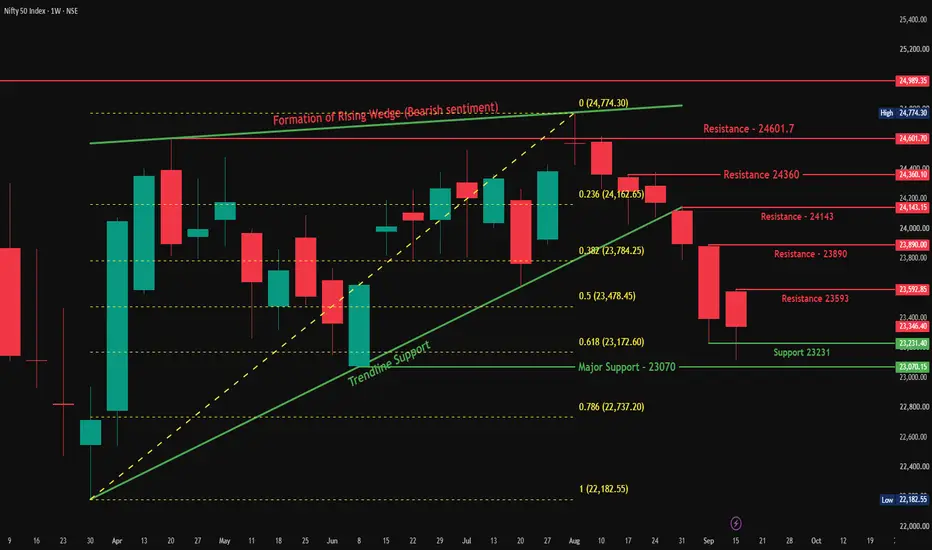
NIFTY — Bounce Off Major Support, Testing Resistance LadderOverview
Nifty closed the week at 23,346.40, down 51.70 points or 0.22%, a much smaller decline than recent weeks. Price tested Support 23,231 and held above Major Support (23,070), the confluence zone flagged last week, and has since stabilized within a tight range.
Follow-up on Last Week's View
Last week we flagged the Trendline + 0.618 Fib confluence (23,172) breaking down, with Major Support (23,070) as the next target. That level came close to being tested, with the low landing at 23,116.10, just above Major Support, before buyers stepped in. This week's price action shows the selling pressure easing, with a much smaller weekly decline compared to the prior sharp drops.
Pattern Explanation
Price is now building a small base just above Support 23,231, with a resistance ladder forming overhead: 23,593, then 23,890, then 24,143, and finally the bigger Resistance zone (24,360–24,601.70). Each of these levels will need to be cleared in sequence for the broader downtrend to be meaningfully challenged. The longer-term Rising Wedge breakdown context still applies, so this stabilization needs to be treated as a potential pause rather than a confirmed reversal until more resistance levels are reclaimed.
Key Levels
Resistance Zone: 24,360–24,601.70
Resistance 3: 24,143
Resistance 2: 23,890
Resistance 1: 23,593
Support: 23,231
Major Support: 23,070
Scenarios
Bullish: If Nifty reclaims 23,593 with strength, it would suggest this stabilization is turning into a genuine recovery attempt, opening the path toward 23,890 and 24,143.
Bearish: If Nifty breaks below Support 23,231 and Major Support (23,070), it would confirm the broader downtrend is resuming, with the 0.786 Fib (22,737) as the next level to watch.
Beginner's Lesson
After a sharp decline, a week (or two) of smaller, tighter candles often signals sellers are running out of momentum, at least temporarily. This doesn't automatically mean a trend reversal, it could just be a pause before the next move. The way to tell the difference is watching how price behaves at the first real resistance test, a strong reclaim suggests genuine buying interest, while a weak bounce and quick rejection suggests the pause is just that, a pause.
Conclusion
Nifty is showing early signs of stabilization after a sharp multi-week decline, holding above Major Support and testing a ladder of resistance levels above. A reclaim of 23,593 would be the first sign of a genuine recovery attempt. A break below 23,231 and 23,070 would confirm the downtrend is still in control. This remains a level-to-level market, with the next couple of weeks likely to clarify which scenario is playing out.
This is for educational purposes only and not investment advice. Please do your own research or consult a financial advisor before making any trading decisions. NIFTY — Wedge Breakdown Confirmed, Major swing Support in FocusOverview
Nifty closed the week at 23,398.10, down 499.60 points or 2.09%, extending the sharp breakdown from recent weeks. Price has now broken decisively below the entire wedge structure and multiple support zones, with the multi-month rising trendline support the next major level in sight.
Follow-up on Last Week's View
Last week we flagged Nifty needing strength above 24,050 for a bullish case, with a break below the trendline and Immediate Support opening the door lower. That bearish path has played out in full, price broke through 23,818, then 23,600, and this week's low of 23,231.40 has pushed well past the 0.5 Fib level (23,478.45) too, confirming the Rising Wedge has resolved firmly to the downside.
Pattern Explanation
The Rising Wedge breakdown is now well underway, with price cutting through three support-turned-resistance zones in quick succession (23,818, 23,600, and 0.5 Fib at 23,478). The next meaningful level is the rising Trendline Support, which is converging with the 0.618 Fib (23,172.60) in the coming weeks, a genuine confluence zone worth watching closely.
Key Levels
Resistance 3: 23,818
Resistance 2: 23,600
Resistance 1 / 0.5 Fib: 23,478
Support (Trendline + 0.618 Fib confluence): 23,172
Major Support: 23,070.15
Deeper Fib: 0.786 (22,737.20)
Scenarios
Bullish: If Nifty reclaims 23,600 with strength, it would suggest this leg of selling is exhausting, and price could work back toward 23,818 and the 0.382 Fib (23,784).
Bearish: If Nifty closes below the trendline and 0.618 Fib confluence (23,172), it would confirm the breakdown is extending, with Major Support (23,070) as the immediate test, and 0.786 Fib (22,737) as a deeper target if weakness continues.
Beginner's Lesson
A trendline that's held for many months, like this one since March, carries real weight when it's finally tested after a sharp breakdown. The fact that it's now converging with a Fibonacci level (0.618) makes this an even stronger confluence zone. These multi-month structural tests often produce either a strong bounce (since so many traders watch the same level) or a decisive breakdown that accelerates the move, either way, it's a zone worth paying close attention to rather than ignoring.
Conclusion
Nifty has confirmed a clean wedge breakdown, cutting through multiple support zones in just a couple of weeks. The focus now shifts to the Trendline + 0.618 Fib confluence near 23,172, an important test for the broader uptrend structure. Holding this zone would keep the bigger picture intact; losing it would open the door toward deeper Fib levels and Major Support.
This is for educational purposes only and not investment advice. Please do your own research or consult a financial advisor before making any trading decisions.