Trend Lines
BTC Ignites MomentumBitcoin isn’t just moving — it’s breaking patterns. After wrestling with a stubborn downtrend, the 1H chart shows a clean breakout above resistance, locking bulls back in the driver’s seat at $64,339. The battlefield is clear: $62,500 stands as the fortress of support, while $65,501 shines as the next conquest. With a disciplined stop at $63,939, this isn’t gambling — it’s a calculated risk-reward play. Momentum traders know: when BTC sparks, the fire spr
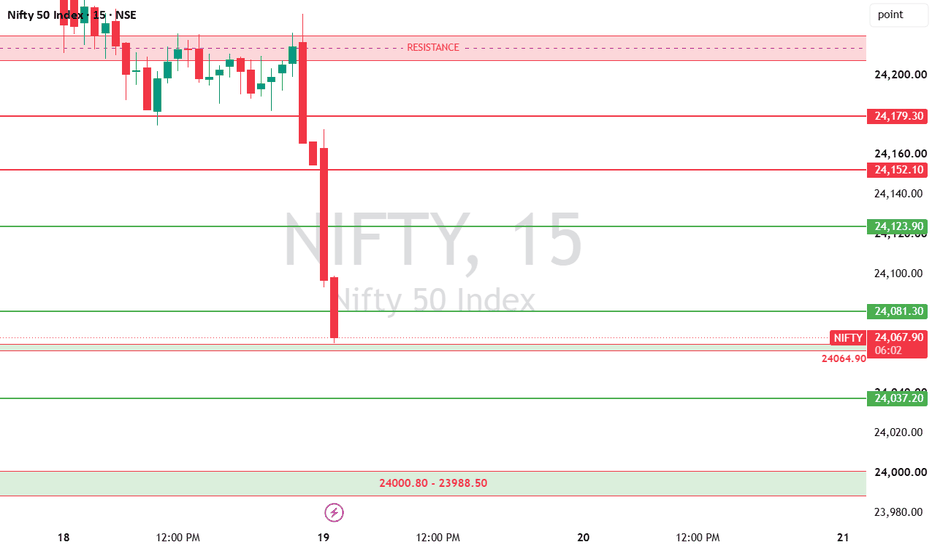
NIFTY 50 Intraday Outlook & Key Levels | August 19,2026Market Context & Price Action
NIFTY is currently displaying strong bearish momentum following a sharp rejection from the upper resistance zone near the 24,200 level. On the 15-minute timeframe, a significant sell-off candle broke down through intermediate support levels, taking price action below 24,123 and 24,081. The index is currently testing lower liquidity around the 24,071 mark as bears maintain control of the immediate market structure.
Key Trading Levels & Strategy
Immediate Resistan
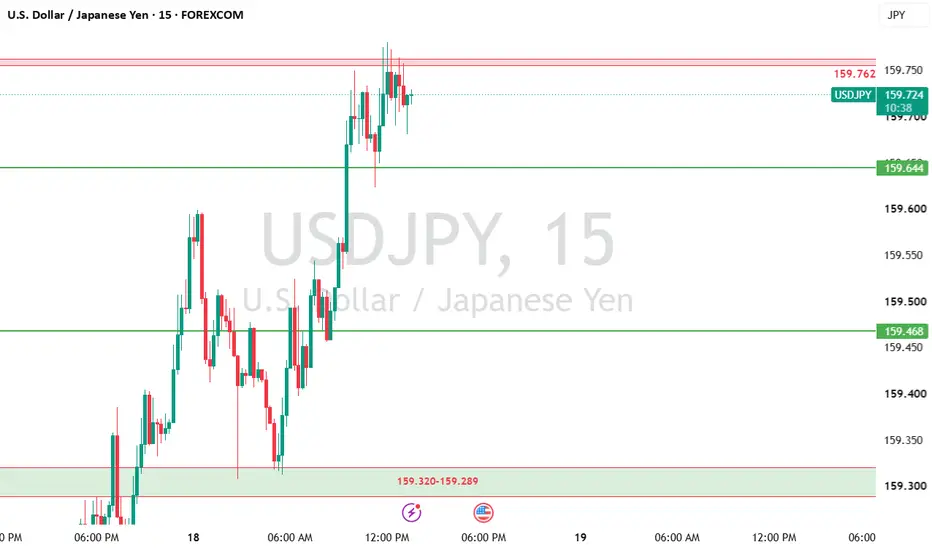
USD/JPY Intraday (18/08/2026) – Long Retest Setup Above 159.The USD/JPY 15-minute chart exhibits a strong bullish structure, highlighted by powerful impulsive expansion legs pushing higher out of lower base support around 159.320 – 159.289. Price recently experienced a sharp breakout higher, driving through intermediate resistance at 159.644 to test a local high near 159.762. Following this high, price is currently undergoing a slight healthy consolidation near 159.713, staying comfortably elevated above former breakout levels and indicating that buyers
EURUSD INTRADAY ANALYSIS 18/08/2026The EUR/USD 15-minute chart shows a recovery attempt following an initial downtrend, with price holding firmly above the key support zone around 1.15614 – 1.15700. After printing a local low near 1.1568, price action pushed back upward and is currently hovering around 1.15751. The clear breach above the minor intraday consolidation signals renewed buying interest, keeping price positioned for a potential continuation toward the intermediate resistance levels marked at 1.15872 and the higher supp
Nifty Intraday Analysis for 19th August 2026NSE:NIFTY
Index has broken 24250 and downward risk open. However, bounce from the support range is expected.
The upward movement may lead to 24350 – 24400 resistance range and if the index crosses and sustains above this level then may reach near 24600 – 24650 range.
On the contrary, The downward moment may drag the Index to 23950 – 23900 support range in downward momentum and if this support is broken then index may tank near 23700 – 23650 range.
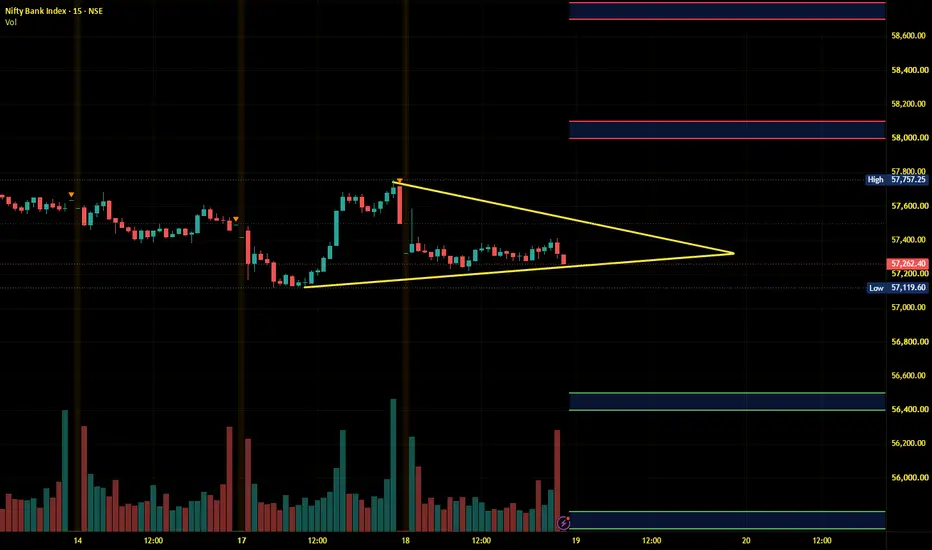
Banknifty Intraday Analysis for 19th August 2026NSE:BANKNIFTY
Index has strong resistance near 58000 and support near 57000 level and round bound moment expected as long as Index is in this range.
The upward moment may lead the Index to 58000 – 58100 resistance range in upward momentum and if the index crosses and sustains above this level then may reach near 58700 – 58800 range.
On the contrary, The downward moment may drag the Index to 56500 – 56400 support range in downward momentum and if this support is broken then the index may
Finnifty Intraday Analysis for 19th August 2026NSE:CNXFINANCE
The index is near 26000 support and range bound moment in 26000 - 26500 range expected and uptrend will be formed only when index breaks and sustains above 26500 resistance.
The upward movement may lead the Index to 26350 - 26400 resistance range and if the index crosses and sustains above this level then may reach near 26650 - 26700 range.
On the contrary, The downward moment may drag the to 25850 – 25800 support range and if this support too is broken then index may tank
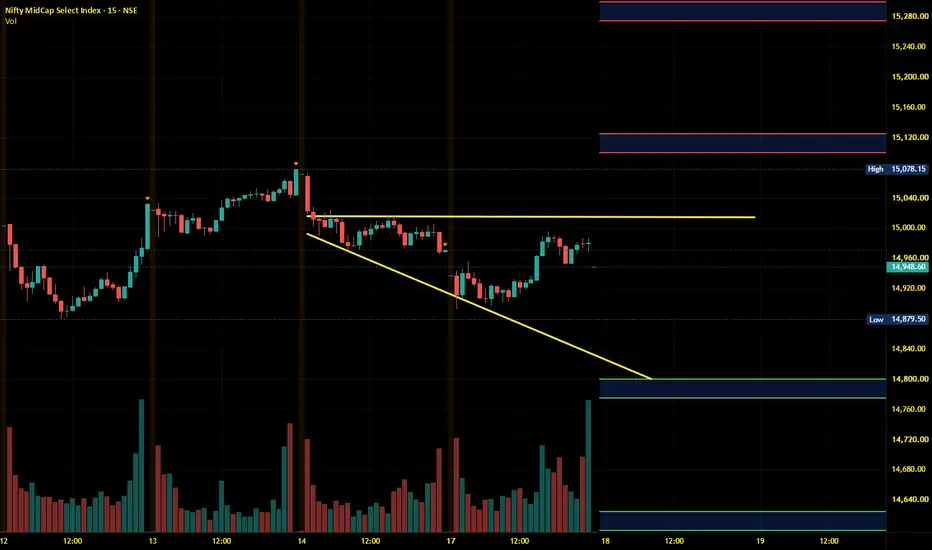
Midnifty Intraday Analysis for 19th August 2026NSE:NIFTY_MID_SELECT
The index has broken 14900 support which has opened downward risk as long as the Index is below the support.
The upward movement may lead the Index near 15000 – 15025 resistance range and if the index crosses and sustains above this level then may reach 15175 – 15200 range.
On the contrary, The downward moment may drag the index to 14700 – 14675 support range and if this support is broken then index may tank near 14525 – 14500 range.
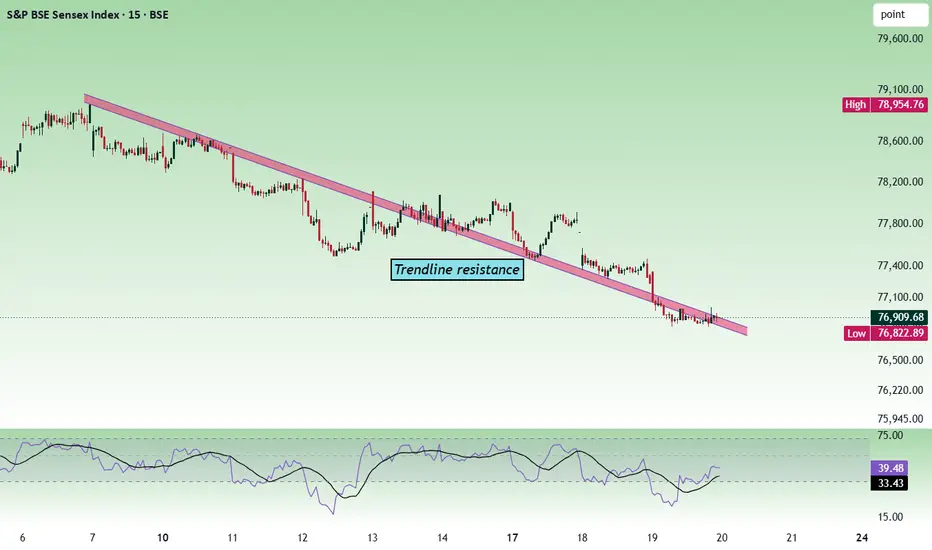
Sensex - Expiry day analysis August 20The price is moving along with the trendline for a few days. The trendline is acting as a magnet for the price. Today the price has broken 77k and closed below it. The main trend is bearish so far.
Buy above 77240 with a stop-loss of 77060 for the targets 77380, 77480, 77620 and 77780.
Sell below 76900 with a stop-loss of 77060 for the targets 76760, 76640, 76520, 76360 and 76220.
Always do your analysis before taking any trade.
XAUUSD — Is This Bounce Real or Just a Retest?Gold is trying to breathe after the sharp bearish move, but the structure is still not fully bullish again.
Price is holding around 4,330 - 4,340, right under the downtrend pressure.
This is the area where many traders can get trapped.
A small bounce can look bullish.
But if price cannot break the right resistance, that bounce can become only a retest before the next drop.
The simple read
4,332 is the first support to watch.
If gold stays above this area, price may try to recover toward 4
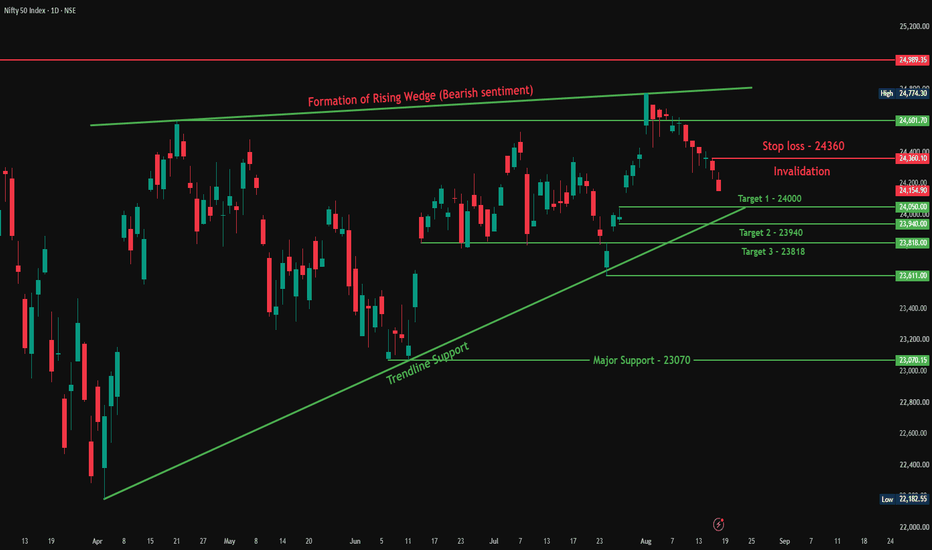
NIFTY — FII Positioning Turns Bearish, Short Setup on OI DataOverview
Nifty closed at 24,154.90, down 0.55%, continuing its pullback from the 24,601–24,989 resistance zone. Along with the price action, today's Open Interest (OI) data shows big traders leaning bearish, which is what this setup is based on.
OI Analysis (In Simple Words)
Over the last 5 days, FII (big foreign investors) have added more than 39,000+ short positions in Nifty futures, but only 1,233 long positions. That's a huge imbalance, and it means FII are becoming more and more bearish
XAUUSD Intraday Short Setup: Rejection Off Supply Zone, 19-08-26Looking at XAUUSD (15m), price action shows a clear intraday bearish bias following a sharp impulse drop from the upper supply region. We are currently observing a corrective pullback into key shorting levels.
🔑 Key Technical Zones
Supply Zone / Resistance (Sell Area): 4,367 - 4,372
Secondary Resistance: 4,382 and 4,405 - 4,407
Current Consolidation / Minor Pivot: Around 4,345
Demand Zone / Support (Target Area): 4,326
Extended Demand Target: 4,316 - 4,319
Major Key Support: 4
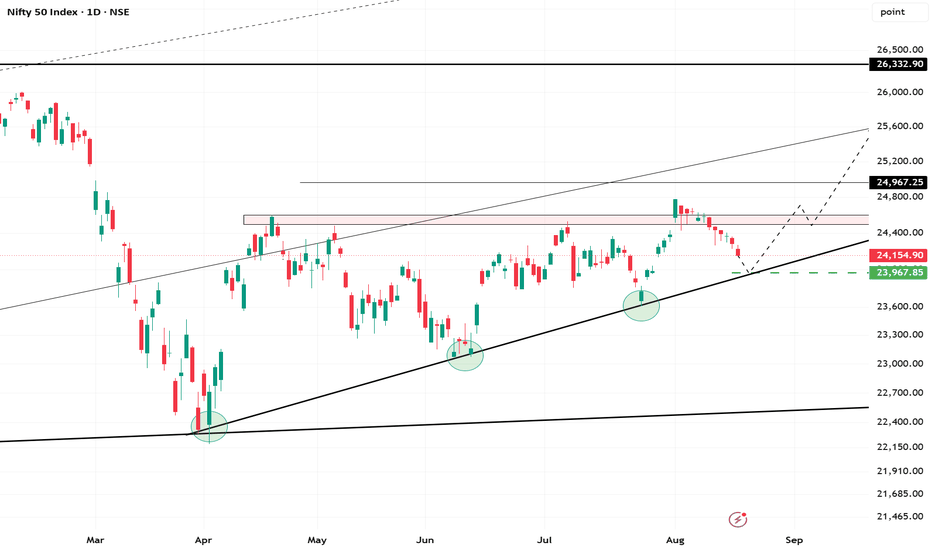
NIFTY Heading towards 24000As we can see NIFTU broke below our important demand zone and also has been sustaining below our trendline support, confirming bearishness. Hence as long as below the trendline, every rise could be shorted and also the trendline would act as a resistance now. So, plan your trades accordingly and keep watching everyone.
USDCAD SHOWING A GOOD UP MOVE WITH 1:8 RISK REWARDUSDCAD SHOWING A GOOD UP MOVE WITH 1:8 RISK REWARD
DUE TO THESE REASON
A. its following a rectangle pattern that stocked the market
which preventing the market to move any one direction now it trying to break the strong resistant lable
B. after the break of this rectangle it will boost the market potential for break
C. also its resisting from a strong neckline the neckline also got weeker ald the price is ready to break in the outer region
all of these reason are indicating the same thing its
Will 23900 act as good support for the higher levels ?Hope everyone is doing well.
There are lot of things happening around the market. Most importantly CAS which is an extra burden for many traders since it spoiled the day move and everyone is waiting for to capture the post 3 pm moves.
Strategies are getting failed and need more data to adapt and align with present market conditions. Also from the Aug starting almost daily candles are printing reds.
Everything apart, there is a strong support coming in at ~23900 levels which can attain may be
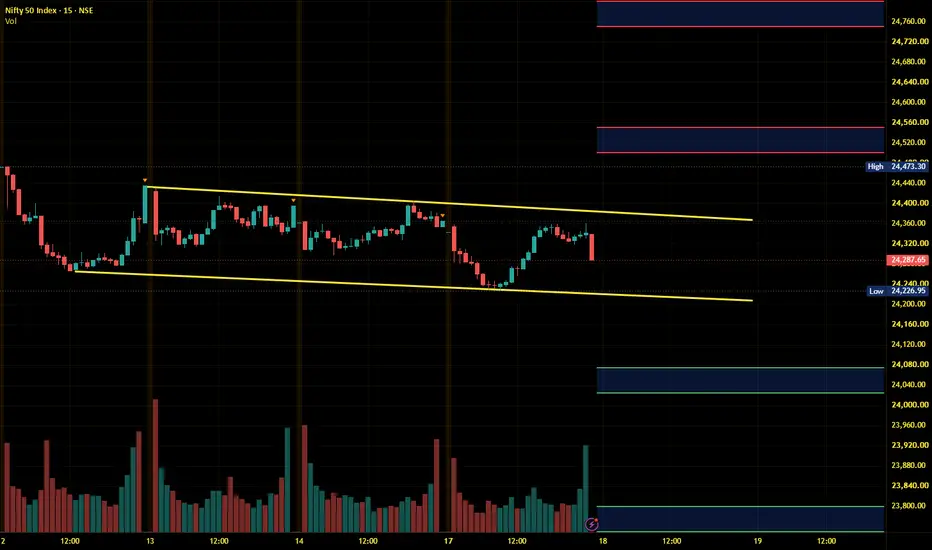
Nifty Intraday Analysis for 18th August 2026NSE:NIFTY
Index will be range bound as long as it is in the 24250 - 24500 range and trend will emerge on either side when index will break the range.
The upward movement may lead to 24500 – 24550 resistance range and if the index crosses and sustains above this level then may reach near 24750 – 24800 range.
On the contrary, The downward moment may drag the Index to 24075 – 24025 support range in downward momentum and if this support is broken then index may tank near 23800 – 23750 range
Banknifty Intraday Analysis for 18th August 2026NSE:BANKNIFTY
Index has strong resistance near 58000 - 58300 range and uptrend is expected only when the index breaks and sustains above this resistance range.
The upward moment may lead the Index to 58200 – 58300 resistance range in upward momentum and if the index crosses and sustains above this level then may reach near 58900 – 59000 range.
On the contrary, The downward moment may drag the Index to 56800 – 56700 support range in downward momentum and if this support is broken then the in
Finnifty Intraday Analysis for 18th August 2026NSE:CNXFINANCE
The index is near 26000 support and range bound moment in 26000 - 26500 range expected and uptrend will be formed only when index breaks and sustains above 26500 resistance.
The upward movement may lead the Index to 26475 - 26525 resistance range and if the index crosses and sustains above this level then may reach near 26800 - 26850 range.
On the contrary, The downward moment may drag the to 25950 – 25900 support range and if this support too is broken then index may tank
Midnifty Intraday Analysis for 18th August 2026NSE:NIFTY_MID_SELECT
Index has support near 14900 - 14875 range and uptrend is expected to continue as long as the index is above this support range.
The upward movement may lead the Index near 15100 – 15125 resistance range and if the index crosses and sustains above this level then may reach 15275 – 15300 range.
On the contrary, The downward moment may drag the index to 14800 – 14775 support range and if this support is broken then index may tank near 14625 – 14600 range.
UPL - Multitime frame analysisIn a smaller time frame, the price has formed a rounding top pattern. As per the daily chart, the price is testing an important zone at 560. The price will be bearish below that.
Sell below 558 with a stop-loss at 564 for targets at 554, 548, 542 and 536.
This will become invalid if the price closes above 570 with bullish strength.
Always do your analysis before taking any trade.
EUR/JPY 15M Intraday (18/08/2026) – Retest & Continuation to 185Date: August 18, 2026
The EUR/JPY 15-minute chart displays a decisive bullish market structure, characterized by higher highs and higher lows following a breakout from prior consolidation. Price action reflects strong buying momentum after clearing the key intermediate level at 184.656, rallying upward to test a session high of 184.904 . Buyers remain firmly in control, driving price toward the primary overhead resistance targets marked at 185.056 and the higher supply zone spanning 185.1
CHF/JPY Swing Breakout SetupCHF/JPY is showing a classic swing opportunity with higher lows forming after a sharp drop. Price is approaching the 199.172–200.000 supply zone, with resistance marked at 200.977. A bullish breakout above this level could trigger momentum toward TP1 at 197.309 and beyond. Demand remains strong near 193.000–194.000, providing a solid base for risk management. This setup highlights a clean swing structure with defined entry, stop-loss, and profit targets — ideal for traders looking to capture med
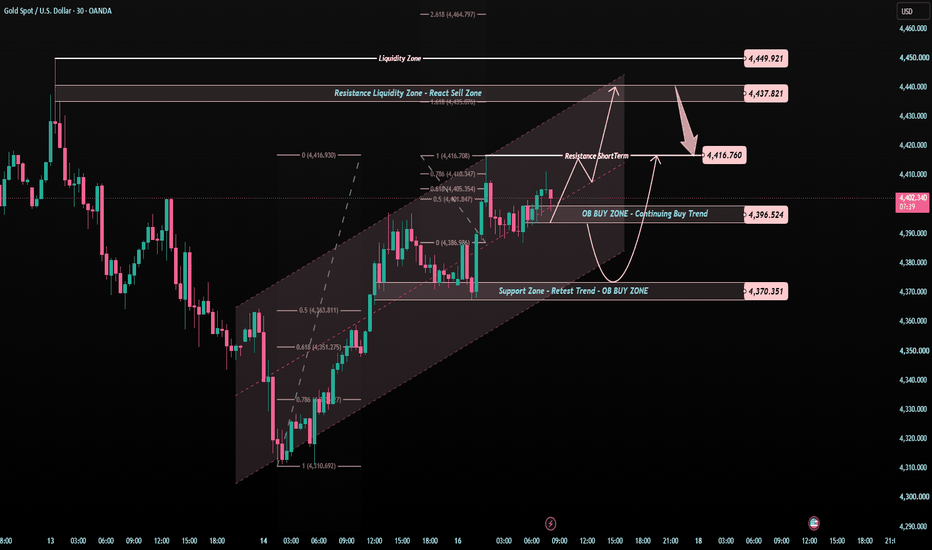
4,416 Is the Line to WatchGold is still moving inside a short-term bullish channel, but the market is now testing a very important area.
Price is holding around 4,400 - 4,410 after recovering from the lower trend support.
Buyers are still present.
But the next clean move depends on one question:
Can gold break 4,416 with confirmation?
The simple read
4,416 is the first short-term resistance today.
If gold breaks and holds above 4,416, buyers may try to continue toward 4,437.
The 4,437 area is the Resistance Liqui