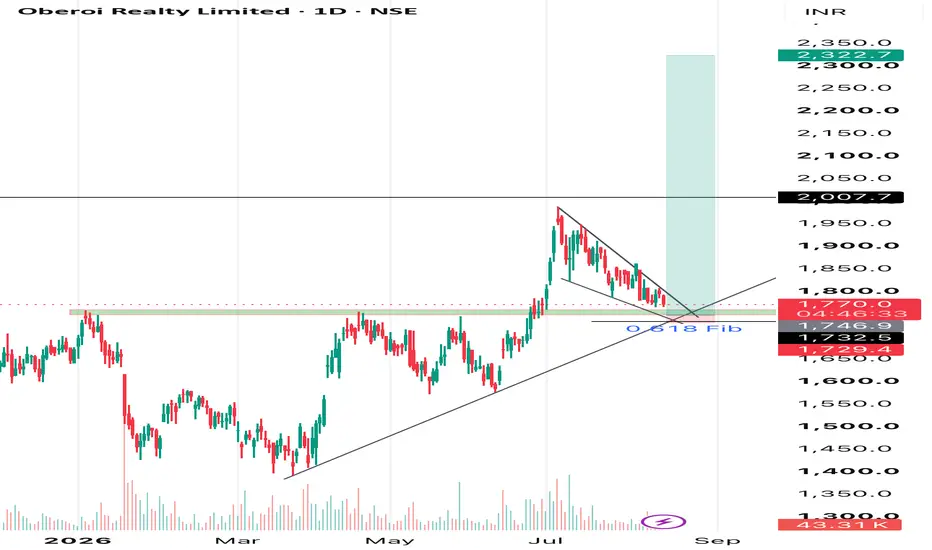
Bullish Setup – SBI Cards & Payment Services LtdZone is currently aligning with the Daily SMA 21, Weekly SMA 21, and Weekly EMA 9.
Technical Highlights:
Price respecting the ascending channel structure.
EMA 9 crossing above SMA 21, signaling short-term bullish momentum.
Confluence zone offers a strong buy-on-dip opportunity.
Trade Idea:
Bias: Bullish continuation as long as price holds above ₹647.
A breakout above ₹667 could trigger momentum toward ₹680 and beyond.
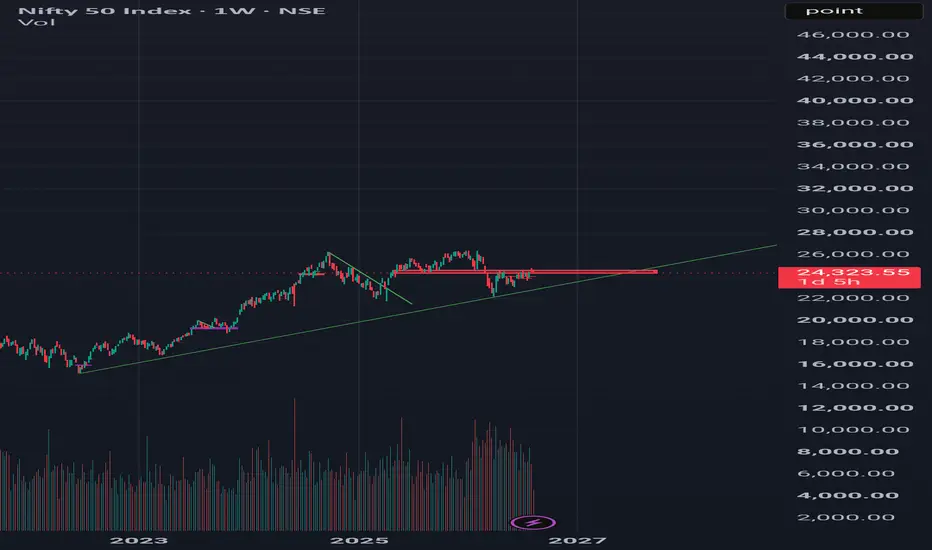
Trend Lines
We are still above the trendline! As we can see despite the weakness, NIFTY managed to close above the trendline. Showing strength. Hence we should stand by our analysis of buying the dip as long as trendline is respected. Hence as long as we are above the trendline, every dip can be bought. So plan your trades accordingly and keep watching everyone.
Nifty Intraday Analysis for 13th August 2026NSE:NIFTY
Index has downside risk as long as it is below 24500 - 24600 range.
The upward movement may lead to 24700 – 24750 resistance range and if the index crosses and sustains above this level then may reach near 24950 – 25000 range.
On the contrary, The downward moment may drag the Index to 24225 – 24175 support range in downward momentum and if this support is broken then index may tank near 23950 – 23900 range.
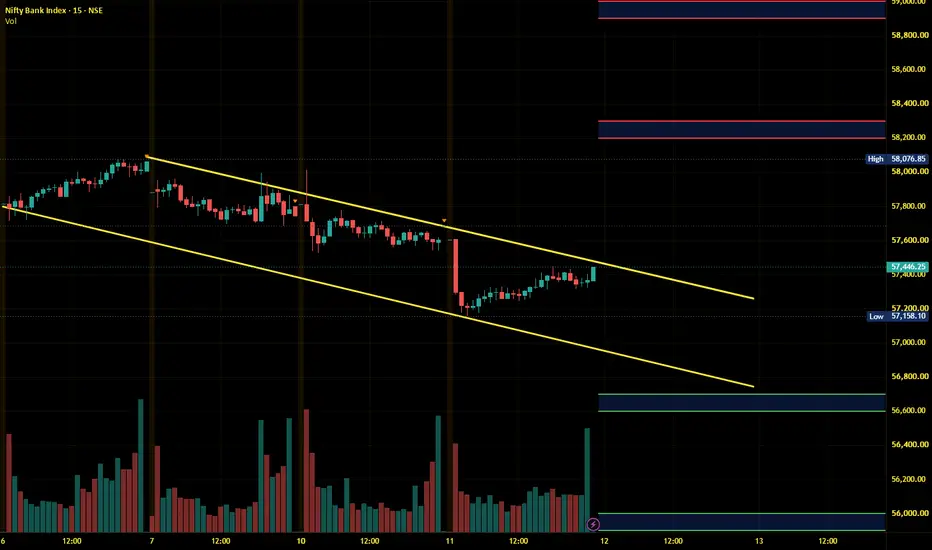
Banknifty Intraday Analysis for 13th August 2026NSE:BANKNIFTY
The highest Call and Put OI is built up at 58000 strike which will act as resistance as long as it is not broken.
The upward moment may lead the Index to 58600 – 58700 resistance range in upward momentum and if the index crosses and sustains above this level then may reach near 59300 – 59400 range.
On the contrary, The downward moment may drag the Index to 57200 – 57100 support range in downward momentum and if this support is broken then the index may tank near the 56500 – 56
Finnifty Intraday Analysis for 13th August 2026NSE:CNXFINANCE
The index is near 26400 support and uptrend is expected.
The upward movement may lead the Index to 26700 - 26750 resistance range and if the index crosses and sustains above this level then may reach near 27000 - 27050 range.
On the contrary, The downward moment may drag the to 26150 – 26100 support range and if this support too is broken then index may tank near 25850 – 25800 range.
Midnifty Intraday Analysis for 13th August 2026NSE:NIFTY_MID_SELECT
Index is at All Time High and 15000 resistance is broken and upended is expected to continue as long as index is above 14800 level.
The upward movement may lead the Index near 15175 – 15200 resistance range and if the index crosses and sustains above this level then may reach 15350 – 15375 range.
On the contrary, The downward moment may drag the index to 14875 – 14850 support range and if this support is broken then index may tank near 14700 – 14675 range.
Strong REJECTION from the trendline as expected! As we can see NIFTY showed a strong recover which was very well anticipated as there were two important supports which has been protecting NIFTY which is both a demand zone and a trendline support. Hence as long as we are above the trendline and above the demand zone! Every dip can be bought! So plan your trades accordingly and keep watching everyone.
Nifty Intraday Analysis for 12th August 2026NSE:NIFTY
Index has downside risk as long as it is below 24500 - 24600 range.
The upward movement may lead to 24700 – 24750 resistance range and if the index crosses and sustains above this level then may reach near 24950 – 25000 range.
On the contrary, The downward moment may drag the Index to 24250 – 24200 support range in downward momentum and if this support is broken then index may tank near 24000 – 23950 range.
Banknifty Intraday Analysis for 12th August 2026NSE:BANKNIFTY
The highest Call and Put OI is built up at 58000 strike which will act as resistance as long as it is not broken and Index has downside risk as long as it is below 57500.
The upward moment may lead the Index to 58200 – 58300 resistance range in upward momentum and if the index crosses and sustains above this level then may reach near 58900 – 59000 range.
On the contrary, The downward moment may drag the Index to 56700 – 56600 support range in downward momentum and if this supp
Finnifty Intraday Analysis for 12th August 2026NSE:CNXFINANCE
Index has downside risk as long as it is below the 26500 - 26700 range.
The upward movement may lead the Index to 26700 - 26750 resistance range and if the index crosses and sustains above this level then may reach near 27000 - 27050 range.
On the contrary, The downward moment may drag the to 26150 – 26100 support range and if this support too is broken then index may tank near 25850 – 25800 range.
Midnifty Intraday Analysis for 12th August 2026NSE:NIFTY_MID_SELECT
Index is near breakout and uptrend is expected to continue as long as the index is above 14800 level.
The upward movement may lead the Index near 15150 – 15175 resistance range and if the index crosses and sustains above this level then may reach 15325 – 15350 range.
On the contrary, The downward moment may drag the index to 14825 – 14800 support range and if this support is broken then index may tank near 14650 – 14625 range.
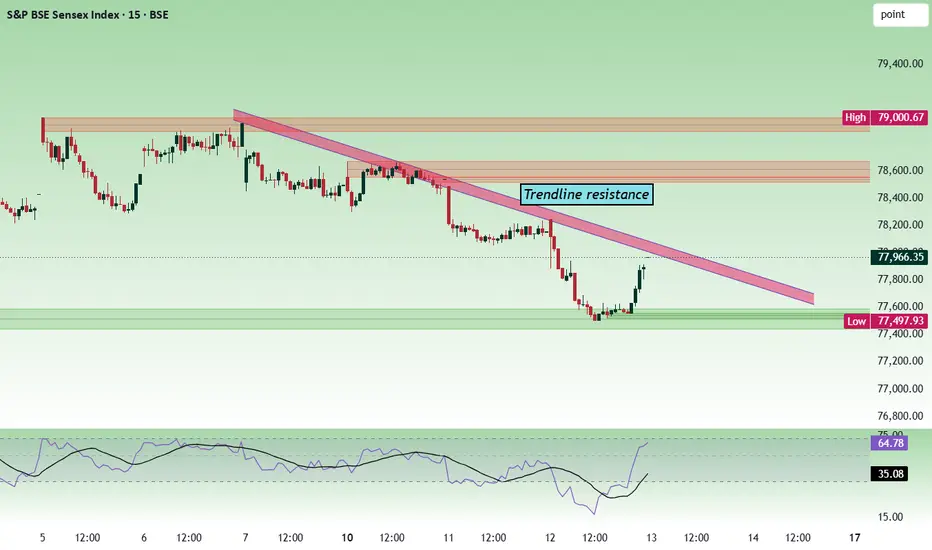
Sensex - Expiry day analysis Aug 13The price took support from the 77500 zone and is moving up, testing the resistance at 78000. Sustaining above the trendline and 78000 can cause the price to move up.
Buy above 78040 with a stop loss of 77880 for the targets 78180, 78360, 78540 and 78720.
Sell below 77740 with a stop-loss of 77920 for the targets 77600, 77480, 77340, 77200 and 77060.
Expected expiry day range is 77100 to 78200.
Always do your analysis before taking any trade.
NIFTY — Tight Range at Resistance, Two-Way Setup for TomorrowOverview
Nifty closed at 24,636, down marginally, after getting rejected three sessions in a row from the 24,774 zone. The index has been consolidating in a tight range over the last 4 sessions, between 24,601 support and 24,774 resistance. Tomorrow's move around this range will likely decide the next few sessions' direction.
Pattern Explanation
Nifty is also inside a larger Rising Wedge structure, a pattern that often leans bearish once broken. But that wedge support line is currently far be
INFY — Wedge Breakout Confirmed, Targeting 1,278 and 1,377Overview
Infosys is trading at 1,190.7, up 0.65%, continuing its recovery after confirming a falling wedge breakout. This follows a multi-month decline from the January high of 1,728 and a successful hold of the ₹1,000 psychological support and wedge apex earlier this year.
Previous Idea Recap
This setup follows our earlier idea, "INFY: Falling Wedge Apex at ₹1,000 Psychological Support Test," where we flagged the wedge apex + ₹1,000 confluence as key support. That level held (low of 982.40),
Nifty Intraday Analysis for 11th August 2026NSE:NIFTY
Highest Call OI is at 24600 strike and Highest Put OI at 24500 and moment openly possible if Index breaks and sustains beyond this range on either side.
The upward movement may lead to 24800 – 24850 resistance range and if the index crosses and sustains above this level then may reach near 25050 – 25100 range.
On the contrary, The downward moment may drag the Index to 24350 – 24300 support range in downward momentum and if this support is broken then index may tank near 24100
Banknifty Intraday Analysis for 11th August 2026NSE:BANKNIFTY
The highest Call and Put OI is built up at 58000 strike which will act as resistance as long as it is not broken and on the downside index has support at 57500 support and if broken then downward moment is inevitable.
The upward moment may lead the Index to 58400 – 58500 resistance range in upward momentum and if the index crosses and sustains above this level then may reach near 59100 – 59200 range.
On the contrary, The downward moment may drag the Index to 57000 – 56900 sup
Finnifty Intraday Analysis for 11th August 2026NSE:CNXFINANCE
Index is near 26500 support and uptrend is expected to continue as long as index is above this level.
The upward movement may lead the Index to 26800 - 26850 resistance range and if the index crosses and sustains above this level then may reach near 27100 - 27150 range.
On the contrary, The downward moment may drag the to 26300 – 26250 support range and if this support too is broken then index may tank near 26000 – 25950 range.
Midnifty Intraday Analysis for 11th August 2026NSE:NIFTY_MID_SELECT
Uptrend is expected to continue as long as the index is above 14800 level.
The upward movement may lead the Index near 15100 – 15125 resistance range and if the index crosses and sustains above this level then may reach 15275 – 15300 range.
On the contrary, The downward moment may drag the index to 14800 – 14775 support range and if this support is broken then index may tank near 14625 – 14600 range.
NIFTY| Trendline Meets Resistance — Confluence Zone on WatchOverview
After a structured decline from the January highs, NIFTY is now approaching one of the most significant technical confluences visible on the Daily chart — a point where a descending resistance trendline meets a horizontal resistance cluster near the 24,265 Swing High.
This is not a routine resistance test. It is a multi-layered confluence, and the market's reaction here will likely set the tone for the weeks ahead.
What the Chart Is Showing
📉 Descending Resistance Trendline — A clean t
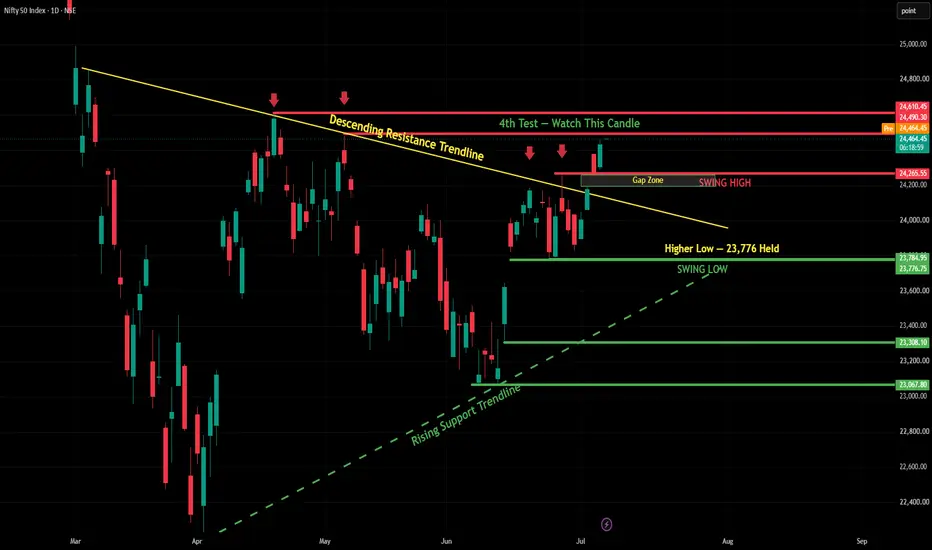
NIFTY | Trendline Breakout Attempt — Structure Turning BullishOverview
In our previous analysis, we highlighted the Descending Resistance Trendline and the critical 23,776 Higher Low as key structural markers. This week, NIFTY has delivered a significant development — price has broken above the Swing High at 24,265 and is now trading at 24,430, above the descending trendline.
The structure is gradually shifting from bearish to potentially bullish. Here is the updated analysis.
What Changed This Week
📈 Trendline Breakout — Price has now closed above the De
NIFTY 50 — Tracking Support Zones Amid Gap-Down OpeningOverview
GIFT Nifty is indicating a gap-down opening in the 24,200–24,250 zone today, following a pullback from recent highs near 24,530. Rather than reacting to the gap in isolation, it's worth mapping this against the broader support structure that has held over the past two weeks, since Nifty has repeatedly demonstrated a pattern of higher lows even through short-term corrections.
Pattern Explanation
The index has been in a rising structure since late June, with each pullback finding support
NIFTY 50 — Breakout Confirmed, Now Facing a Sharp RetestOverview
Nifty's Equilibrium Zone, tested four separate times since March, finally broke out on July 3 and rallied to a high of 24,530 in the sessions that followed. Today's session reversed that momentum sharply, falling 2.12% to close at 23,882 with an intraday low of 23,805 — pulling price back toward the same zone that had capped rallies through the earlier consolidation. This makes today's move a genuine retest of the breakout rather than an isolated dip.
Pattern Explanation
Between March a