BSE Ltd — Bouncing from 0.786 Fib Support, Fresh Bullish SetupOverview
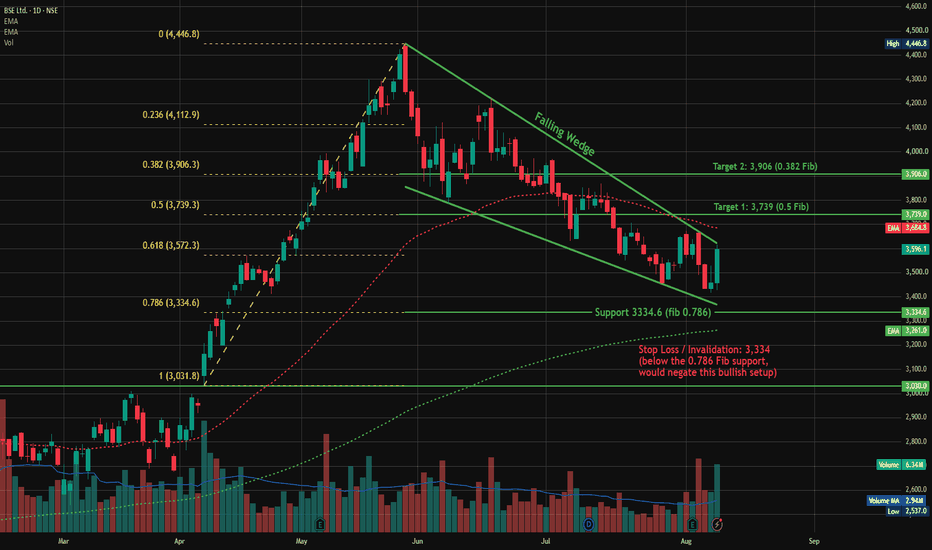
BSE closed today at 3,596.1, up 4.02%, a strong bounce after finding support near the 0.786 Fib level (3,334.6) that we flagged as the next zone to watch in our last update. This bounce has brought price back up toward the falling wedge's upper trendline, and it's worth tracking as a fresh setup.
Follow-up Context
In our earlier post, we noted the 0.618 Fib + wedge zone (3,570–3,610) had failed to hold, and price fell through to the 0.786 Fib level. That level has now given the bounc
Trend Lines
Nifty Intraday Analysis for 10th August 2026NSE:NIFTY
Highest Call OI is at 24600 strike which will act as immediate resistance and uptrend only possible if the index breaks and sustains above 24600 level.
The upward movement may lead to 24800 – 24850 resistance range and if the index crosses and sustains above this level then may reach near 25050 – 25100 range.
On the contrary, The downward moment may drag the Index to 24300 – 24250 support range in downward momentum and if this support is broken then index may tank near 24050
Banknifty Intraday Analysis for 10th August 2026NSE:BANKNIFTY
Highest Call and Put OI is built up at 58000 strike which will act as make of break level. uptrend only possible if the index breaks and sustains above 58000 level.
The upward moment may lead the Index to 58500 – 58600 resistance range in upward momentum and if the index crosses and sustains above this level then may reach near 59200 – 59300 range.
On the contrary, The downward moment may drag the Index to 57000 – 56900 support range in downward momentum and if this support i
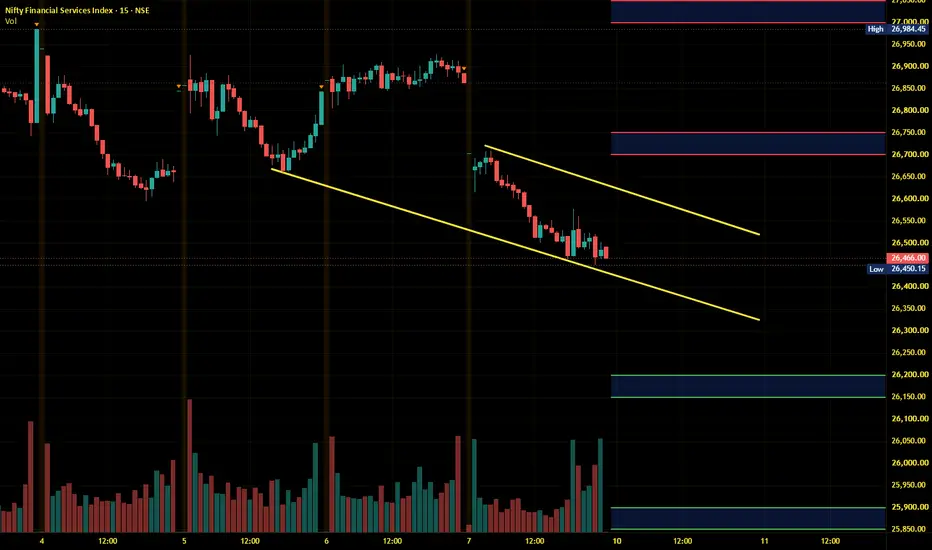
Finnifty Intraday Analysis for 10th August 2026NSE:CNXFINANCE
The downward momentum is expected to continue.
The downward moment may drag the to 26200 – 26150 support range and if this support too is broken then index may tank near 25900 – 25850 range.
On the contrary, The upward movement may lead the Index to 26700 - 26750 resistance range and if the index crosses and sustains above this level then may reach near 27000 - 27050 range.
Midnifty Intraday Analysis for 10th August 2026NSE:NIFTY_MID_SELECT
The Index has support near 14775 - 14750 range and it is broken then downward moment expected in the short term.
The upward movement may lead the Index near 5025 – 15050 resistance range and if the index crosses and sustains above this level then may reach 15200 – 15225 range.
On the contrary, The downward moment may drag the index to 14725 – 14700 support range and if this support is broken then index may tank near 14550 – 14525 range.
TATA CHEMICALS — Falling Wedge Nearing Resolution, Bullish SetupOverview
Tata Chemicals closed Friday's session at 673.55, up 1.55%, right near the support of a falling wedge that has formed since the stock topped out at 854.85 in April. Falling wedges are typically bullish patterns, and price testing the lower boundary here is worth watching closely as we head into the new week.
Pattern Explanation
Since the April high, the stock has been making lower highs and lower lows, but within two converging trendlines, a steeper falling resistance and a shallower
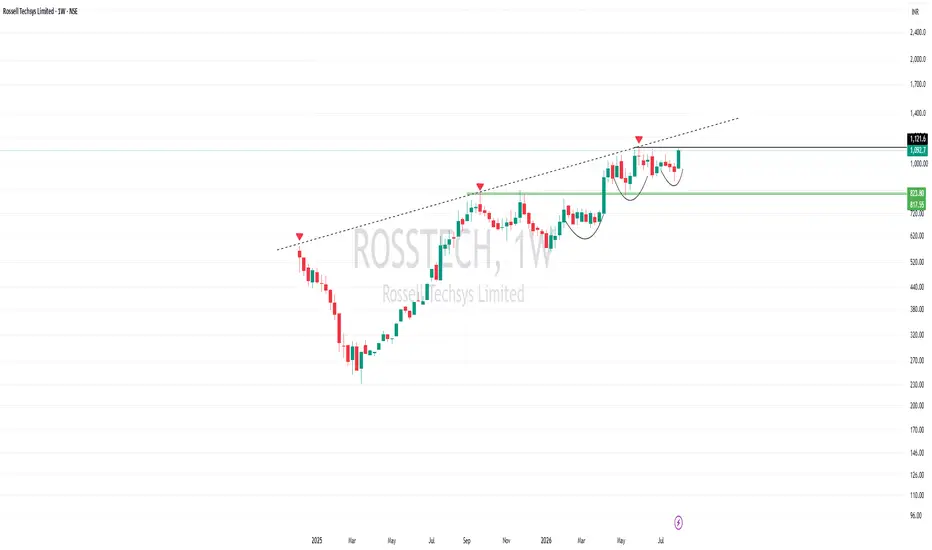
Rossell Techsys Ltd. (Weekly) – Educational Technical Analysis
This post is purely an educational breakdown of the current chart structure and the technical concepts it demonstrates.
1. Stage Analysis
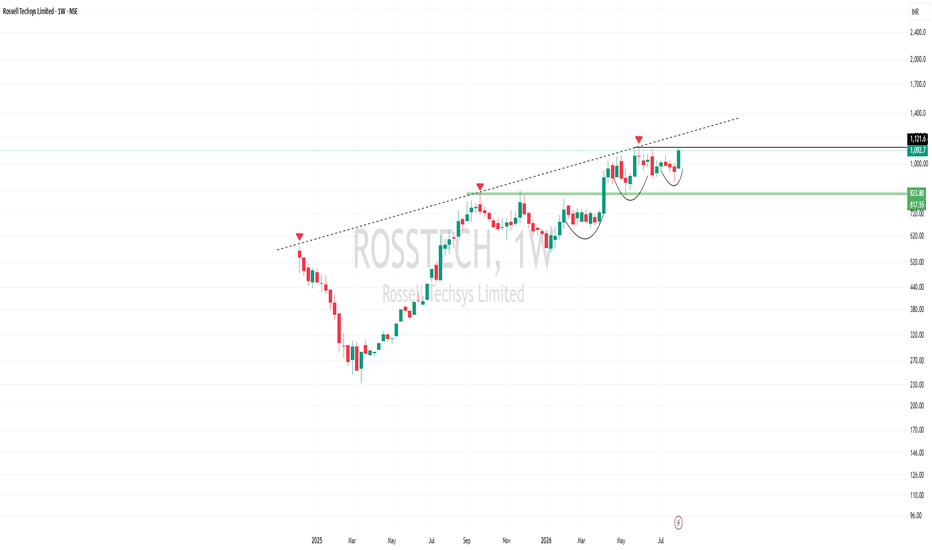
The stock continues to trade in Stage 2, characterised by higher highs and higher lows. It is currently at an interesting point where the next major move will likely determine whether the primary uptrend resumes or weakens.
Bullish scenario: Breakout from the current base → Stage 2 continuation.
Bearish scenario: Breakdown below the current consol
XAUUSD Weekly Plan — The NFP Breakout Changed the MapGold did not end the week quietly.
After the NFP reaction, price broke out strongly from the previous consolidation structure and pushed into a new bullish range.
Now the market is trading around 4,340 - 4,350, close to the first Fibo extension reaction area.
The trend is bullish.
But this is exactly where many traders make the same mistake:
They chase the candle after the news.
Tiara’s plan is different.
I want to see whether gold can confirm continuation or return for a clean retest.
T
This weekly candle's high and low are very crucial.As we can see a sign of indecision has been formed above the demand zone. Hence, we can expect NIFTY to stay between this zone unless it breaks either side. Since it a weekly indecision candle, either side break can show further move in that direction. So, plan your trades accordingly and keep watching everyone.
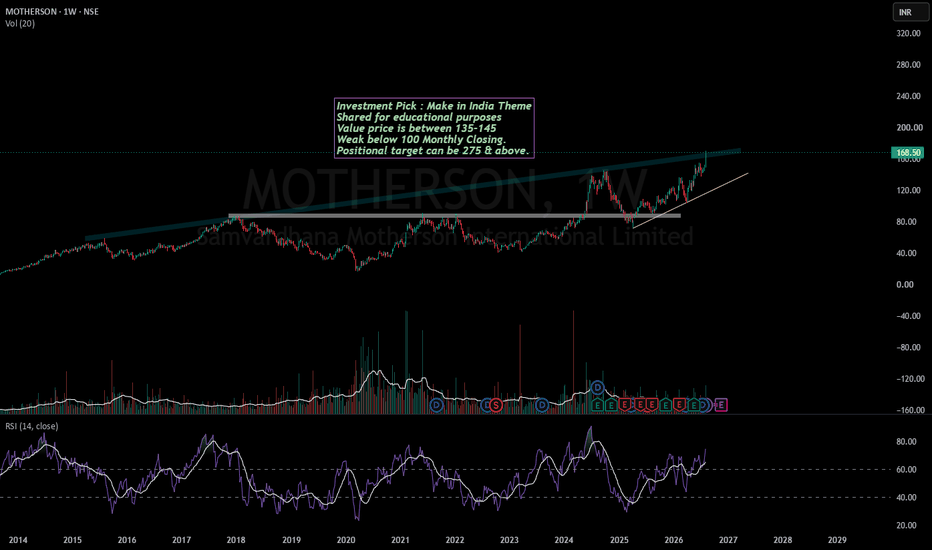
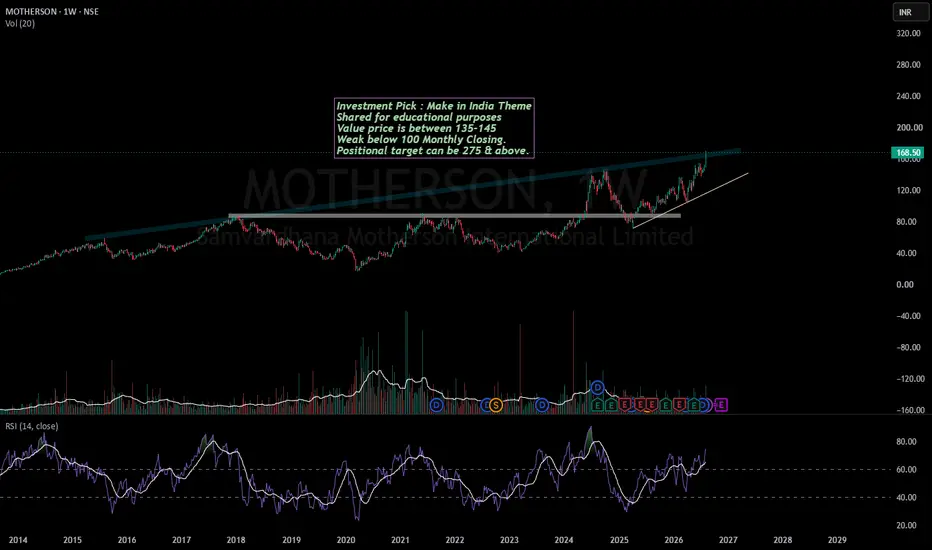
Motherson - An amazing auto ancillary stockMotherson Samvardhan has posted some amazing Q1 FY27 results similar to other Auto ancillary companies.
With the growing demand of EVs and commercial vehicles, we can see some sustainable high growth in these ancillary companies.
Stock is already in a strong uptrend and has broken a weekly trendline resistance. It is available at its 10 year average PE which is around 40.
If this stock manages to sustain above 135 for 1-2 months, we will see a strong rally which can take the stock to near 300 l
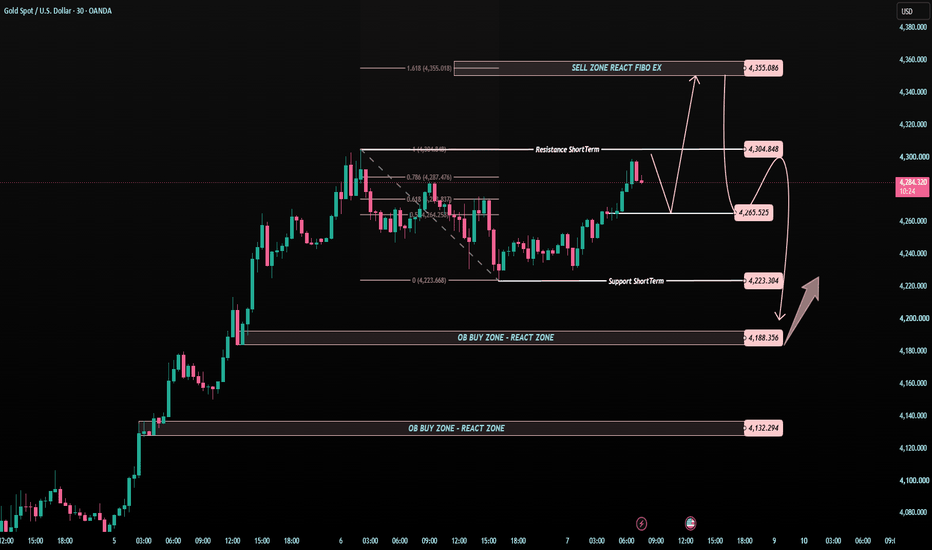
XAUUSD — Strong Trend, But 4,305 Can DecideGold is still holding a strong bullish structure, but price is now entering an important decision area.
After the clean recovery from the lower buy zones, buyers pushed gold higher and brought price close to the 4,305 short-term resistance.
This is where I do not want to chase.
A strong trend can continue, but every strong trend still needs a clean support reaction or breakout confirmation.
The simple read
Gold is currently trading around 4,280 - 4,290.
The first major test is 4,305.
If b
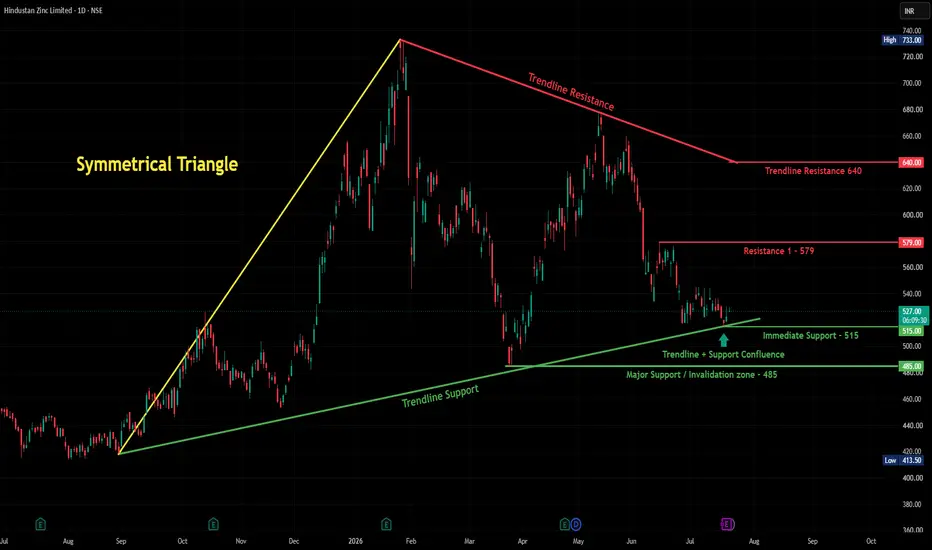
Hindustan Zinc - Squeezed Between Trendline Support & ResistanceOverview
Hindustan Zinc is trading in a tightening zone right now — a rising trendline support from below is meeting resistance levels from above, and price is currently sitting right at the middle of this squeeze around 527.
What's Happening
The stock had a big rally from around 420 last year up to a high of 733, then pulled back hard. Since then, it's been finding support along a rising trendline (currently near 500-515), while facing resistance from a falling trendline coming down from the
Nifty Intraday Analysis for 07th August 2026NSE:NIFTY
The index is range bound in the 24600 - 24700 zone and a big move is expected on that side of the zone which is broken.
The upward movement may lead to 24850 – 24900 resistance range and if the index crosses and sustains above this level then may reach near 25100 – 25150 range.
On the contrary, The downward moment may drag the Index to 24350 – 24300 support range in downward momentum and if this support is broken then index may tank near 24100 – 24050 range.
Banknifty Intraday Analysis for 07th August 2026NSE:BANKNIFTY
Highest Call and Put OI is built up at 58000 strike which will act as make of break level.
The upward moment may lead the Index to 58800 – 58900 resistance range in upward momentum and if the index crosses and sustains above this level then may reach near 59500 – 59600 range.
On the contrary, The downward moment may drag the Index to 57300 – 57200 support range in downward momentum and if this support is broken then the index may tank near the 56600 – 56500 range.
Finnifty Intraday Analysis for 07th August 2026NSE:CNXFINANCE
Uptend is expected to continue as long as the Index is above 26700.
The upward movement may lead the Index to 27100 - 27150 resistance range and if the index crosses and sustains above this level then may reach near 27400 - 27450 range.
On the contrary, The downward moment may drag the to 26600 – 26550 support range and if this support too is broken then index may tank near 26300 – 26250 range.
Midnifty Intraday Analysis for 07th August 2026NSE:NIFTY_MID_SELECT
The Index has support near 14775 - 14750 range and it is broken then downward moment expected in the short term.
The upward movement may lead the Index near 14975 – 15000 resistance range and if the index crosses and sustains above this level then may reach 15150 – 15175 range.
On the contrary, The downward moment may drag the index to 14650 – 14625 support range and if this support is broken then index may tank near 14475 – 14450 range.
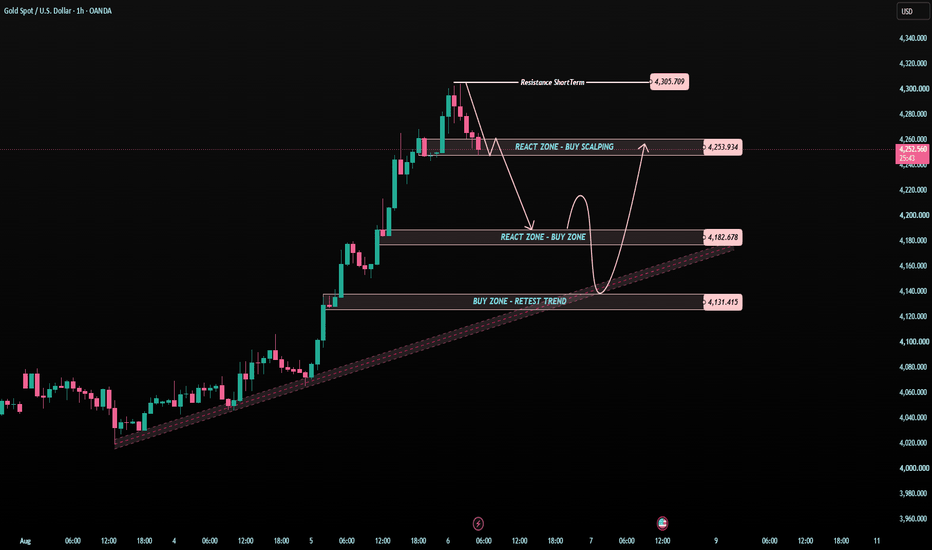
XAUUSD — 4,253 Holds or 4,182 Retest?Gold is still moving inside a strong bullish structure, but the short-term momentum is starting to cool down after testing the 4,305 resistance area.
The rally was very strong.
But after a vertical move, I do not want to chase the top.
I want to see where buyers defend the trend.
The simple read
Gold is now trading around 4,250 - 4,260.
The first important support is 4,253.
This is the React Zone / Buy Scalping area on the chart.
If buyers can defend 4,253, gold may try to recover again
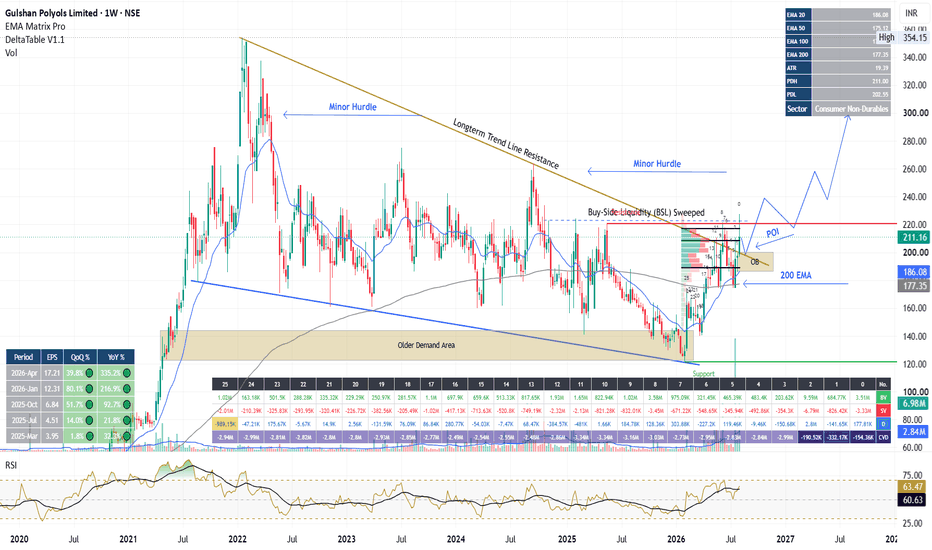
GULPOLY: Multi-Year Trendline BreakoutOverview & Market Structure
Gulshan Polyols Limited ( NSE:GULPOLY ) has completed a multi-year accumulation structure between ₹120 and ₹140. Price has cleared the long-term descending resistance trendline on the weekly timeframe along with the 200-week EMA (₹177.36) on expanded volume.
Order Flow & Delta Confirmation
CVD Expansion: Daily Cumulative Volume Delta (CVD) shifted heavily positive (+920K to +1.04M), confirming aggressive buying at the ask.
POI Retest: The current dip into
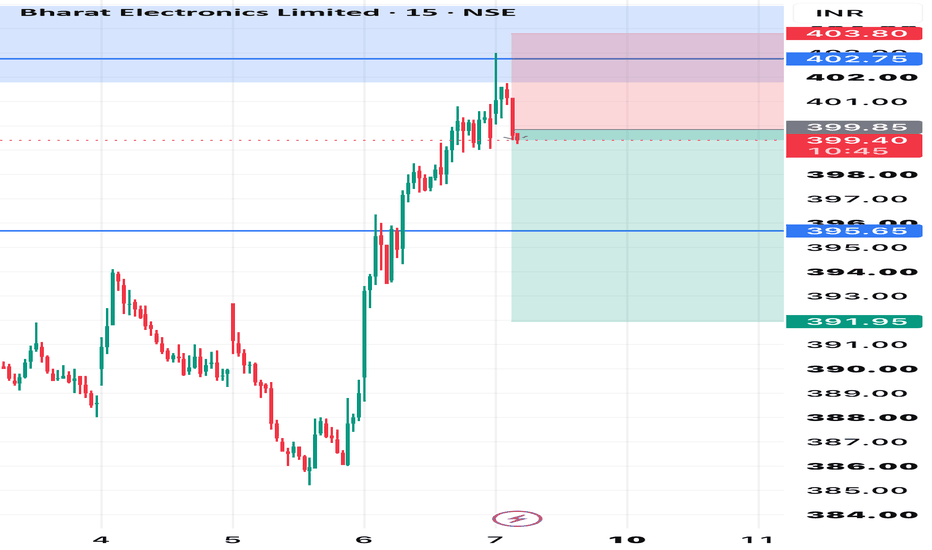
BEL Bearish biasLooking forward on a bearish outlook on Bharat Electronics Stock.
Technically the stock is at a key resistance area and the company ‘s stock is trading at approximately 12.2 times its book value. Adding to this, the company has high debtors of 170 days.
Personally not taking this setup but if a key area is to be looked out for, it would be this one.
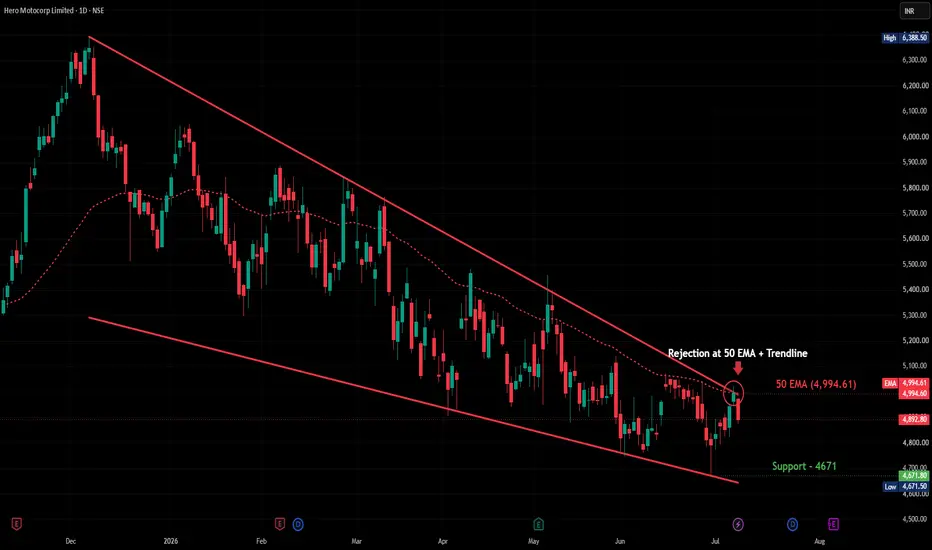
HEROMOTOCO — Falling Wedge Resistance Holds at the 50 EMAOverview
Hero MotoCorp attempted to break above its falling wedge resistance today, touching a high of 4,975 before reversing sharply to close down 2.05% at 4,892.80. Notably, this rejection occurred right at the 50 EMA (4,994.61), which has been tracking closely with the wedge's upper boundary — a double layer of resistance that proved difficult to clear on the first attempt.
Pattern Explanation
The stock has been compressing inside a falling wedge since the December high of 6,388.50, with the
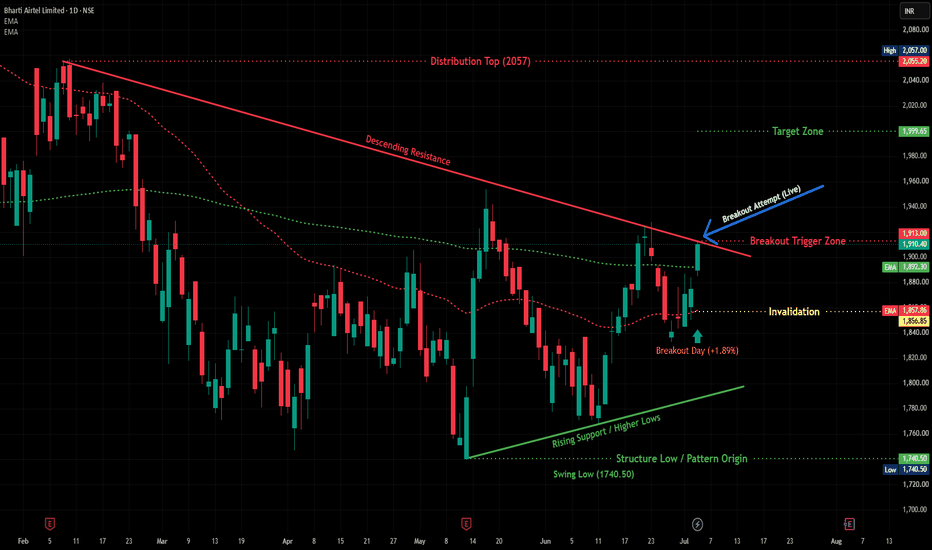
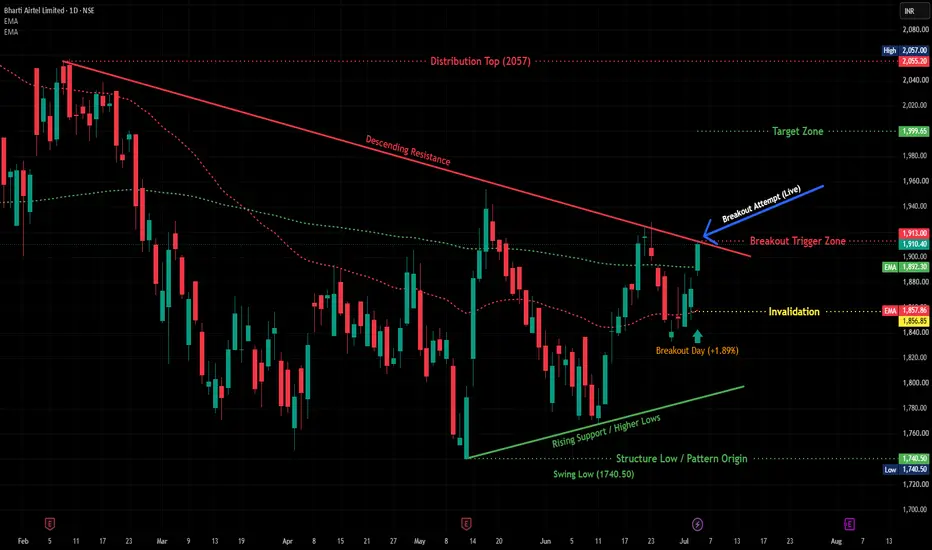
BHARTIARTL — Descending Triangle Testing Breakout on Daily ChartOverview
Bharti Airtel has spent the last five months carving out a textbook descending triangle on the daily chart, and today's session is where it starts getting interesting. Price rallied 1.89% off a strong base, pushing right into the resistance line that's been capping every rally since February. If this holds, we could be looking at the start of a fresh leg higher after months of range-bound grinding.
Pattern Explanation
The structure here is clean: a descending resistance line connecting
Nifty Intraday Analysis for 06th August 2026NSE:NIFTY
24600 is becoming immediate resistance and uptrend only possible if the index decisively sustains above 26600 level.
The upward movement may lead to 24850 – 24900 resistance range and if the index crosses and sustains above this level then may reach near 25100 – 25150 range.
On the contrary, The downward moment may drag the Index to 24350 – 24300 support range in downward momentum and if this support is broken then index may tank near 24100 – 24050 range.