Finnifty Intraday Analysis for 28th July 2026NSE:CNXFINANCE
Volatility expected on the July Month F&O expiry day and swing on either side.
The upward movement may lead the Index to 26400 - 26450 resistance range and if the index crosses and sustains above this level then may reach near 26700 - 26750 range.
On the contrary, The downward moment may drag the to 25850 – 25800 support range and if this support too is broken then index may tank near 25550 – 25500 range.
Trend Lines
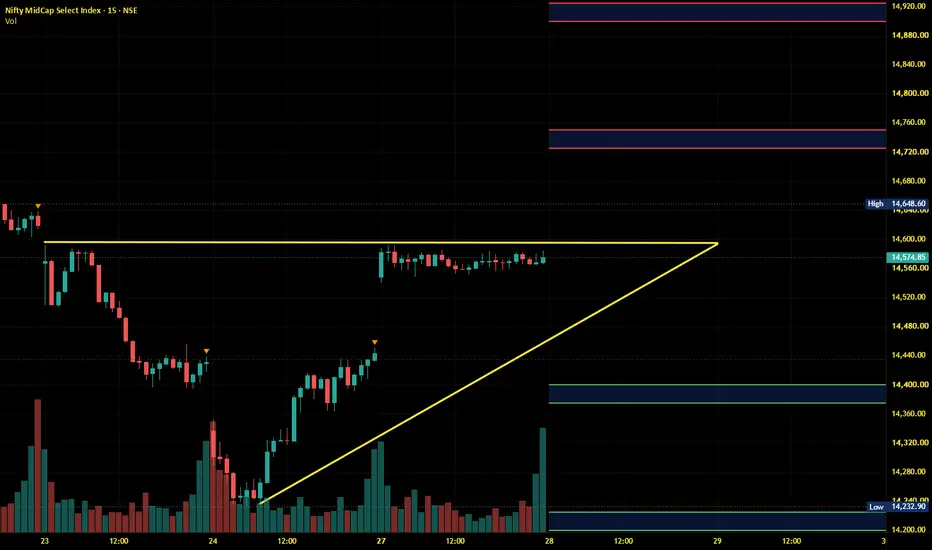
Midnifty Intraday Analysis for 28th July 2026NSE:NIFTY_MID_SELECT
Volatility expected on the July Month F&O expiry day and swing on either side.
The upward movement may lead the Index near 14725 – 14750 resistance range and if the index crosses and sustains above this level then may reach 14900 – 14925 range.
On the contrary, The downward moment may drag the index to 14400 – 14375 support range and if this support is broken then index may tank near 14225 – 14200 range.
Affle India (AFFLE) Descending Triangle Breakout | Bullish ReverAffle India Ltd. (NSE: AFFLE) has confirmed a bullish breakout from a well-defined Descending Triangle pattern on the 4-hour timeframe. After several weeks of correction, sellers gradually lost momentum while buyers consistently defended the horizontal support zone. The recent strong breakout above the descending trendline signals that demand has overpowered supply and that bullish momentum is returning.
The breakout candle is accompanied by strong buying pressure, indicating renewed market con
Tech Mahindra (TECHM) Breakout Analysis | Major Resistance TesteTech Mahindra (NSE: TECHM) is currently trading near a significant long-term resistance zone on the daily timeframe. After a strong bullish rally, the stock has once again reached an area where sellers have previously entered the market. This makes the current price action extremely important for both swing traders and positional investors.
The highlighted resistance zone has acted as a supply area in the past, and price is now attempting to establish acceptance above it. If TECHM manages to cl
XAUUSD — 4,086 Holds or Gap Fills?Gold is starting the new week with a very interesting structure.
After the strong recovery from the lower support area, price is now trading around 4,100 - 4,110 and testing the old downtrend line from above.
This is the moment where many traders may rush in.
But Tiara’s view is simple:
Do not chase the middle of the move.
Wait for the reaction zone.
The simple read
Gold has recovered from the 4,026 support / OB buy zone and pushed strongly back above 4,053.
Now price is holding inside t
XAUUSD — 4,064 Retest or New Low?Gold is losing short-term strength again.
After failing to hold the previous recovery structure, price broke lower and is now trading around 4,045 - 4,050.
This area is important because gold is sitting near a short-term reaction support, but the pressure from the descending liquidity trendline is still active.
So the question today is simple:
Is this a real recovery?
Or just a small bounce before the next leg lower?
The simple read
Gold is currently below the 4,064 order sell zone.
As l
Another trap in formation..?As we can see we are still below the supply zone despite the short covering. Going by our analysis, NIFTY cant show a unidirectional upmove because it has many resistances above both at the trendline and the supply zone which is also a psychological level. Hence, we can expect NIFTY to show weakness below these level considering tgese upmoves as a trap. So, plan your trades accordingly and keep watching everyone.
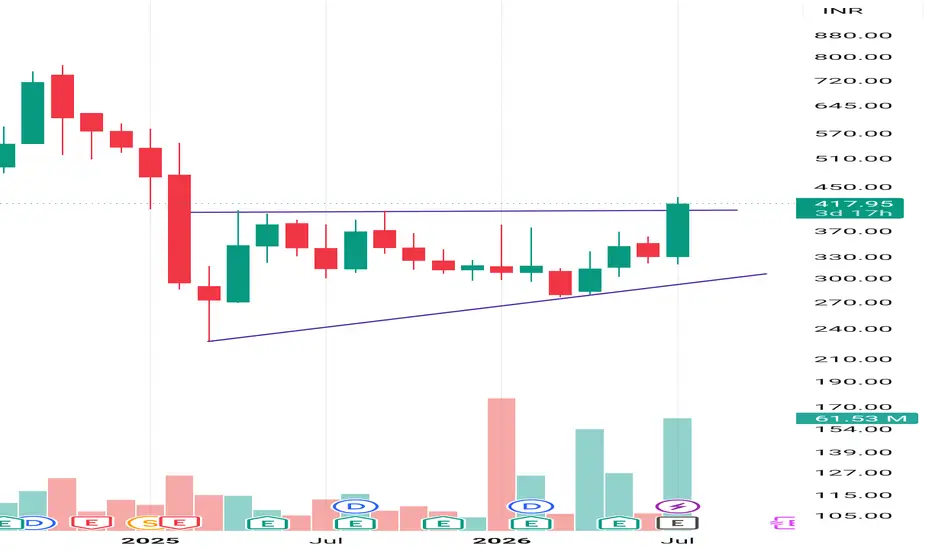
Ascending Triangle PatternFrom the chart you've marked, this appears to be an Ascending Triangle Pattern.
Why?
Horizontal Resistance
Rising Trendline connecting higher lows (bottom purple line).
Price compressed inside the triangle for several candles.
Strong bullish breakout above the resistance with a large green candle.
Volume increased significantly on the breakout, which confirms buying interest.
This is a textbook Ascending Triangle Breakout.
What traders usually look for next
Ideal entry: After the br
Nifty Intraday Analysis for 27th July 2026NSE:NIFTY
Volatility expected as the scheduled Monthly F&O expiry is 28th July and range bound moment expected in range 23600 - 24000.
The upward movement may lead to 24000 – 24050 resistance range and if the index crosses and sustains above this level then may reach near 24250 – 24300 range.
On the contrary, The downward moment may drag the Index to 23550 – 23500 support range in downward momentum and if this support is broken then index may tank near 23300 – 23250 range.
Banknifty Intraday Analysis for 27th July 2026NSE:BANKNIFTY
Volatility expected as the scheduled Monthly F&O expiry is 28th July. An uptrend moment will persist if the index sustains above the 57000 level.
The upward moment may lead the Index to 57400 – 57500 resistance range in upward momentum and if the index crosses and sustains above this level then may reach near 58100 – 58200 range.
On the contrary, The downward moment may drag the Index to 56000 – 55900 support range in downward momentum and if this support is broken then the i
Finnifty Intraday Analysis for 27th July 2026NSE:CNXFINANCE
Volatility expected as the scheduled Monthly F&O expiry is 28th July. Downward risk persists as long as Index is below the 26000 level and uptrend is possible only if index sustains above 26200 - 26250 resistance zone.
The upward movement may lead the Index to 26150 - 26200 resistance range and if the index crosses and sustains above this level then may reach near 26350 - 26300 range.
On the contrary, The downward moment may drag the to 25650 – 25600 support range and if
Midnifty Intraday Analysis for 27th July 2026NSE:NIFTY_MID_SELECT
Volatility expected as the scheduled Monthly F&O expiry is 28th July. Index is slight above 14400 support and if is sleeps below 14400 then -
The downward moment may drag the index to 14275 – 14250 support range and if this support is broken then index may tank near 14100 – 14075 range.
On the contrary, The upward movement may lead the Index near 14600 – 14625 resistance range and if the index crosses and sustains above this level then may reach 14775 – 14800 range.
Godfrey Phillips India Stock Analysis📈 Godfrey Phillips India Ltd. | Falling Trendline Breakout | Bullish Reversal?
A falling trendline bullish reversal appears to be developing as price breaks above a well-defined descending trendline after forming a series of lower highs. This breakout suggests that selling pressure may be weakening and buyers are beginning to regain control.
Key confirmation now comes from sustained price action above the breakout zone. If buyers maintain momentum, the stock could enter a fresh short-term uptre
NIFTY is very weak below 23900! As we can see NIFTY had been falling ever since as analysed! Thought it not unidirectional, it still weak. We can expect NIFTY to take retest around the neckline or the structure which could induce further downfall. Hence as long as NIFTY is below 23900 level, every rise can be shorted. So plan your trades accordingly and keep watching everyone
XAUUSD 4H: Reversal Pattern RepeatsOn the 4H timeframe, XAUUSD has delivered a strong reaction from the highlighted reversal area, where price aligned with a long-term descending trendline resistance. The market was unable to sustain above this confluence, leading to an aggressive bearish rejection.
One of the most notable observations is the formation of a similar candlestick pattern at the reversal zone, resembling the previous bearish rejection that resulted in a sharp decline. This repetition of price behavior suggests that
BTCUSD 4H Analysis: Triple Support Under Bearish Pressure On the 4H timeframe, BTCUSD is currently trading above a well-respected ascending trendline support that has been validated by three significant touch points. These repeated reactions confirm that this trendline has been an important level where buyers have consistently stepped in to defend the market.
However, from a technical perspective, the more times a support level is tested, the greater the probability of it eventually breaking. Price is once again hovering around this key support, sugge
Nifty Intraday Analysis for 24th July 2026NSE:NIFTY
Volatility expected as Highest Put OI is developing at 23500 and Highest Call OI at 25000. 24000 has become the immediate resistance and uptrend only possible if Index sustains above 24050 - 24100 level, downside risk is imminent as long as Index is below 24000 level.
The downward moment may drag the Index to 23650 – 23600 support range in downward momentum and if this support is broken then index may tank near 23400 – 23350 range.
On the contrary, The upward movement may lead
Banknifty Intraday Analysis for 24th July 2026NSE:BANKNIFTY
Index is in downward momentum and uptrend expected if Index sustains above 57000 level.
The downward moment may drag the Index to 55900 – 55800 support range in downward momentum and if this support is broken then the index may tank near the 55200 – 55100 range.
On the contrary, The upward moment may lead the Index to 57300 – 57400 resistance range in upward momentum and if the index crosses and sustains above this level then may reach near 58000 – 58100 range.
Finnifty Intraday Analysis for 24th July 2026NSE:CNXFINANCE
Downward risk is imminent as long as Index is below the 26000 level and uptrend is possible only if index sustains above 26200 - 26250 resistance zone.
The downward moment may drag the to 25750 – 25700 support range and if this support too is broken then index may tank near 25450 – 25400 range.
On the contrary, The upward movement may lead the Index to 26350 - 26400 resistance range and if the index crosses and sustains above this level then may reach near 26650 - 26700 r
Midnifty Intraday Analysis for 24th July 2026NSE:NIFTY_MID_SELECT
Downward risk is imminent up to 14000 as long as Index is below the 14500 level and uptrend is possible only if index sustains above 14600 resistance level.
The downward moment may drag the index to 14275 – 14250 support range and if this support is broken then index may tank near 14100 – 14075 range.
On the contrary, The upward movement may lead the Index near 14575 – 14600 resistance range and if the index crosses and sustains above this level then may reach 14750 –
XAUUSD — 4,048 Retest or Breakdown?Gold is still under short-term selling pressure after losing the previous rising structure.
Price is now trading around 4,030 - 4,040, reacting from the OB buy scalping area near 4,023.
At first look, this bounce may feel positive.
But the bigger short-term structure is still not clean for buyers.
Why?
Because gold is still moving below the downtrend line, and the next resistance is very close.
The simple read
Gold has dropped from the upper area and is now trying to recover from 4,023.
BHEL Stock Analysis 📈 BHEL | Falling Trendline Breakout
A falling trendline breakout indicates that buyers have successfully pushed the price above a key resistance level, signaling a potential shift in momentum from bearish to bullish.
If the breakout sustains with strong volume and follow-through buying, BHEL could witness a fresh upward move toward the next resistance levels. However, traders should watch for a successful retest of the breakout zone to confirm the strength of the trend.
⚠️ This analysis is fo
XAUUSD — 4,131 Trap or 4,071 Retest?Gold is showing early weakness after failing to extend above the recent high area.
Price is now trading around 4,115 - 4,120, below the OB sell zone near 4,131.
This is where the chart becomes interesting.
Because the short-term bullish move is still visible.
But buyers are starting to lose momentum near resistance.
The question today is simple:
Is gold only taking a small pause, or is the market preparing for a deeper retest?
The simple read
Gold recently created a strong upside move fr
NIFTY will fall sharply below 23780!As we can see NIFTY again got some minor support at the drawn trendline but there is no eminent support if NIFTY breaks below 23780. So once 23780 level is broken down and sustained, we may see a strong downfall. So plan your trades accordingly and keep watching everyone.