NIFTY will fall sharply below 23780!As we can see NIFTY again got some minor support at the drawn trendline but there is no eminent support if NIFTY breaks below 23780. So once 23780 level is broken down and sustained, we may see a strong downfall. So plan your trades accordingly and keep watching everyone.
Trend Lines
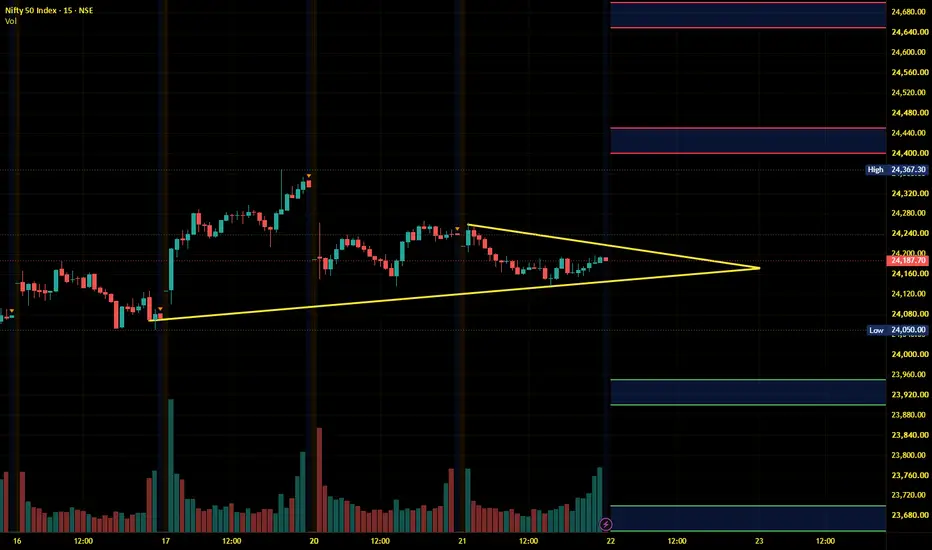
Nifty Intraday Analysis for 23rd July 2026NSE:NIFTY
Highest Call Put OI is made at 24000 Strike which will play the crucial level until expiry. If Index sustains above 24050 then uptrend expected else downward move is inevitable.
The upward movement may lead to 24200 – 24250 resistance range and if the index crosses and sustains above this level then may reach near 24450 – 24500 range.
On the contrary, The downward moment may drag the Index to 23800 – 23750 support range in downward momentum and if this support is broken then i
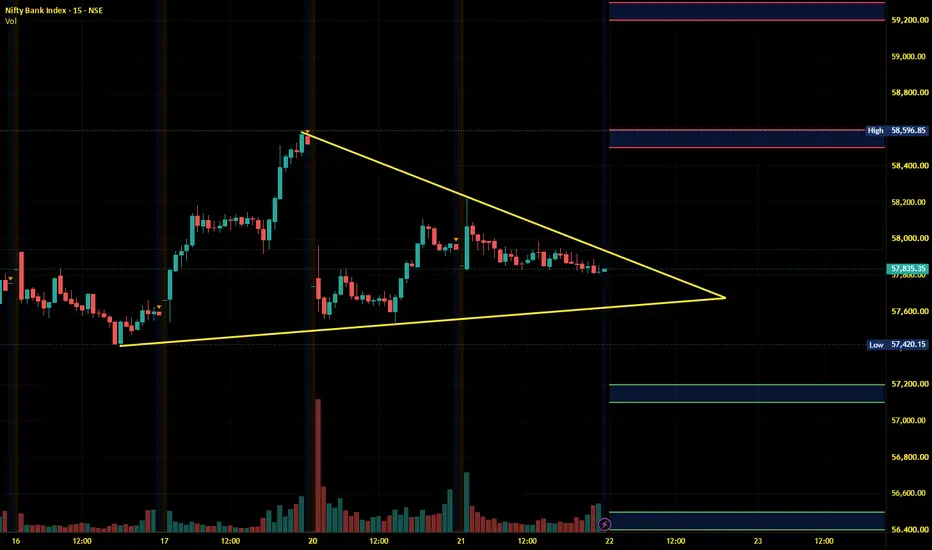
Banknifty Intraday Analysis for 23rd July 2026NSE:BANKNIFTY
Index is in downward momentum and uptrend expected if Index sustains above 57500 level.
The upward moment may lead the Index to 57800 – 57900 resistance range in upward momentum and if the index crosses and sustains above this level then may reach near 58500 – 58600 range.
On the contrary, The downward moment may drag the Index to 56500 – 56400 support range in downward momentum and if this support is broken then the index may tank near the 55700 – 55600 range.
Finnifty Intraday Analysis for 23rd July 2026NSE:CNXFINANCE
Index is in downward momentum and uptrend expected if Index sustains above 26300 level.
The upward movement may lead the Index to 26550 - 26600 resistance range and if the index crosses and sustains above this level then may reach near 26850 - 26900 range.
On the contrary, The downward moment may drag the to 25950 – 25900 support range and if this support too is broken then index may tank near 25650 – 25600 range.
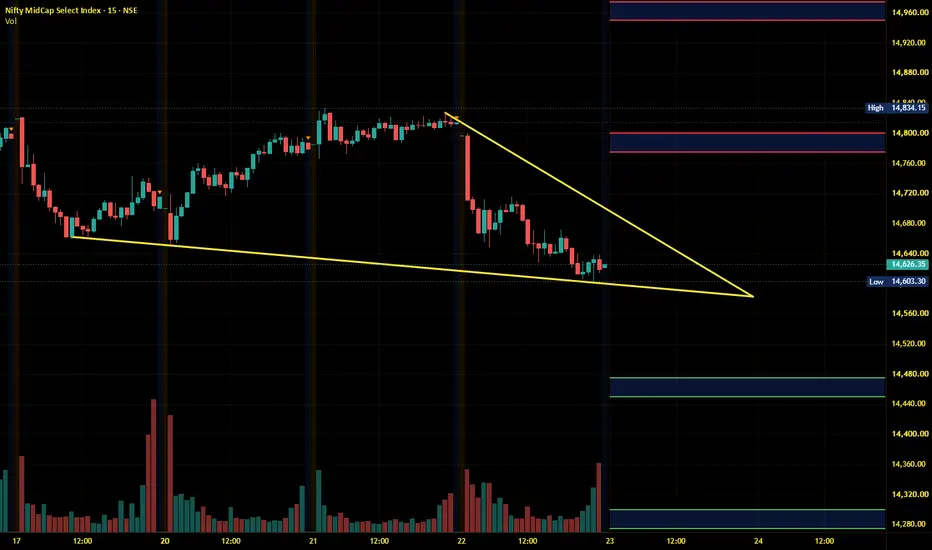
Midnifty Intraday Analysis for 23rd July 2026NSE:NIFTY_MID_SELECT
Index is near 14700 resistance level as long as Index is below this level downward trend is inevitable.
The upward movement may lead the Index near 14775 – 14800 resistance range and if the index crosses and sustains above this level then may reach 14950 – 14975 range.
On the contrary, The downward moment may drag the index to 14475 – 14450 support range and if this support is broken then index may tank near 14300 – 14275 range.
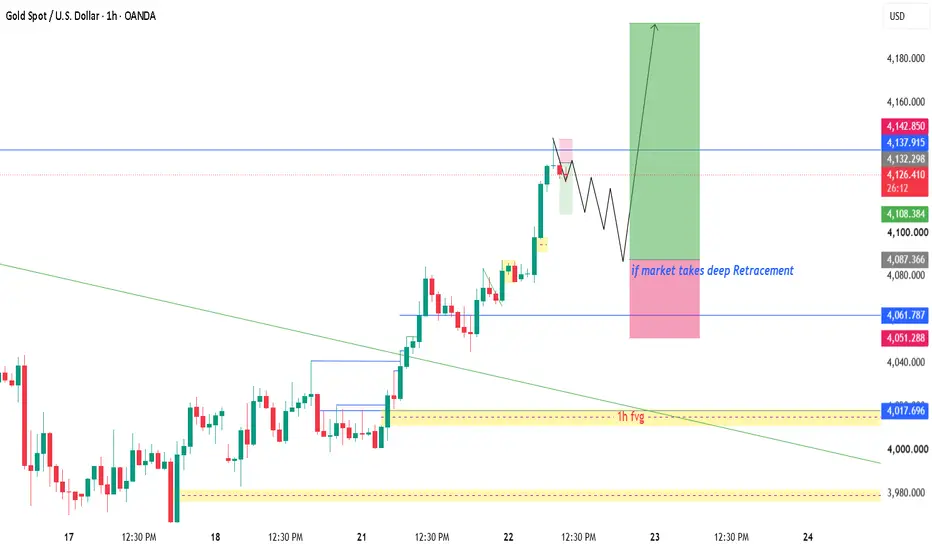
XAUUSD — Can 4,142 Unlock 4,169?Gold is showing strong bullish momentum after breaking out from the previous descending channel.
Price is now trading around 4,135 - 4,145 and testing the first important reaction zone near 4,142.
This is where the chart becomes very interesting.
Because buyers are clearly in control short-term.
But price is also entering a sell reaction zone.
So the question is not:
“Should we chase the move now?”
The better question is:
“Can gold hold this breakout, or does it need a retest first?”
Th
The trendline is broken but not the demand zone!As we can see though the trendline has been broken down but the demand zone remains intact which shows there is still no confirmation of the further bearishness as it has closed above the demand zone. We may expect NIFTY to continue its bearishness if NIFTY breaks below its last day's low. Until then we can expect NIFTY to remain between the range. So, plan your trades accordingly and keep watching everyone.
Nifty Intraday Analysis for 22nd July 2026NSE:NIFTY
Index is near 24200 - 24250 resistance zone and if the index sustain above this resistance, then -
The upward movement may lead to 24400 – 24450 resistance range and if the index crosses and sustains above this level then may reach near 24650 – 24700 range.
On the contrary, The downward moment may drag the Index to 23950 – 23900 support range in downward momentum and if this support is broken then index may tank near 23700 – 23650 range.
Banknifty Intraday Analysis for 22nd July 2026NSE:BANKNIFTY
Index near 58000 - 58100 resistance if Index could not break and sustain above this resistance then break down below 57700 will drag to Index down.
The upward moment may lead the Index to 58500 – 58600 resistance range in upward momentum and if the index crosses and sustains above this level then may reach near 59200 – 59300 range.
On the contrary, The downward moment may drag the Index to 57200 – 57100 support range in downward momentum and if this support is broken then the
Finnifty Intraday Analysis for 22nd July 2026NSE:CNXFINANCE
Highest Call OI in the Index is at 27500 strike, If Index sustain above 26500, rapid uptrend expected. If Index could not sustain above 26500 level then Index is expected to go down.
The upward movement may lead the Index to 26800 - 26850 resistance range and if the index crosses and sustains above this level then may reach near 27100 - 27150 range.
On the contrary, The downward moment may drag the to 26250 – 26200 support range and if this support too is broken then index
Midnifty Intraday Analysis for 22nd July 2026NSE:NIFTY_MID_SELECT
Index is near resistance and if the index sustain above 14850 then -
The upward movement may lead the Index near 14975 – 15000 resistance range and if the index crosses and sustains above this level then may reach 15150 – 15175 range.
On the contrary, The downward moment may drag the index to 14650 – 14625 support range and if this support is broken then index may tank near 14475 – 14450 range.
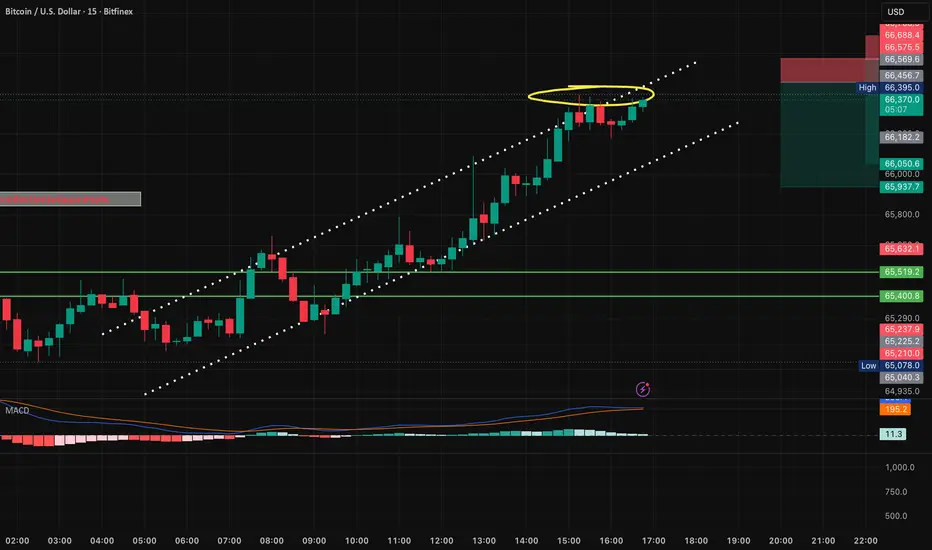
Bitcoin AnalysisIf the price breaks below 58,000–57,700, it could trigger a significant bearish move toward the 50,000–40,000 zone.
A decisive breakdown below 40,000 may open the path to the 20,000–15,000 range.
Until those key support levels are breached, the overall trend remains strong, with the potential to advance toward the 65,000–75,000 target in the near future.
TITAN Stock Analysis || 📈 TITAN LTD. | Horizontal Resistance Breakout | Bullish Continuation
Price broke above the horizontal channel after a consolidation underneath. A breakout suggests buyers are strong and have successfully absorbed selling pressure at the resistance zone.
On the 1H chart, Titan has confirmed a clean breakout after spending multiple sessions consolidating below resistance. The breakout is supported by strong bullish follow-through candles, indicating sustained buying momentum and increasing proba
HDFC Bank — Fourth Test of a Multi-Year TrendlineOverview
HDFC Bank has just fallen sharply this week (-7.09%), and this drop is bringing it down toward a trendline that's been holding since 2022. This trendline has already been tested three times before — and now it's headed for a fourth test, right around the 732 zone.
What's Happening
Looking at the weekly chart, there's a rising trendline connecting the lows going all the way back to 2022. Price has tested this trendline three times already (marked on the chart), and each time it has he
NIFTY remains sideways yet another day! As we can see NIFTY remained sideways throughout the day exactly as analysed. It is likely to remain sideways until it breaks and sustains itself above or below either of the levels. Additionally, we can expect NIFTY to show a strong unidirectional move either side as it had been consolidating since last few months now, making both demand and supply zone weak. Hence break of either of the levels could show strong unidirectional move. So plan your trades accordingly and keep watching everyone.
360 ONE WAM Ltd. (1W) – Technical AnalysisOverall Trend
The long-term trend remains bullish, as the stock has rallied significantly from the ₹400–500 zone to above ₹1,300. However, after this strong advance, the stock has entered a multi-month consolidation phase.
Chart Pattern
The price is trading inside a symmetrical triangle, characterized by:
Lower highs, indicating sellers are gradually pushing prices down.
Higher lows, showing buyers continue to accumulate at higher levels.
Declining price swings, suggesting volatility is cont
Hero MotoCorp (HEROMOTOCO) – Trendline Breakout AnalysisHero MotoCorp has given a strong breakout above a long-term descending trendline on the 2H timeframe while reclaiming the 200 EMA. This price action indicates improving bullish momentum after a prolonged consolidation.
Key Observations:
✅ Descending Trendline Breakout
✅ Price Trading Above 200 EMA
✅ Higher High Formation
✅ Bullish Momentum Building
✅ Volume Confirmation (Watch Closely)
Nifty Intraday Analysis for 21st July 2026NSE:NIFTY
Index is the range between 24000 - 24350 range and range bound moment is expected as long as the index will be in this range. If index breaks and sustain above 24350, then -
The upward movement may lead to 24450 – 24500 resistance range and if the index crosses and sustains above this level then may reach near 24700 – 24750 range.
On the contrary, The downward moment may drag the Index to 24000 – 23950 support range in downward momentum and if this support is broken then index
Banknifty Intraday Analysis for 21st July 2026NSE:BANKNIFTY
Index is the range between 57300 - 58600 range and range bound moment is expected as long as the index will be in this range.
The upward moment may lead the Index to 58600 – 58700 resistance range in upward momentum and if the index crosses and sustains above this level then may reach near 59300 – 59400 range.
On the contrary, The downward moment may drag the Index to 57300 – 57200 support range in downward momentum and if this support is broken then the index may tank near t
Finnifty Intraday Analysis for 21st July 2026NSE:CNXFINANCE
Index is near support of 26400 - 26300 zone and uptrend is expected as long as index is above this support zone.
The upward movement may lead the Index to 26850 - 26900 resistance range and if the index crosses and sustains above this level then may reach near 27150 - 27200 range.
On the contrary, The downward moment may drag the to 26400 – 26350 support range and if this support too is broken then index may tank near 26100 – 26050 range.
Midnifty Intraday Analysis for 21st July 2026NSE:NIFTY_MID_SELECT
Index is near resistance and if the index sustain above 14850 then -
The upward movement may lead the Index near 14950 – 14975 resistance range and if the index crosses and sustains above this level then may reach 15125 – 15150 range.
On the contrary, The downward moment may drag the index to 14625 – 14600 support range and if this support is broken then index may tank near 14450 – 14425 range.
XAUUSD: Bullish Displacement Leaves an FVG, 4,120 Next TargetPrice has recently displaced higher from the lower part of the range, leaving behind an imbalance around the 4,035–4,045 area (FVG).
My expectation is not for price to immediately move straight to the upside target.
Instead, I am watching for a possible retracement into the FVG.
If the imbalance holds as support and bullish order flow remains intact, I will then expect price to continue expanding higher to $4,120