Finnifty Intraday Analysis for 21st May 2026 NSE:CNXFINANCE
Crude oil prices have eased but remain above USD 100. While this is positive for the stock market, indices are capped as investors await a decisive resolution to the West Asia conflict.
Index is near 25300 -25350 resistance and if index could not break and sustain above this then the index may drag to 25000 – 24950 support range and if this support is broken then index may tank near 24650 – 24600 range.
On the contrary, upward movement may lead the Index to 25600 - 25650 resistance range and if index crosses and sustains above this level then may reach near 25950 - 26000 range.
Trend Lines
Midnifty Intraday Analysis for 21st May 2026NSE:NIFTY_MID_SELECT
Crude oil prices have eased but remain above USD 100. While this is positive for the stock market, indices are capped as investors await a decisive resolution to the West Asia conflict.
Index is near 14350 support and if this support is broken then the index may drag to 14200 – 14175 support range and if this support is broken then index may tank near 14000 – 13975 range.
On the contrary, upward movement may lead the Index near 14550 – 14575 resistance range and if the index crosses and sustains above this level then may reach 14750 – 14775 range.
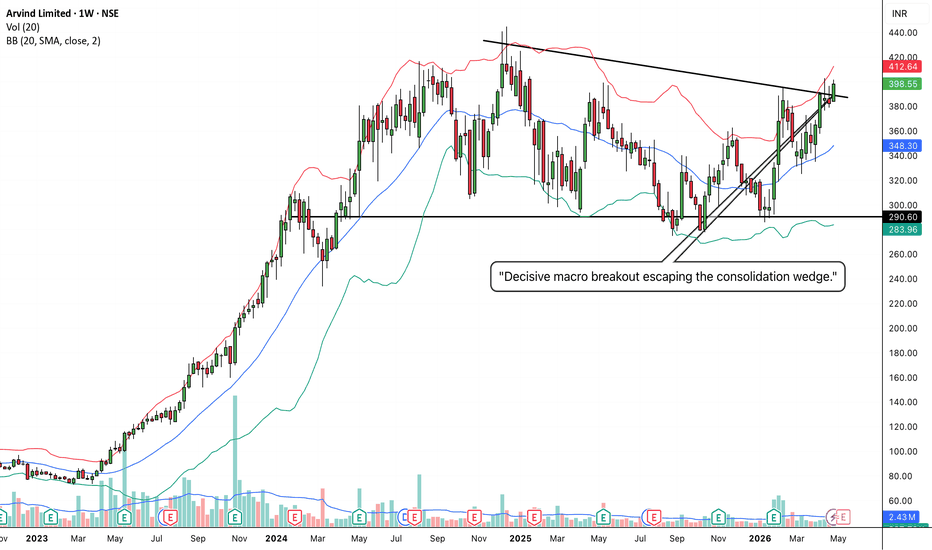
ARVIND: Explosive Trendline Breakout and Volatility Expansion1. The Macro Perspective: The Symmetrical Squeeze
I am taking a LONG bias on Arvind Limited (ARVIND) on the weekly (1W) timeframe.
When analyzing market structure after a massive, prolonged uptrend, we expect the stock to eventually need a rest. For the past several months, ARVIND has been in a healthy macro consolidation phase. It established a rock-solid structural floor down at 290.60, while simultaneously forming lower highs along a descending trendline. This created a massive wedge or triangle pattern, tightly coiling the price action and storing kinetic energy for the next major directional move.
2. The Educational Setup: The Launchpad
To understand the mechanics of this breakout, look at the price action relative to the Bollinger Bands:
The Squeeze: Over the last few months, the upper and lower bands began to contract, signaling a drop in volatility and a buildup of pressure.
The Launchpad: Notice how the price pulled back and perfectly tested the 20-period Simple Moving Average (the blue middle band). Instead of breaking down toward the 290.60 floor again, institutional buyers aggressively defended this dynamic mean, using it as a launchpad to attack the descending resistance line with fresh momentum.
3. Current Price Action: The Expansion Phase
Look at the current weekly candle. It has effortlessly shattered the descending macro trendline that has capped the price for months. More importantly, this aggressive push is beginning to force the upper red Bollinger Band to open up and expand outward. When a stock breaks out of a massive multi-month wedge while riding an expanding upper band, it signals a powerful transition from accumulation back into the markup phase.
4. The Trade Plan: Entries, Targets, and Risk Management
Entry Strategy: Momentum is currently extremely strong near 398.55. While aggressive traders might enter here, the highest-probability, lowest-risk entry would involve placing limit orders to catch a potential minor weekly pullback to retest the broken diagonal trendline. Letting that old diagonal ceiling prove itself as a new support floor offers a phenomenal risk-to-reward ratio.
Take Profit (Targets): The immediate structural target is the previous macro swing high near the 430.00 to 440.00 zone. Once the stock clears that final hurdle, it enters fresh price discovery (blue skies), making 500.00 the next major psychological milestone.
Invalidation (Stop Loss): A trade thesis is only valid if the new market structure holds. A hard stop loss should be placed safely below the 20-SMA dynamic support and recent swing lows, around the 340.00 to 350.00 level. A weekly candle closing completely back inside the wedge and below the blue middle band would be an early warning sign of a failed breakout.
5. Time Horizon:
Because this technical setup is built on a 1-Week chart capturing a major structural consolidation breakout, this is a medium-to-longer-term position trade designed to play out over the coming weeks to months.
NIFTY is preparing itself for a big move. As we can see continued rejected from given levels shows strong buying sentiment but cannot be confirmed unless NIFTY closes above 23750 levels . It could be a trap and hence until and unless NIFTY manages to close and sustain above given level, every rise can be shorted! So plan your trades accordingly.
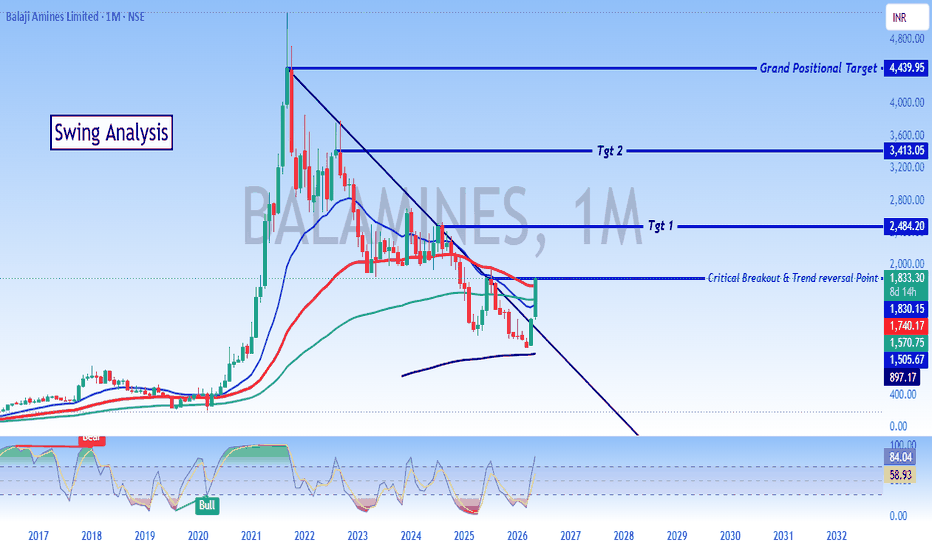
Swing Analysis - Balaji Amines
## 📈 BALAMINES (1M): Major Trend Reversal & Breakout Confirmed!
**Balaji Amines Limited** is flashing a massive bullish signal on the monthly (1M) timeframe. After a prolonged corrective phase from its 2021 highs, the stock has completed a textbook multi-year rounding structure/falling wedge and is breaking out from a critical juncture.
### 🔍 Key Technical Observations:
* **The Breakout Point:** The stock has forcefully breached the downward trendline that has capped prices for years. It is currently sitting precisely at a **Critical Breakout & Trend Reversal Point at ₹1,833.30**.
* **Moving Average Convergence:** Price action is surging above key short-to-medium-term moving averages (blue and red lines), confirming strong bullish momentum and a structural shift from "sell on rallies" to "buy on dips."
* **Stochastic RSI Shift:** Looking at the bottom oscillator, the momentum indicator has successfully hooked up from the oversold territory and is crossing above the 50-level line, signaling that the bulls are firmly back in control.
---
### 🎯 Key Targets & Price Levels:
The swing analysis projects a multi-stage upward trajectory now that the structural reversal is confirmed:
Ultimate long-term target, retesting the lifetime highs of the 2021 bull run. |
**What are your thoughts on Balaji Amines? Are you holding or watching for a clean monthly close? Let's discuss in the comments! 👇**
#BalajiAmines #BALAMINES #TechnicalAnalysis #SwingTrading #StockMarketIndia #TradingView #Investing #ChartOfTheDay #Nifty
### ⚠️ Disclaimer:
The analysis provided above is strictly for educational and informational purposes only. It does not constitute financial advice, an endorsement, or a solicitation to buy or sell any securities. Trading in the stock market involves substantial risk. Please conduct your own due diligence or consult a certified financial advisor before making any investment decisions.
Nifty Intraday Analysis for 20th May 2026NSE:NIFTY
The Market is awaiting decisive resolution of the West Asia conflict as the Crude oil still remains above USD 100. Reduction in Crude oil prices will boost the overall market sentiment.
Index is near 23500 support and if this support is broken then the index may drag to 23375 – 23375 support range and if this support is broken then index may tank near 23075 – 23025 range.
On the contrary, upward movement may lead the Index to 23875 – 243925 resistance range and if the index crosses and sustains above this level then may reach near 24175 – 24225 range.
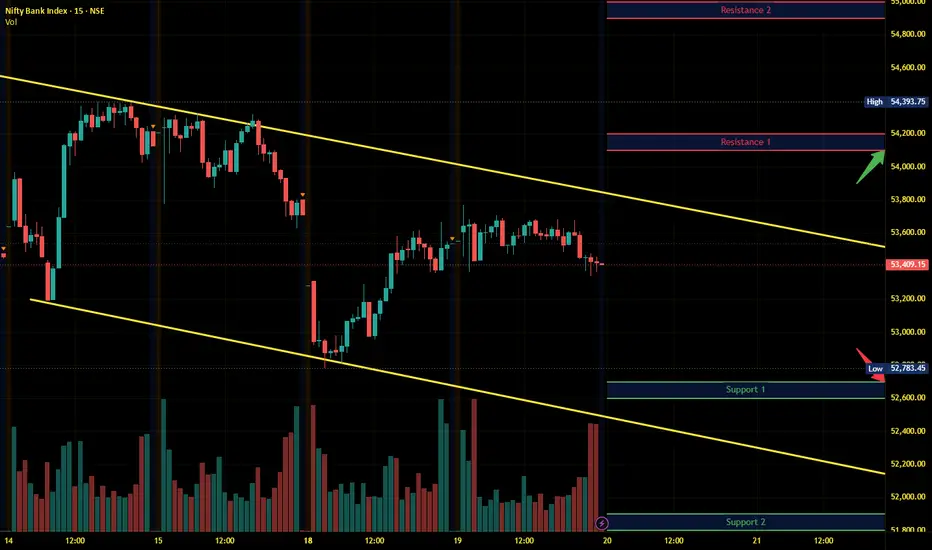
Banknifty Intraday Analysis for 20th May 2026NSE:BANKNIFTY
The Market is awaiting decisive resolution of the West Asia conflict as the Crude oil still remains above USD 100. Reduction in Crude oil prices will boost the overall market sentiment.
Index is near 53300 - 53400 support and if this support is broken then the index may drag to 52700 – 52600 support range and if this support is broken then index may tank near 51900 – 51800 range.
On the contrary, upward movement may lead the Index to 54100 – 54200 resistance range and if the index crosses and sustains above this level then may reach near 54900 – 55000 range.
Finnifty Intraday Analysis for 20th May 2026 NSE:CNXFINANCE
The Market is awaiting decisive resolution of the West Asia conflict as the Crude oil still remains above USD 100. Reduction in Crude oil prices will boost the overall market sentiment.
Index is near 25250 support and if this support is broken then the index may drag to 25000 – 24950 support range and if this support is broken then index may tank near 24650 – 24600 range.
On the contrary, upward movement may lead the Index to 25600 - 25650 resistance range and if index crosses and sustains above this level then may reach near 25950 - 26000 range.
Midnifty Intraday Analysis for 20th May 2026NSE:NIFTY_MID_SELECT
The Market is awaiting decisive resolution of the West Asia conflict as the Crude oil still remains above USD 100. Reduction in Crude oil prices will boost the overall market sentiment.
Index is near 14275 - 14250 support and if this support is broken then the index may drag to 14125 – 14100 support range and if this support is broken then index may tank near 13925 – 13900 range.
On the contrary, upward movement may lead the Index near 14475 – 14500 resistance range and if the index crosses and sustains above this level then may reach 14675 – 14700 range.
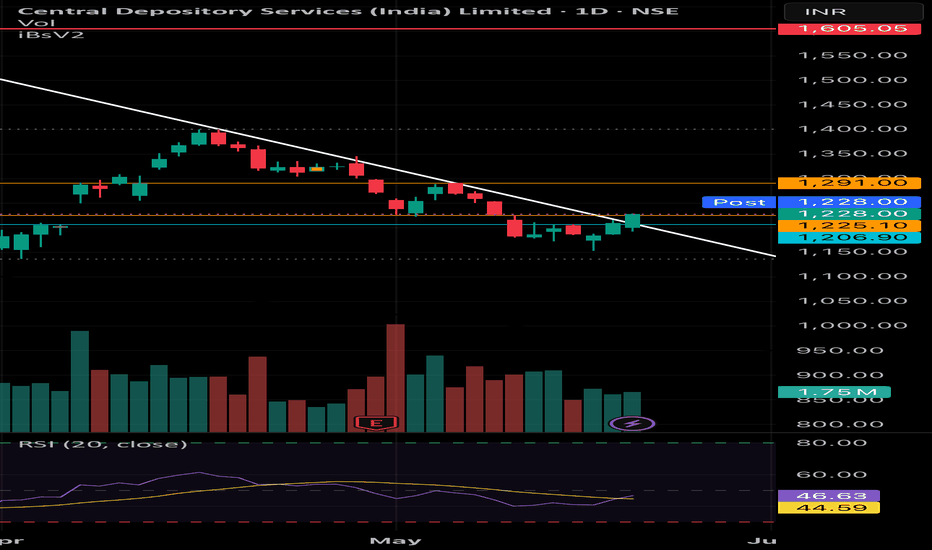
CDSL showing Trend line breakup in daily timeframe CDSL Daily Chart Review
Central Depository Services (India) Limited is showing an early bullish reversal attempt after a prolonged downtrend.
Technical Observations
* Price has given a trendline breakout attempt from the falling resistance line.
* A strong green candle near support indicates buyers are defending lower zones.
* RSI is recovering from weak levels and moving above its signal line, which supports short-term momentum improvement.
* Volume is moderate; a stronger breakout volume would add confirmation.
Important Levels
Immediate Support
* ₹1225 – ₹1205 zone
* Strong demand area.
* Breakdown below this can weaken the setup again.
Immediate Resistance
* ₹1291
* Major hurdle visible on chart.
* Sustained closing above this level can trigger fresh momentum.
Higher Resistance Targets
* ₹1350
* ₹1400
* Positional target if momentum sustains: ₹1500+
Trading View
* As long as price holds above ₹1225, bullish recovery chances remain active.
* A daily close above ₹1291 with good volume may confirm a short-term trend reversal.
* Conservative traders may wait for breakout confirmation above resistance.
Pattern Perspective
The chart currently reflects:
* Descending trendline breakout attempt
* Possible base formation near support
* Early signs of reversal from oversold region
Risk Factor
* Failure to sustain above breakout line may lead to another retest of ₹1200 zone.
* Market-wide weakness can delay breakout follow-through.
Disclaimer
This analysis is only for educational purposes and not investment advice. Please consult your financial advisor before taking any trade. I am not SEBI registered.
BTCUSDT:Testing Key Downward Trendline at Critical Reversal ZoneIf the 2H trendline breaks, then the market direction goes upside.
Bitcoin is trading inside a key reversal zone after a prolonged corrective phase, currently testing a major descending trendline for a potential bullish breakout.
Market Structure: Bearish market structure on the 2H chart characterized by a sequence of lower highs and lower lows.
Trendline Resistance: Price action is tightly hugging a well-defined descending trendline, compressing just under the diagonal resistance.
Support & Demand: The asset has entered a crucial "Reversal Area" / demand zone between $75,650 and $76,250, showing initial signs of price absorption.
Supply References: A clear historical "Supply 2x" zone remains unmitigated above, acting as a secondary magnet if structural shifts occur.
Trading Scenarios
Bullish Trigger: A clean 2H candle close above the descending trendline confirms a market structure shift to the upside.
Bearish Continuation: Failure to break the trendline may lead to a deeper liquidity sweep below the current reversal area.
Nifty Intraday Analysis for 19th May 2026NSE:NIFTY
Crude oil remains above USD 100 as the unresolved Middle East conflict hinders upward market momentum; any reduction in oil prices will likely lift market sentiment.
Index is near resistance and any downward movement may drag to 23450 – 23400 support range and if this support is broken then index may tank near 23100 – 23050 range.
On the contrary, upward movement may lead the Index to 23900 – 243950 resistance range and if the index crosses and sustains above this level then may reach near 24200 – 24250 range.
Banknifty Intraday Analysis for 19th May 2026NSE:BANKNIFTY
Crude oil remains above USD 100 as the unresolved Middle East conflict hinders upward market momentum; any reduction in oil prices will likely lift market sentiment.
Index is near resistance and any downward movement may drag to 52900 – 52800 support range and if this support is broken then index may tank near 52100 – 52000 range.
On the contrary, upward movement may lead the Index to 54300 – 54400 resistance range and if the index crosses and sustains above this level then may reach near 55100 – 55200 range.
Finnifty Intraday Analysis for 19th May 2026 NSE:CNXFINANCE
Crude oil remains above USD 100 as the unresolved Middle East conflict hinders upward market momentum; any reduction in oil prices will likely lift market sentiment.
Index is near resistance and any downward movement may drag to 25050 – 25000 support range and if this support is broken then index may tank near 24700 – 24650 range.
On the contrary, upward movement may lead the Index to 25650 - 25700 resistance range and if index crosses and sustains above this level then may reach near 26000 - 26050 range.
Midnifty Intraday Analysis for 19th May 2026NSE:NIFTY_MID_SELECT
Crude oil remains above USD 100 as the unresolved Middle East conflict hinders upward market momentum; any reduction in oil prices will likely lift market sentiment.
Index is near resistance and any downward movement may drag to 14000 – 13975 support range and if this support is broken then index may tank near 13800 – 13775 range.
On the contrary, upward movement may lead the Index near 14350 – 14375 resistance range and if the index crosses and sustains above this level then may reach 14550 – 14575 range.
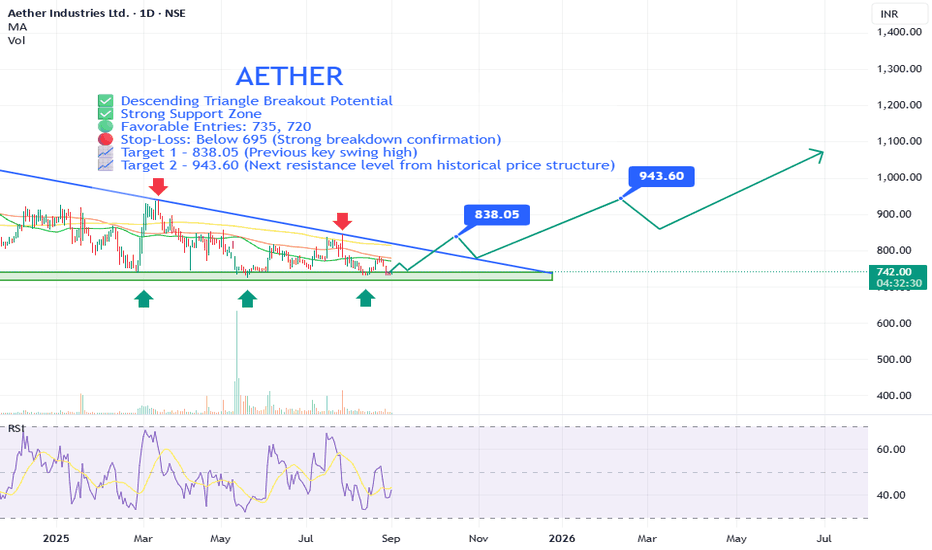
AETHER Bullish Reversal Setup with Strong Risk-Reward PotentialAether Industries Ltd is showing signs of a potential trend reversal from a well-established support zone, supported by a descending triangle breakout pattern and improving technical indicators. This setup suggests a strong risk-reward opportunity for swing traders and positional investors.
⚡ Key Technical Points:
🔵 Descending Triangle Breakout Potential: The price is nearing a breakout from a long-term descending triangle. A breakout above the trendline (~₹778–₹790) could trigger a strong uptrend.
🟢 Strong Support Zone: ₹700–₹720 has held as solid support multiple times (as marked by green arrows), indicating strong demand at these levels.
🟩 Bullish Divergence on RSI: Relative Strength Index (RSI) is showing higher lows while price remains flat or lower, indicating bullish divergence—a sign of potential reversal.
🟢 Favorable Entries: 735, 720
🔴 Stop-Loss: Below 695 (Strong breakdown confirmation)
📈 Target 1 – 838.05 (Previous key swing high)
📈 Target 2 – 943.60 (Next resistance level from historical price structure)
✅ Why This Is a Technically Strong Setup:
✅ Multiple Support Bounces: 700–720 zone has been tested at least 4 times in the last year, showing strength.
✅ Volume-Based Reactions: While volume is low now, past spikes at support zones suggest institutional interest.
✅ Clear Risk Management: Stop-loss is tight (~6–7%) with targets offering 1.5–3x risk-reward potential.
✅ Potential Trend Reversal: Break above descending trendline and moving averages could signal a shift to bullish structure.
✅ Long Base Formation: The stock has been consolidating for over a year—long base formations often lead to explosive moves.
📢 Disclaimer: This is not financial advice. Always do your own research or consult with a professional before making investment decisions.
Nifty 50 Pre open setup -19-05-2026Gift is come down to same levels after post market moves and without any geo politucal scenario improving anyhow and after yesterday recovery move. We expext market to remain flat to lower. Considering the expiry day post 12:00 we expect volatality with call sellers looking for grabbing more space.
Stay cautious and save capital.
Agreement/ No agreement?As we can see we are miles are apart for mediation. The hope for agreement and opening of hormuz is resulting in optimism in NIFTY. Technically, NIFTY is still negative and can show 23000 levels which is its next important demand zone. So plan your trades accordingly and keep watching everyone.
RSI Continuation Secrets: The Power of Positive ReversalsIf you are like most traders, you probably have the RSI indicator on your chart right now. And if you use the RSI, you have likely spent countless hours hunting for "divergences" to catch the exact top or bottom of a market.
We all love the thrill of catching a trend reversal. But let’s be honest: markets trend much longer than we expect, and trying to pick tops can be exhausting (and expensive).
What if, instead of using RSI to figure out when a trend is ending, you used it to spot when a strong trend is primed to continue ?
Enter a massively overlooked concept: The Positive Reversal .
What is a Positive Reversal?
Originally discovered by Andrew Cardwell (and sometimes called a "Hidden Bullish Divergence"), a Positive Reversal happens during an uptrend. It tells you that the current pullback might just be a trap for bears, and the price is gearing up to shoot higher.
Here is the simple formula:
Price makes a Higher Low .
RSI makes a Lower Low .
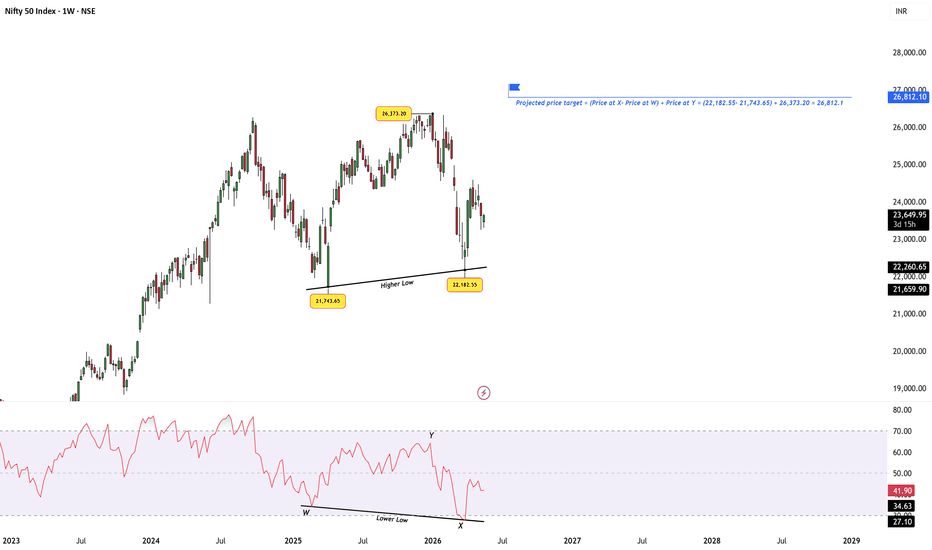
Let's Look at the Nifty Weekly Chart
Take a look at the Nifty 50 Weekly chart attached to this post. It provides a textbook example of this pattern playing out.
The Price Action: Notice how Nifty formed a swing low (around 21,743), rallied, and then pulled back to form a higher low (around 22,182). The price structure is clearly still bullish.
The RSI Trap: Now look at the RSI at the bottom of the chart. During that second price pullback, the RSI dropped significantly lower than it did during the first pullback (from around 34 down to 27).
Why Does This Work?
Think of this pattern like pushing down on a coiled spring.
The RSI dropping to a "Lower Low" shows that the sellers were pushing downward with incredible momentum. But look at the price! Despite all that heavy selling pressure, the buyers were so strong that the price refused to make a lower low.
When sellers throw everything they have at a market and the price still holds up, it points to immense underlying strength. The spring is compressed, and the trend is likely getting ready to explode upward again.
Setting a Target
One of the best parts about Positive Reversals is that they give you a clear mathematical target. To find it, you simply take the difference between your two price lows and add it to the high in the middle.
On our Nifty chart:
Step 1: Subtract the first low from the second low (22,182.55 - 21,743.65 = 438.90).
Step 2: Add that difference to the swing high in the middle (26,373.20 + 438.90).
Target: 26,812.10
The Reality Check: Nothing is Bulletproof
As powerful as this setup is, we have to talk about the golden rule of trading: Nothing is guaranteed. Just like any other technical pattern, Positive Reversals can and will fail. Sometimes market conditions change, news breaks, or the selling pressure simply becomes too much for the buyers to handle. You should never blindly trust a pattern without protecting your capital.
Always use a stop loss. For a Positive Reversal, a common and logical place to put your stop loss is just below the second "Higher Low" (in our Nifty example, slightly below 22,182). If the price breaks below that level, the bullish structure is broken, the pattern has failed, and it is time to exit the trade safely.
The Takeaway
The next time you are in a strong uptrend and the RSI starts looking weak, do not panic sell or rush to short the market. Instead, check if the price is holding a higher low. Manage your risk, place your stop loss, and you might just be staring at your next great trade entry!
Nifty Intraday Analysis for 18th May 2026NSE:NIFTY
Global markets remain cautious after both the U.S.–China summit in Beijing and the BRICS foreign ministers' meeting in New Delhi concluded without a clear diplomatic consensus on ending the West Asia conflict. However, the RBI’s decision to inject ₹1 lakh crore via a 7-day Variable Rate Repo (VRR) will boost the banking sector slightly.
Index is at support and any downward movement may drag to 23450 – 23400 support range and if this support is broken then index may tank near 23100 – 23050 range.
On the contrary, upward movement may lead the Index to 23900 – 243950 resistance range and if the index crosses and sustains above this level then may reach near 24200 – 24250 range.