Nifty Intraday Analysis for 09th July 2026NSE:NIFTY
The global market sentiment has turned negative following news that the United States cancelled its ceasefire agreement with Iran; however, any positive clarification could quickly lift the market, whereas a lack of resolution will likely keep it depressed.
The upward movement may lead to 24100 – 24150 resistance range and if the index crosses and sustains above this level then may reach near 24350 – 24400 range.
On the contrary, a downward moment may drag the Index to 23650 –
Trend Lines
Banknifty Intraday Analysis for 09th July 2026NSE:BANKNIFTY
The global market sentiment has turned negative following news that the United States cancelled its ceasefire agreement with Iran; however, any positive clarification could quickly lift the market, whereas a lack of resolution will likely keep it depressed.
The upward moment may lead the Index to 57500 – 57600 resistance range in upward momentum and if the index crosses and sustains above this level then may reach near 58100 – 58200 range.
On the contrary, a downward moment m
Finnifty Intraday Analysis for 09th July 2026NSE:CNXFINANCE
The global market sentiment has turned negative following news that the United States cancelled its ceasefire agreement with Iran; however, any positive clarification could quickly lift the market, whereas a lack of resolution will likely keep it depressed.
The upward movement may lead the Index to 26600 - 26650 resistance range and if the index crosses and sustains above this level then may reach near 26900 - 26950 range.
On the contrary, a downward moment may drag the to
Midnifty Intraday Analysis for 09th July 2026NSE:NIFTY_MID_SELECT
The global market sentiment has turned negative following news that the United States cancelled its ceasefire agreement with Iran; however, any positive clarification could quickly lift the market, whereas a lack of resolution will likely keep it depressed.
The upward movement may lead the Index near 14575 – 14600 resistance range and if the index crosses and sustains above this level then may reach 14775 – 14800 range.
On the contrary, a downward moment may drag the
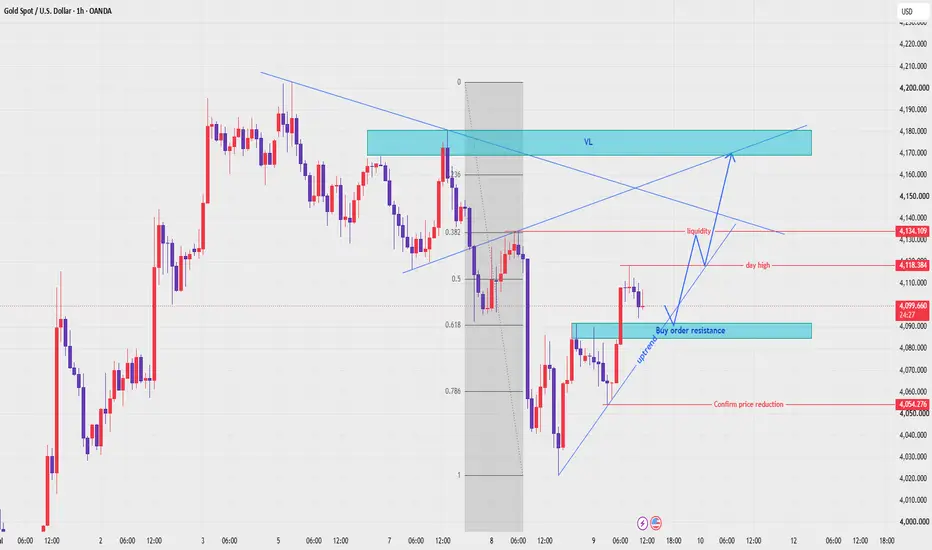
XAUUSD — Bullish Setup Holding Above Buy Zone
Fundamental Analysis
Gold is still reacting to USD momentum, Treasury yields, and upcoming U.S. data. For now, the short-term structure remains positive while buyers continue to defend the recovery trend.
Technical Analysis
On the 1H chart, XAUUSD is trading around 4,100 and holding above the rising trendline. The key buy order zone at 4,087 - 4,092 is acting as the main value area. If price holds this zone, the bullish structure can continue toward the day high at 4,118, then the liquidity a
MAXESTATE: Recovery TrendNSE:MAXESTATES
MAXESTATE continues to display an improving market structure with higher highs and higher lows while holding above its key moving averages. Buyers have defended the recent pullback, suggesting demand remains active.
Key observations:
• Bullish EMA alignment with healthy momentum (RSI above 50)
• Strong support around ₹436–442
• Immediate resistance at ₹460–470 (tested now)
• Major supply zone between ₹495–500
• A sustained breakout above ₹500 may strengthen the medium-term
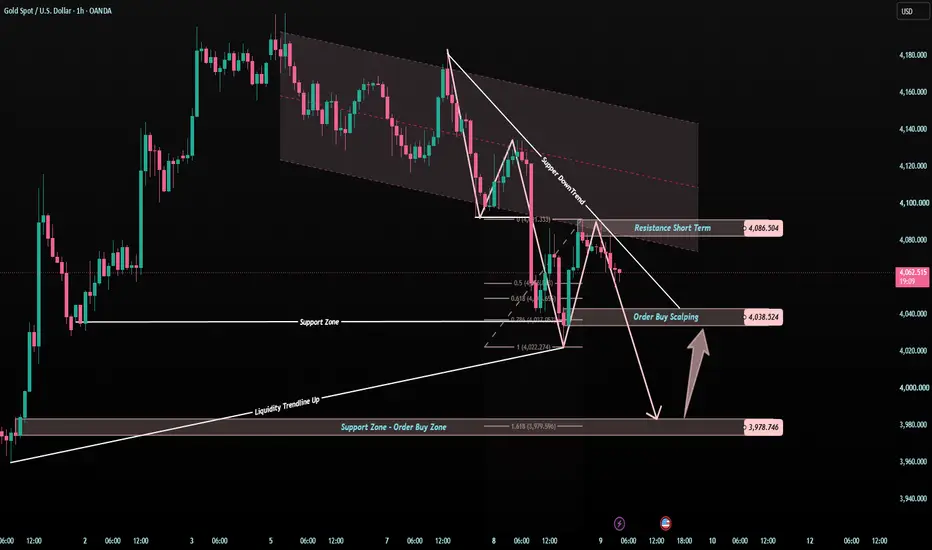
XAUUSD — Is 3,978 the Trap Zone?Gold is still under pressure, but this is exactly where the chart becomes more interesting.
Price is trading below the short-term downtrend line and has not been able to reclaim the 4,086 resistance zone.
That means sellers are still controlling the short-term structure.
But after a strong correction, the best question is not:
“Should I sell now?”
The better question is:
“Where could buyers react next?”
For me, today’s chart has two important downside zones.
The first one is 4,038.
The
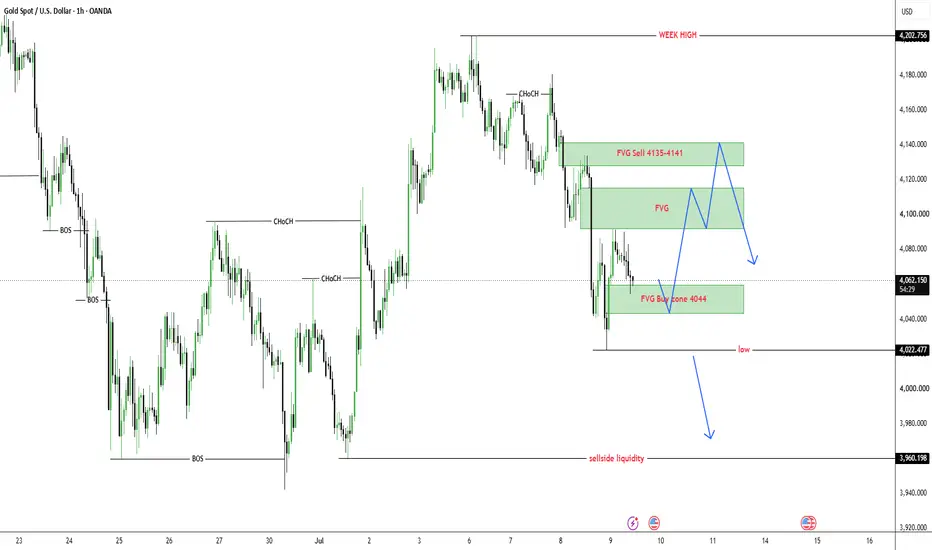
XAUUSD — Corrective Recovery After Rejecting $4,022 Low
Gold is trading around $4,062 after rejecting the lower area near $4,022. The market failed to continue the immediate downside move, so today gold may first create a corrective recovery before deciding the next larger direction.
From an SMC perspective, gold has already swept the lower liquidity near $4,022 and reacted from the FVG buy zone around $4,044–$4,060. This reaction shows that sellers may be losing short-term momentum, but the overall structure is not fully bullish yet. Price still
MASON XAUUSD – Intraday Bearish Bias Below Ichimoku
XAUUSD is trading around 4,057 after losing short-term bullish momentum. Price is now moving below the Ichimoku structure, while the recovery attempt is still weak and has not confirmed a bullish reversal.
The priority view for today remains sell with the short-term bearish structure, especially if gold retests the nearby sell zone and fails to break back above Ichimoku resistance.
Technical View
Gold is currently trading below the Ichimoku cloud and below the short-term resistance structure
MASON XAUUSD – Short-Term Sell Bias Below Ichimoku
XAUUSD is trading around 4,125 after failing to show a clear bullish continuation. Price is still under the Ichimoku resistance area, and the buying pressure looks weak around the current recovery zone.
The priority view remains sell with the short-term trend, especially if gold retests the sell order liquidity zone near the descending trendline and Fibonacci area.
Technical View
Gold is currently moving below the Ichimoku structure, which shows that buyers have not fully regained control. T
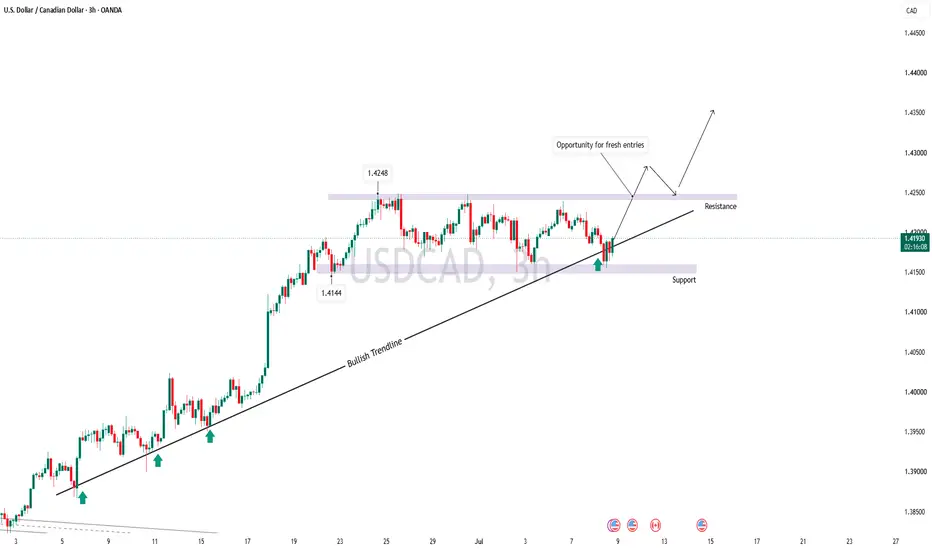
USDCAD to continues its Up-move above 1.4248?Price is forming a temporary sideways consolidating structure bounded by support at 1.4144 & resistance at 1.4248, breakout can lead to the continuation of super bullish move which was started on 1st may 2026 and has already broken 2 significant highs 1.3967 & 1.4140.
At the confluence of bullish trendline and horizontal support (1.4158) a strong bullish push is expected.
According to the price structure on higher time frames outlook for, near to midterm is bullish (Please refer to the related
Nifty Intraday Analysis for 08th July 2026NSE:NIFTY
The market is expected to open flat to lower; however, a reversal from the lower levels is anticipated.
The upward movement may lead to 24650 – 24700 resistance range and if the index crosses and sustains above this level then may reach near 24900 – 24950 range.
On the contrary, a downward moment may drag the Index to 24150 – 24100 support range in downward momentum and if this support is broken then index may tank near 23900 – 23850 range.
Banknifty Intraday Analysis for 08th July 2026NSE:BANKNIFTY
The market is expected to open flat to lower; however, a reversal from the lower levels is anticipated.
The upward moment may lead the Index to 58900 – 59000 resistance range in upward momentum and if the index crosses and sustains above this level then may reach near 59600 – 59700 range.
On the contrary, a downward moment may drag the Index to 57700 – 57600 support range in downward momentum and if this support is broken then the index may tank near the 57000 – 56900 range.
Finnifty Intraday Analysis for 08th July 2026NSE:CNXFINANCE
The market is expected to open flat to lower; however, a reversal from the lower levels is anticipated.
The upward movement may lead the Index to 27250 - 27300 resistance range and if the index crosses and sustains above this level then may reach near 27550 - 27600 range.
On the contrary, a downward moment may drag the to 26750 – 26700 support range and if this support too is broken then index may tank near 26450 – 26400 range.
Midnifty Intraday Analysis for 0 8th July 2026NSE:NIFTY_MID_SELECT
The market is expected to open flat to lower; however, a reversal from the lower levels is anticipated.
The upward movement may lead the Index near 14800 – 14825 resistance range and if the index crosses and sustains above this level then may reach 15000 – 15025 range.
On the contrary, a downward moment may drag the index to 14475 – 14450 support range and if this support is broken then index may tank near 14275 – 14250 range.
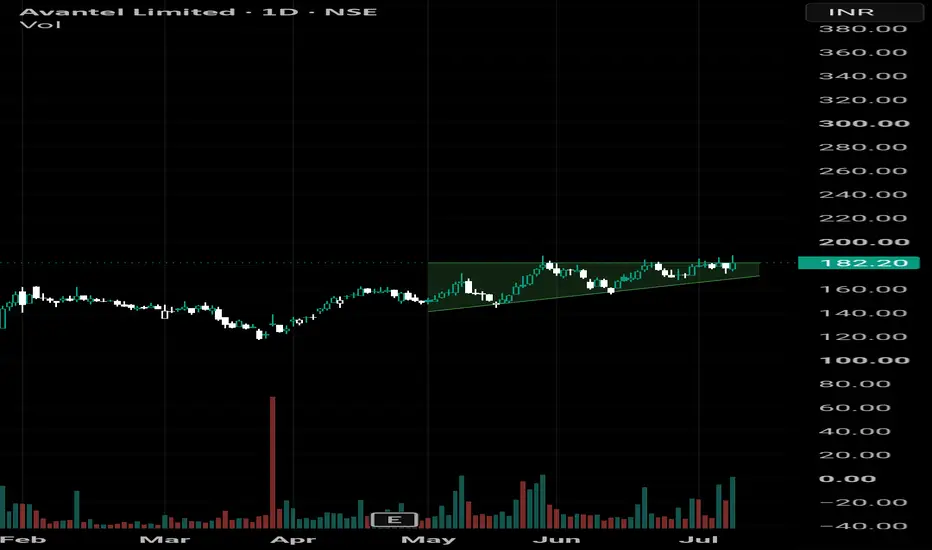
Something BIG is brewing in Avantel... Weeks of tight consolidation near the highs. Rising trendline still intact. 📈 Sellers are failing to push it lower.
⚡ A strong close above ₹185–188 with volume could trigger the next momentum move.
Smart money watches price. Retail usually notices after the breakout. 😉
Is Avantel on your watchlist? 🚀
🚨 Not SEBI registered. This is for educational purposes only, not a buy/sell recommendation.
#Avantel #Breakout #StocksToWatch
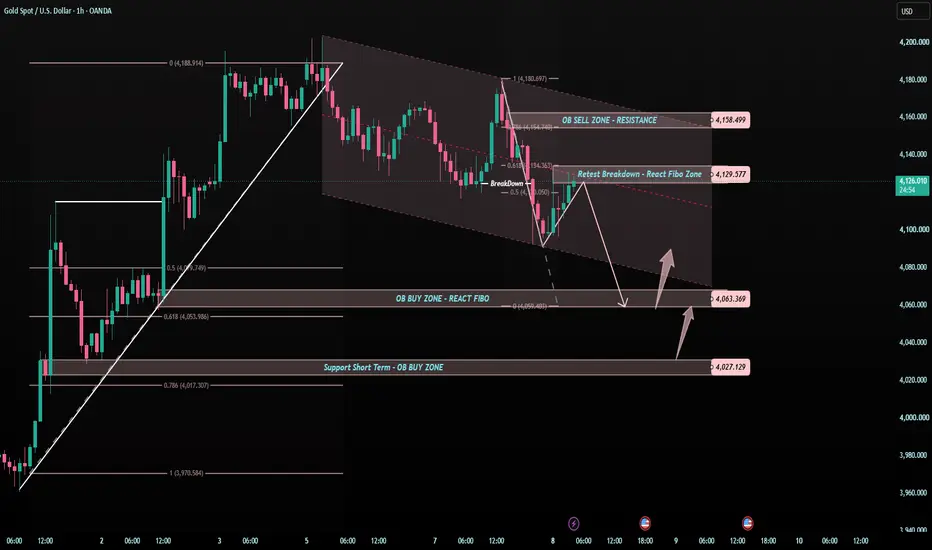
XAUUSD — Gold Tests the Breakdown ZoneGold is now trading around 4,120 - 4,130 after a sharp rejection from the previous upper structure.
Price has broken down from the short-term recovery move and is now retesting the breakdown area near 4,129.
This is an important moment.
Because gold is not at a clean buy zone yet.
It is sitting near a retest resistance area, while the stronger support zone is still lower.
THE SIMPLE READ
Gold is currently moving inside a short-term bearish correction channel.
The current reaction zone is
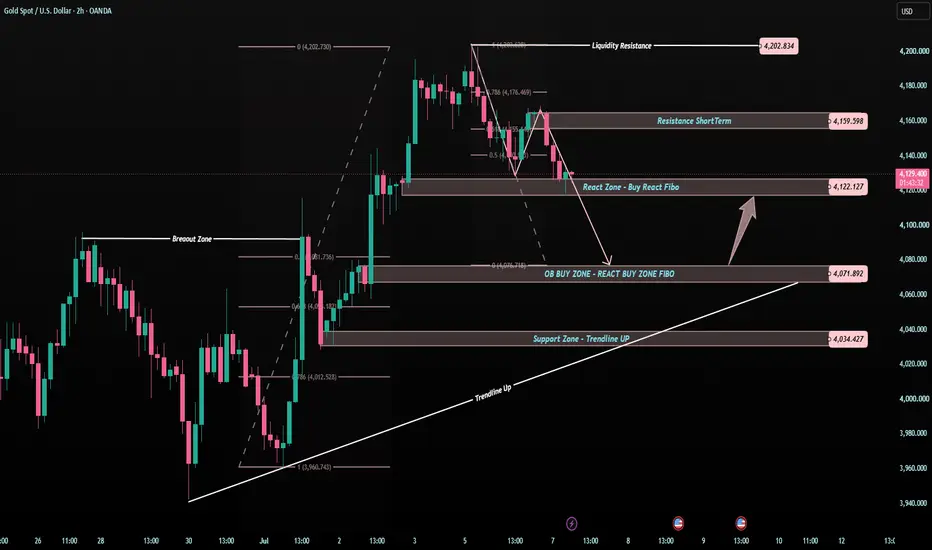
Gold Is Falling, But the Best Zone Is Still BelowGold is now showing the correction we expected after rejecting the upper liquidity area.
Price failed to stay strong above 4,159 and is now moving around the 4,122 reaction area.
But for me, this is not the most important zone yet.
The real decision area is lower.
The zone I’m watching today is 4,071.
WHY THIS MOVE MATTERS
Gold rejected from the 4,202 liquidity resistance.
Then price lost momentum below 4,159.
That tells me the short-term correction is still active.
But a correction doe
NIFTY must close itself above the supply zone for confirmation !As we can see NIFTY got rejected exactly from our supply zone. We can expect NIFTY to remain sideways to negative as long as NIFTY manages to sustain itself below the supply zone. We must wait for NIFTY to break and close itself above the supply zone for confirmation of the uptrend. So plan your trades accordingly and keep watching everyone.
USDCHF the break is over, rally to continue ?? After making the high of 0.8130 on 24th June, which was preceded by the structural shift of the price form bearish to bullish which got confirmed after the breakout of 0.8042 level, price took most required correction & has retested the strong bullish support level of 0.8011, following to which price had started to make HH & HL formation and now has reached a breakout level denoted by a horizontal neckline at 0.8074, if price breaks above it we can take fresh long entries on USDCHF.
Price is ex
XAUUSD — Bullish Structure Holding, Buy Setup Still Priority
Gold is trading around $4,128 after forming a short-term correction from the upper reaction zone. The main structure remains bullish because price is still holding above the rising trendline and the recent market structure continues to show multiple CHOCH and BOS signals to the upside.
From an SMC perspective, gold has already shifted from the previous bearish leg into a recovery structure. The current movement looks more like accumulation and correction rather than a confirmed bearish revers
Nifty Intraday Analysis for 07th July 2026NSE:NIFTY
The uptrend will likely continue, but expect volatility due to the weekly option expiry.
The upward movement may lead to 24650 – 24700 resistance range and if the index crosses and sustains above this level then may reach near 24900 – 24950 range.
On the contrary, a downward moment may drag the Index to 24200 – 24150 support range in downward momentum and if this support is broken then index may tank near 23950 – 23900 range.
Banknifty Intraday Analysis for 07th July 2026NSE:BANKNIFTY
The uptrend is expected to continue; therefore, any gap-down opening will be seen as a fresh entry opportunity.
The upward moment may lead the Index to 58900 – 59000 resistance range in upward momentum and if the index crosses and sustains above this level then may reach near 59600 – 59700 range.
On the contrary, a downward moment may drag the Index to 57700 – 57600 support range in downward momentum and if this support is broken then the index may tank near the 57000 – 56900