Nifty Intraday Analysis for 23rd June 2026NSE:NIFTY
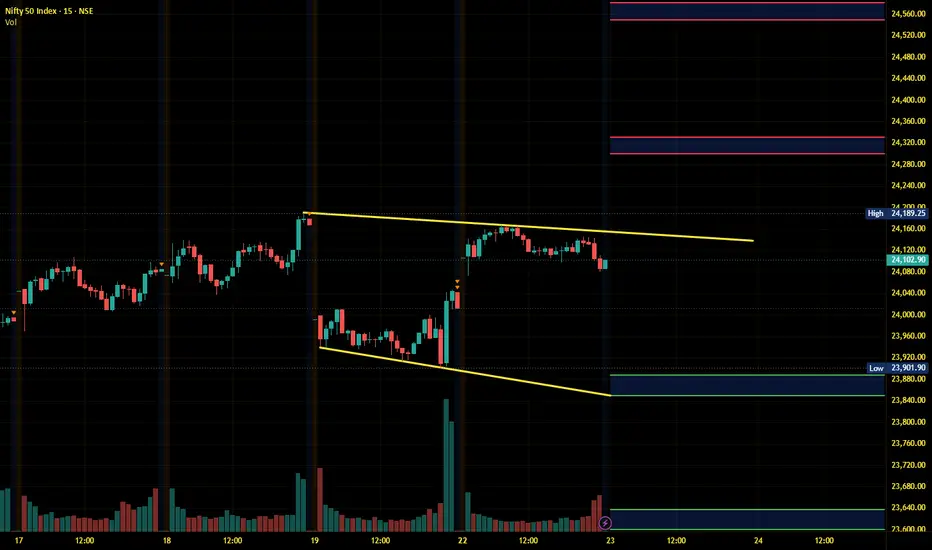
Uptrend is expected to continue, however, Highest OI is buildup which will act as major resistance on weekly Option expiry day and if the resistance is broken then -
The upward movement may lead to 24300 – 24350 resistance range and if the index crosses and sustains above this level then may reach near 24550 – 24600 range.
On the contrary, a downward moment may drag the Index to 23900 – 23850 support range in downward momentum and if this support is broken then index may tank
Trend Lines
Banknifty Intraday Analysis for 23rd June 2026NSE:BANKNIFTY
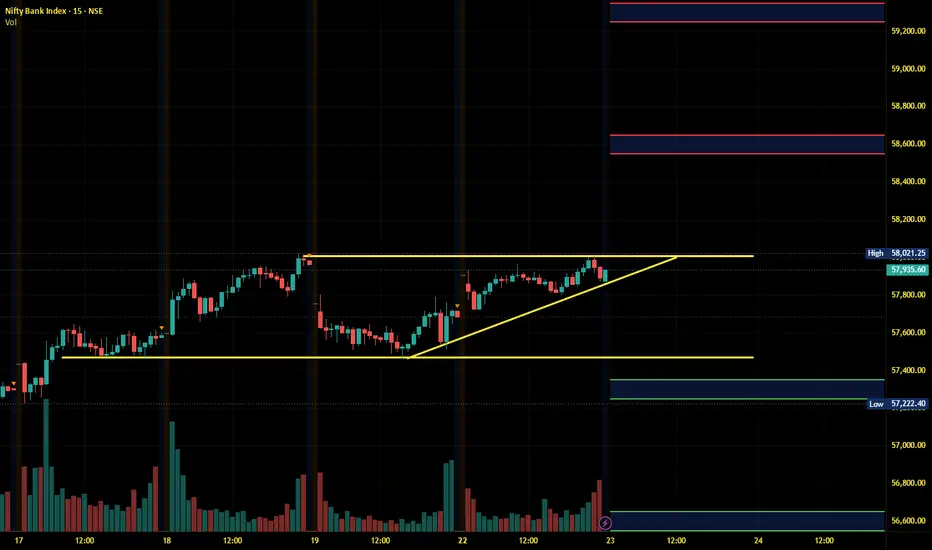
Uptrend is expected to continue, however, volatility is expected due to expiry of F&O contract on BSE on 25th June.
The upward moment may lead the Index to 58550 – 58650 resistance range in upward momentum and if the index crosses and sustains above this level then may reach near 59250 – 59350 range.
On the contrary, a downward moment may drag the Index to 57350 – 57250 support range in downward momentum and if this support is broken then the index may tank near the 56650 – 56
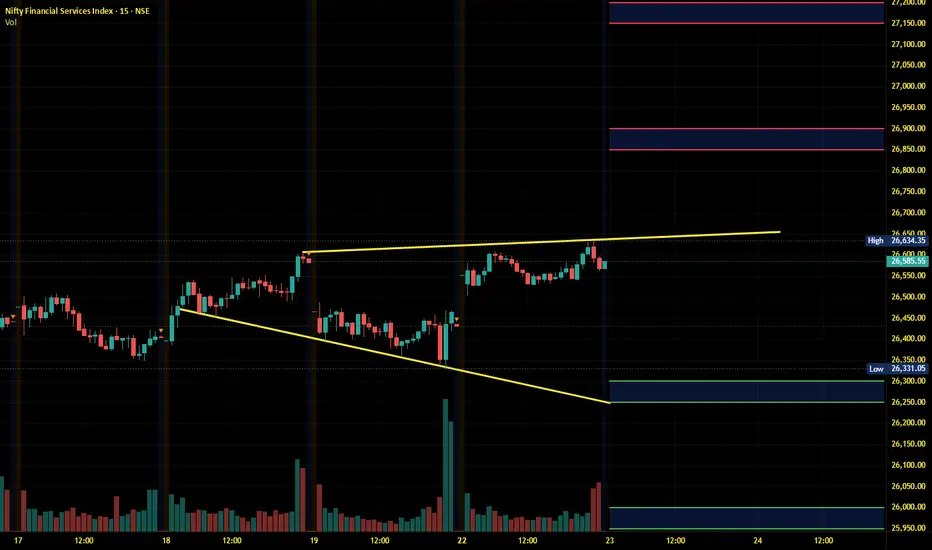
Finnifty Intraday Analysis for 23rd June 2026NSE:CNXFINANCE
Uptrend is expected to continue, however, volatility is expected due to expiry of F&O contract on BSE on 25th June.
The upward movement may lead the Index to 26850 - 26900 resistance range and if the index crosses and sustains above this level then may reach near 27150 - 27200 range.
On the contrary, a downward moment may drag the to 26300 – 26250 support range and if this support too is broken then index may tank near 26000 – 25950 range.
Midnifty Intraday Analysis for 23rd June 2026NSE:NIFTY_MID_SELECT
Uptrend is expected to continue, however, volatility is expected due to expiry of F&O contract on BSE on 25th June.
The upward movement may lead the Index near 14800 – 14825 resistance range and if the index crosses and sustains above this level then may reach 15000 – 15025 range.
On the contrary, a downward moment may drag the index to 14475 – 14450 support range and if this support is broken then index may tank near 14275 – 14250 range.
Canara Bank: Setting the Trap at Trendline Support?Canara Bank is consolidating its massive run from 78.60 to 162.89 via a clean weekly contracting triangle. The price action is compressing beautifully, resetting overbought conditions without causing structural damage to the macro uptrend.
Trade Parameters
Anticipated Entry: 125.72 (Lower trendline support / Wave e completion)
Hard Stop Loss: 119.30 (Decisive weekly close below prior resistance-turned-support)
Targets: 151.89 (Local structural resistance) and 162.89+ (Prior high / ultima
NSE KPIL Elliott Wave Analysis: Wave (3) Rally ContinuesKPIL Stock: EW Indicates Strong Bullish Trend
Kalpataru Projects International Limited ( NSE:KPIL KPIL) appears to have completed a corrective Wave (2) near the 38.2% Fibonacci retracement level and has resumed its larger uptrend. The stock has recently broken above the previous Wave (1) high around ₹1,337 , confirming renewed bullish momentum. The strong rally from the Wave (2) low suggests that a larger Wave (3) may be underway.
Next target: 1520 - 1590 - 1680 - 1895
Invali
Gold Is Bouncing, But Sellers Are Still Waiting AboveGold is starting the week inside a very interesting structure.
Price is no longer falling in one straight line, but the bigger pressure is still coming from the upper side of the chart.
The question this week is simple:
Is gold building a real recovery, or only bouncing into another sell zone?
THE SIMPLE READ
Gold is still moving inside a bearish channel structure.
The short-term bounce is trying to hold, but price is now trading below the 4,223 reaction zone. This area is important becaus
XAUUSD — EMA Downtrend Holds, Sell Position Remains Active
Fundamental Analysis
Gold remains under pressure as price continues to trade below the main EMA structure. Traders are still watching USD strength, Treasury yields, and upcoming U.S. macro data.
For now, the technical structure still favours sellers while recovery attempts are rejected from the value sell zone.
Technical Analysis
On the 1H chart, XAUUSD is trading below EMA 34, EMA 89, and EMA 200. The EMA structure is still pointing lower, showing that the short-term trend remains bearish
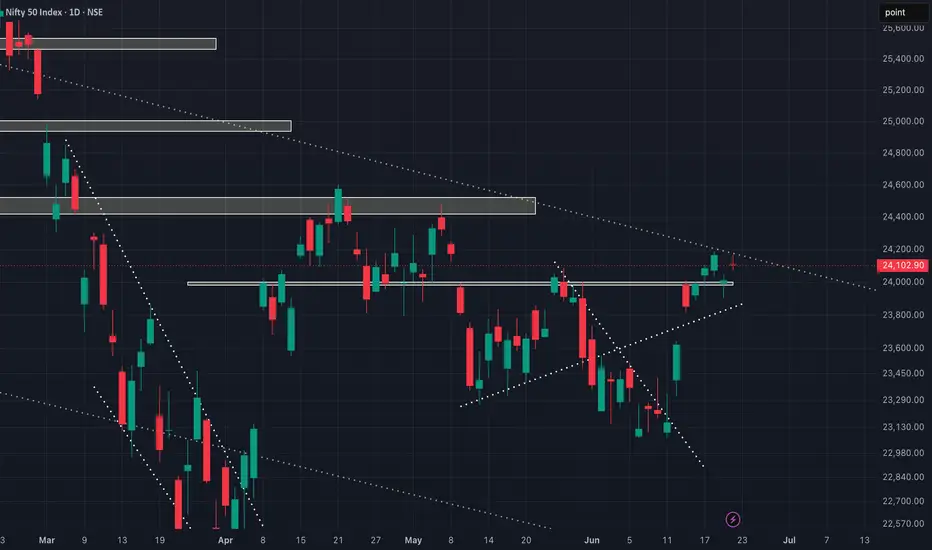
NIFTY will only turn bullish above 24200!As we can see NIFTY again got rejected around the trendline resistance. Now that the trendline has been tested multiple times, making it weaker. Hence any break above the given level can show strong upside but if maintains between the trendline and the demand zone of 24000, NIFTY could remain volatile. So, plan your trades accordingly and keep watching everyone.
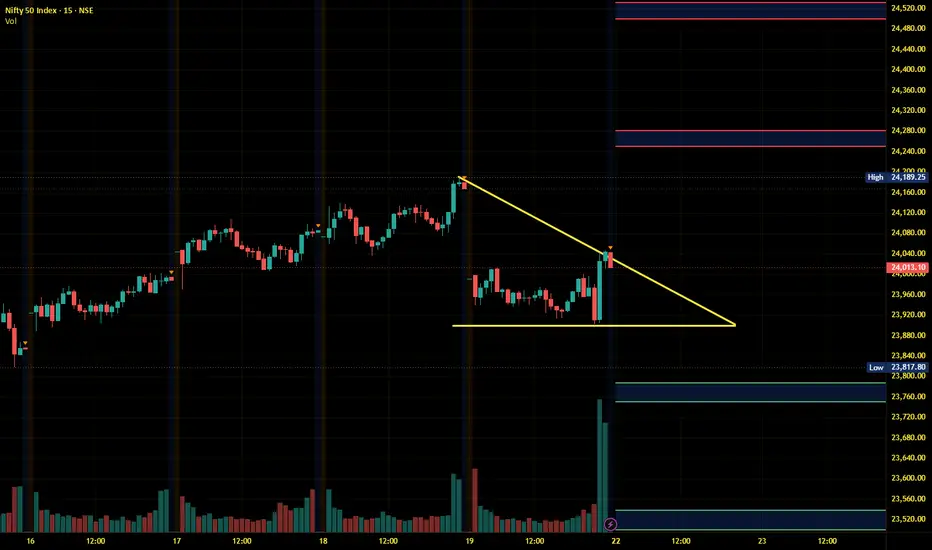
Nifty Intraday Analysis for 22nd June 2026NSE:NIFTY
Upside momentum is intact, any downfall is expected to be recovered.
The upward movement may lead to 24250 – 24300 resistance range and if the index crosses and sustains above this level then may reach near 24500 – 24050 range.
On the contrary, a downward moment may drag the Index to 23800 – 23750 support range in downward momentum and if this support is broken then index may tank near 23550 – 23500 range.
Banknifty Intraday Analysis for 22nd June 2026NSE:BANKNIFTY
Upside momentum is intact, any downfall is expected to be recovered.
The upward moment may lead the Index to 58300 – 58400 resistance range in upward momentum and if the index crosses and sustains above this level then may reach near 59000 – 59100 range.
On the contrary, a downward moment may drag the Index to 57100 – 57000 support range in downward momentum and if this support is broken then the index may tank near the 56400 – 56300 range.
Finnifty Intraday Analysis for 22nd June 2026NSE:CNXFINANCE
Upside momentum is intact, any downfall is expected to be recovered.
The upward movement may lead the Index to 26700 - 26750 resistance range and if the index crosses and sustains above this level then may reach near 27000 - 27050 range.
On the contrary, a downward moment may drag the to 26150 – 26100 support range and if this support too is broken then index may tank near 25850 – 25800 range.
Midnifty Intraday Analysis for 22nd June 2026NSE:NIFTY_MID_SELECT
Upside momentum is intact, any downfall is expected to be recovered.
The upward movement may lead the Index near 14800 – 14825 resistance range and if the index crosses and sustains above this level then may reach 15000 – 15025 range.
On the contrary, a downward moment may drag the index to 14475 – 14450 support range and if this support is broken then index may tank near 14275 – 14250 range.
NIFTY is strong as long as it is above 25000 mark!As we can see NIFTY got rejected exactly around our trendline support. Despite the rejection, it managed to close itself above 25000 mark. This closing can act as a restest to the breakout zone and hence as long as we are above 25000 psychological level, we can expect NIFTY to remain bullish. So, plan your trades accordingly and keep watching everyone.
Bharti Airtel (Weekly Chart) – Technical ViewBharti Airtel (Weekly Chart) – Technical View
The weekly chart shows a descending trendline breakout attempt after several months of correction. Price has been consolidating inside the highlighted demand zone and is now testing the falling resistance line.
Key Observations
* Downtrend line is being challenged, indicating weakening bearish momentum.
* Multiple weekly candles have respected the ₹1,746–₹1,800 support zone, suggesting accumulation.
* Current close around ₹1,910.80 is near a cruci
GBPJPY Bullish scenario resumedthe pair is not like gold which but kind of similar. GBPJPY resuming to its daily trend with the following points
Bullish points.
4H RSI divergence
Bullish closing after retracing to Daily Trendline.
Hourly Divergence.
Bearish points.
FVG at 4H right at the gold spot.
Buy Entry CMP at swings - All the week
Target 217
Indo Count Ind (W): Aggressive BullishTimeframe: Weekly | Scale: Logarithmic
Overall View: 🐂 Aggressive Bullish (FTA & Earnings-Led Breakout)
Indo Count Industries has shattered a major multi-year angular resistance with climax volume. The breakout is of the highest quality because it is backed by an immediate macro catalyst (the UK FTA) and strong operational guidance, shifting the stock firmly into a markup phase.
🚀 1. The Fundamental Catalysts (The "Why")
The technical explosion is fully justified by recent developments:
CDSL: Breakout or Hidden Momentum Trap?The Macro View
Looking at the weekly chart in image_2b16c2.jpg , CDSL is moving through a multi-month consolidation phase. A single descending trendline tracks the major peaks, showing that overhead selling pressure keeps capping the price into a clean sequence of lower highs.
The Indicator Movement
While the price stays contained below this line, the momentum indicator at the bottom is rising quickly. It is currently approaching its own descending trendline with much more speed than the pr
Transformers & Rectifiers (India) Ltd. – Weekly Chart ReviewA successful retest of ₹343.70 followed by buying interest could trigger the next leg higher toward ₹385.70. Sustained momentum above ₹385.70 may open the path toward ₹425 and eventually ₹467.
However, a weekly close back below ₹343.70 would weaken the breakout structure and could lead to consolidation near the rising trendline.
TradingView Post Draft
Transformers & Rectifiers (India) Ltd. | Weekly Breakout Setup
The stock has broken out from an ascending triangle/accumulation structure on t