HOW-TO: Trade Crude Oil Using Support & Resistance LevelsThis educational tutorial explains how support and resistance (S/R) levels are used to trade crude oil futures. S/R levels are one of the most reliable tools for oil trading because they provide exact price points for entries, exits, and stop-loss placement .
Markets: MCX Crude Oil, WTI, Brent
Timeframe: 15-minute to daily
Part 1: Why S/R Works for Crude Oil
Crude oil is highly volatile and sensitive to geopolitical events and OPEC+ decisions . This volatility creates strong reactions at key
Trend Lines
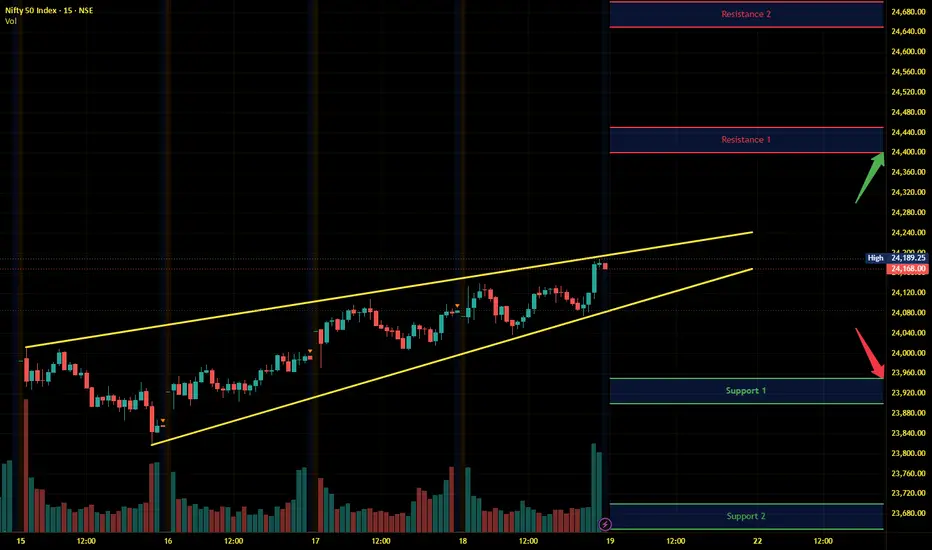
Nifty Intraday Analysis for 19th June 2026NSE:NIFTY
Overall momentum is positive, however, profit booking from top is expected.
The upward movement may lead to 24400 – 24450 resistance range and if the index crosses and sustains above this level then may reach near 24650 – 24700 range.
On the contrary, a downward moment may drag the Index to 23950 – 23900 support range in downward momentum and if this support is broken then index may tank near 23700 – 23650 range.
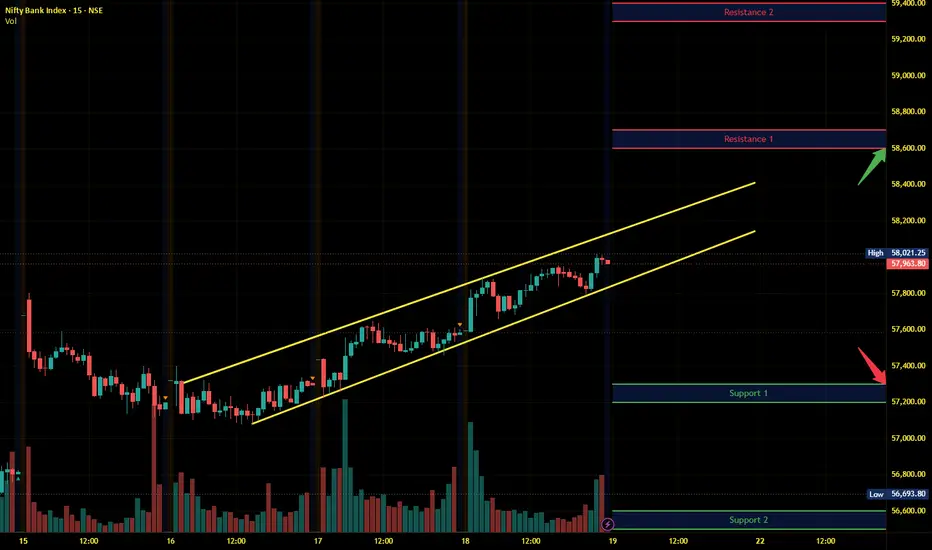
Banknifty Intraday Analysis for 19th June 2026NSE:BANKNIFTY
Index is overbought and profit booking is expected from the top.
A downward moment may drag the Index to 57300 – 57200 support range in downward momentum and if this support is broken then the index may tank near the 56600 – 56500 range.
On the contrary, the upward moment may lead the Index to 58600 – 58700 resistance range in upward momentum and if the index crosses and sustains above this level then may reach near 59300 – 59400 range.
Finnifty Intraday Analysis for 19th June 2026NSE:CNXFINANCE
Overall momentum is positive, however, profit booking from top is expected.
The upward movement may lead the Index to 26850 - 26900 resistance range and if the index crosses and sustains above this level then may reach near 27150 - 27200 range.
On the contrary, a downward moment may drag the to 26300 – 26250 support range and if this support too is broken then index may tank near 26000 – 25950 range.
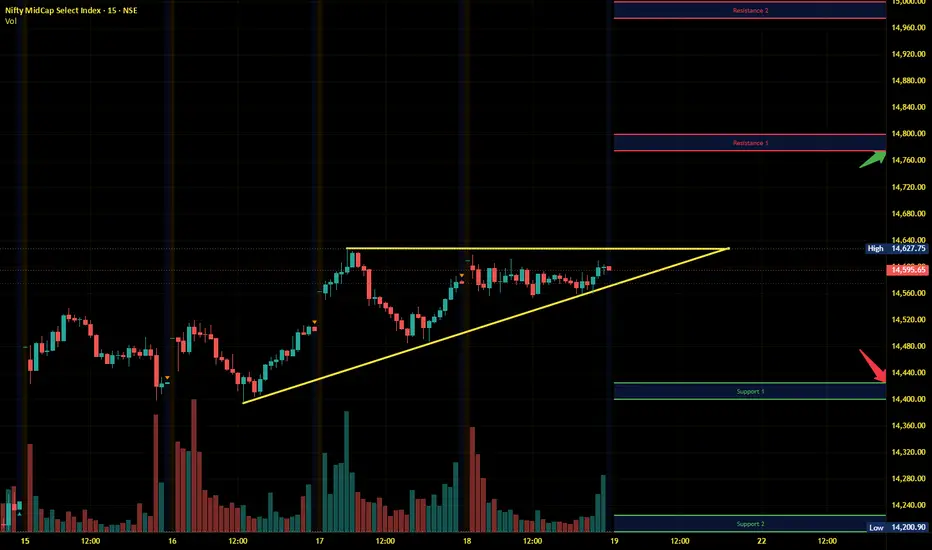
Midnifty Intraday Analysis for 19th June 2026NSE:NIFTY_MID_SELECT
Overall momentum is positive and the index is near 14550 - 14525 support.
The upward movement may lead the Index near 14775 – 14800 resistance range and if the index crosses and sustains above this level then may reach 149750 – 15000 range.
On the contrary, a downward moment may drag the index to 14425 – 14400 support range and if this support is broken then index may tank near 14225 – 14200 range.
XAUUSD Is Gold Preparing Another Trap Before the Next Big Move ?Gold is sitting at a very sensitive area again — right between a short-term reaction zone and a bigger bearish trendline pressure.
THE SIMPLE READ
Gold is still trading under the main descending trendline.
That means buyers may create short-term bounces, but the bigger structure has not fully turned bullish yet.
Right now, price is reacting near the 4,138 area. This is marked as a short-term reaction zone, so a small bounce from here would not be surprising.
But the important question is no
We need closing above the trendline to confirms bullishness.As we can see NIFTY continued its upmove exactly as analysed in our previous post. Now that it is nearing the trendline resistance, we may see NIFTY getting rejected from here. We could only confirm further bullishness to occur if NIFTY manages to close itself above the trendline. Till then, NIFTY could remain sideways, volatile to negative in coming trading sessions. So plan your trades accordingly and keep watching everyone.
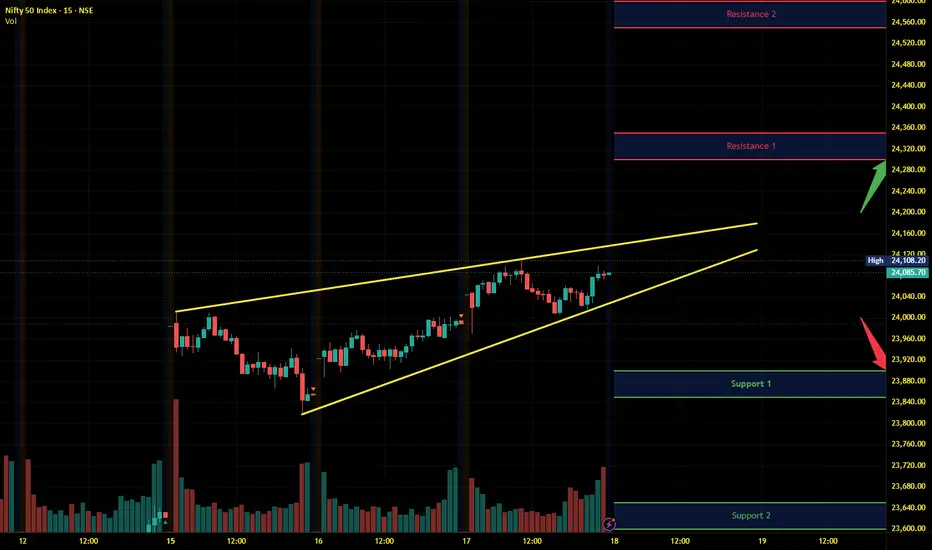
Nifty Intraday Analysis for 18th June 2026NSE:NIFTY
The global equity market will react to the outcome of the US FOMC meeting concluding tonight. While an interest rate cut is expected to boost market sentiment, a rate hike would likely trigger a negative reaction. Further, the US FED Chief Kevin Warsh’s first commentary on its economic forecasts will be crucial for guiding future investor expectations.
The upward movement may lead to 24300 – 24350 resistance range and if the index crosses and sustains above this level then may r
Banknifty Intraday Analysis for 18th June 2026NSE:BANKNIFTY
The global equity market will react to the outcome of the US FOMC meeting concluding tonight. While an interest rate cut is expected to boost market sentiment, a rate hike would likely trigger a negative reaction. Further, the US FED Chief Kevin Warsh’s first commentary on its economic forecasts will be crucial for guiding future investor expectations.
The upward moment may lead the Index to 58200 – 58300 resistance range in upward momentum and if the index crosses and sustai
Finnifty Intraday Analysis for 18th June 2026 NSE:CNXFINANCE
The global equity market will react to the outcome of the US FOMC meeting concluding tonight. While an interest rate cut is expected to boost market sentiment, a rate hike would likely trigger a negative reaction. Further, the US FED Chief Kevin Warsh’s first commentary on its economic forecasts will be crucial for guiding future investor expectations.
The upward movement may lead the Index to 26700 - 26750 resistance range and if the index crosses and sustains above this le
Midnifty Intraday Analysis for 18th June 2026NSE:NIFTY_MID_SELECT
The global equity market will react to the outcome of the US FOMC meeting concluding tonight. While an interest rate cut is expected to boost market sentiment, a rate hike would likely trigger a negative reaction. Further, the US FED Chief Kevin Warsh’s first commentary on its economic forecasts will be crucial for guiding future investor expectations.
The upward movement may lead the Index near 14750 – 14775 resistance range and if the index crosses and sustains abov
Gold Is Getting Squeezed Before the Next MoveGold is moving inside a tight triangle, and this is the moment where patience matters more than prediction.
THE SIMPLE READ
Gold is not giving a clean direction yet.
Price is being pressed down by the upper trendline, while buyers are still trying to protect the lower trendline. This means the market is slowly getting squeezed.
When gold moves like this, many traders try to guess the breakout too early.
But the cleaner plan is simple: wait for one side to break clearly, then watch how price
Axis bank...In the daily time frame, the price is forming a bullish W pattern. In the lower time frame(30 minutes), the price has given a trendline breakout.
Buy above 1360 with the stop loss of 1346 for the targets 1374, 1382, 1396. The price may face resistance at the 1390 - 1400 zone as the W pattern completes at 1394. It can pull back here before moving up.
Sustaining the 1400 zone can give a good movement as it can give the W pattern breakout target levels.
Always do your analysis before taking any tra
HOW-TO: Range-Based Option Selling Strategy Using DTE LevelsThis tutorial explains how to sell options profitably when the market is trading in a range. Using DTE Range levels (2 lines above Base, 2 lines below Base), you can identify optimal strike selection, entry timing, and risk management rules for option selling.
Markets: Nifty, BankNifty, and any liquid instrument with weekly/monthly expiry
Timeframe: 5-minute, 15-minute, or 1-hour charts
Part 1: Understanding the Range-Based Setup
Markets spend most of their time in ranges and only a fraction
BUY TODAY SELL TOMORROW for 5%DON’T HAVE TIME TO MANAGE YOUR TRADES?
- Take BTST trades at 3:25 pm every day
- Try to exit by taking 4-7% profit of each trade
- SL can also be maintained as closing below the low of the breakout candle
Now, why do I prefer BTST over swing trades? The primary reason is that I have observed that 90% of the stocks give most of the movement in just 1-2 days and the rest of the time they either consolidate or fall
Resistance Breakout in GOLDIAM
BUY TODAY SELL TOMORROW for 5%
EURUSD — EMA Bearish Trend, Sell From Value Zone
Fundamental Analysis
EURUSD remains under pressure as the market continues to watch USD momentum, Fed expectations, and upcoming U.S. macro data. If the dollar stays supported, recovery attempts on EURUSD may remain limited.
For next week, the main focus is whether price can retest the value zone above before continuing lower in line with the EMA trend.
Technical Analysis
On the 4H chart, EURUSD is still trading inside a descending channel. EMA 34, EMA 89, and EMA 200 remain above price, sh
NIFTY might get rejected soon.As we can see NIFTY despite the break couldnt show a unidirectional rally but now that it has managed to close itself above the neckline then we may see a continuation of bullishness but could be shortlived as the trendline resistance is very close which is around 24200. Hence, until and unless NIFTY manages to close itself above that level, it is likely to remain sideways to negative so plan your trades accordingly and keep watching everyone.
Nifty Intraday Analysis for 17th June 2026NSE:NIFTY
Overall market sentiment remains positive as a consensus emerges regarding the signing of the US-Iran deal. However, profit-taking is expected at higher levels ahead of Wednesday night's US FOMC meeting outcome, the first under new Chairman Kevin Warsh.
The upward movement may lead to 24200 – 24250 resistance range and if the index crosses and sustains above this level then may reach near 24450 – 24500 range.
On the contrary, a downward moment may drag the Index to 23800 – 237
Banknifty Intraday Analysis for 17th June 2026NSE:BANKNIFTY
Overall market sentiment remains positive as a consensus emerges regarding the signing of the US-Iran deal. However, profit-taking is expected at higher levels ahead of Wednesday night's US FOMC meeting outcome, the first under new Chairman Kevin Warsh.
The upward moment may lead the Index to 58000 – 58100 resistance range in upward momentum and if the index crosses and sustains above this level then may reach near 58800 – 58900 range.
On the contrary, a downward moment may d
Finnifty Intraday Analysis for 17th June 2026 NSE:CNXFINANCE
Overall market sentiment remains positive as a consensus emerges regarding the signing of the US-Iran deal. However, profit-taking is expected at higher levels ahead of Wednesday night's US FOMC meeting outcome, the first under new Chairman Kevin Warsh.
The upward movement may lead the Index to 26700 - 26750 resistance range and if the index crosses and sustains above this level then may reach near 27000 - 27050 range.
On the contrary, a downward moment may drag the to 262
Midnifty Intraday Analysis for 17th June 2026NSE:NIFTY_MID_SELECT
Overall market sentiment remains positive as a consensus emerges regarding the signing of the US-Iran deal. However, profit-taking is expected at higher levels ahead of Wednesday night's US FOMC meeting outcome, the first under new Chairman Kevin Warsh.
The upward movement may lead the Index near 14675 – 14700 resistance range and if the index crosses and sustains above this level then may reach 14875 – 14900 range.
On the contrary, a downward moment may drag the inde
HOW-TO: Trade Gold & Silver with Auto Support/Resistance Levels This tutorial shows how to trade MCX Gold futures using auto-generated support/resistance levels. Current gold setup with clear entry, stop-loss, and target levels.
Markets: MCX Gold/silver Futures (or any commodity)
Timeframe: 15-minute chart
Understanding Auto Support/Resistance Indicator
The Auto S/R indicator generates key levels across multiple timeframes:
Intraday levels for day trading
Weekly levels for swing trades
Monthly levels for position trading
Why this helps: No need to man