XAUUSD — Strong Trend, But 4,305 Can DecideGold is still holding a strong bullish structure, but price is now entering an important decision area.
After the clean recovery from the lower buy zones, buyers pushed gold higher and brought price close to the 4,305 short-term resistance.
This is where I do not want to chase.
A strong trend can continue, but every strong trend still needs a clean support reaction or breakout confirmation.
The simple read
Gold is currently trading around 4,280 - 4,290.
The first major test is 4,305.
If b
Trend Lines
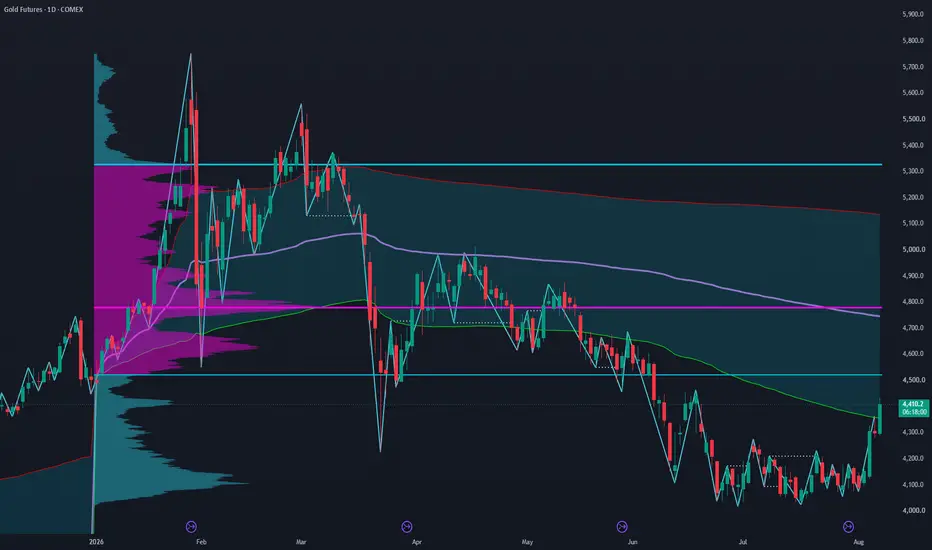
Gold Futures (GC): Daily Structure Suggests a Bottom Is In
Gold futures have spent the last several weeks carving out what looks like a genuine change of character on the daily chart, and price action over the last few sessions has confirmed it. Here's the structural read and what I'm watching next.
Market structure shift
Since the swing high in the 5,300–5,600 area earlier this year, GC has been in a clean sequence of lower highs and lower lows, with the decline accelerating into the 4,000–4,100 zone in July. That's where the character started to ch
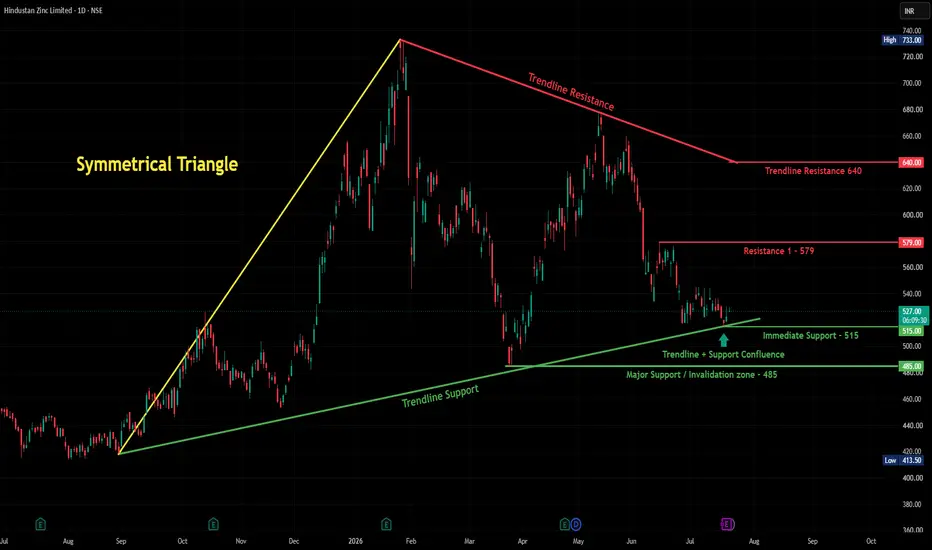
Hindustan Zinc - Squeezed Between Trendline Support & ResistanceOverview
Hindustan Zinc is trading in a tightening zone right now — a rising trendline support from below is meeting resistance levels from above, and price is currently sitting right at the middle of this squeeze around 527.
What's Happening
The stock had a big rally from around 420 last year up to a high of 733, then pulled back hard. Since then, it's been finding support along a rising trendline (currently near 500-515), while facing resistance from a falling trendline coming down from the
Nifty Intraday Analysis for 07th August 2026NSE:NIFTY
The index is range bound in the 24600 - 24700 zone and a big move is expected on that side of the zone which is broken.
The upward movement may lead to 24850 – 24900 resistance range and if the index crosses and sustains above this level then may reach near 25100 – 25150 range.
On the contrary, The downward moment may drag the Index to 24350 – 24300 support range in downward momentum and if this support is broken then index may tank near 24100 – 24050 range.
Banknifty Intraday Analysis for 07th August 2026NSE:BANKNIFTY
Highest Call and Put OI is built up at 58000 strike which will act as make of break level.
The upward moment may lead the Index to 58800 – 58900 resistance range in upward momentum and if the index crosses and sustains above this level then may reach near 59500 – 59600 range.
On the contrary, The downward moment may drag the Index to 57300 – 57200 support range in downward momentum and if this support is broken then the index may tank near the 56600 – 56500 range.
Finnifty Intraday Analysis for 07th August 2026NSE:CNXFINANCE
Uptend is expected to continue as long as the Index is above 26700.
The upward movement may lead the Index to 27100 - 27150 resistance range and if the index crosses and sustains above this level then may reach near 27400 - 27450 range.
On the contrary, The downward moment may drag the to 26600 – 26550 support range and if this support too is broken then index may tank near 26300 – 26250 range.
Midnifty Intraday Analysis for 07th August 2026NSE:NIFTY_MID_SELECT
The Index has support near 14775 - 14750 range and it is broken then downward moment expected in the short term.
The upward movement may lead the Index near 14975 – 15000 resistance range and if the index crosses and sustains above this level then may reach 15150 – 15175 range.
On the contrary, The downward moment may drag the index to 14650 – 14625 support range and if this support is broken then index may tank near 14475 – 14450 range.
XAUUSD — 4,253 Holds or 4,182 Retest?Gold is still moving inside a strong bullish structure, but the short-term momentum is starting to cool down after testing the 4,305 resistance area.
The rally was very strong.
But after a vertical move, I do not want to chase the top.
I want to see where buyers defend the trend.
The simple read
Gold is now trading around 4,250 - 4,260.
The first important support is 4,253.
This is the React Zone / Buy Scalping area on the chart.
If buyers can defend 4,253, gold may try to recover again
GULPOLY: Multi-Year Trendline BreakoutOverview & Market Structure
Gulshan Polyols Limited ( NSE:GULPOLY ) has completed a multi-year accumulation structure between ₹120 and ₹140. Price has cleared the long-term descending resistance trendline on the weekly timeframe along with the 200-week EMA (₹177.36) on expanded volume.
Order Flow & Delta Confirmation
CVD Expansion: Daily Cumulative Volume Delta (CVD) shifted heavily positive (+920K to +1.04M), confirming aggressive buying at the ask.
POI Retest: The current dip into
Bull Run Pause or Trend Reversal? Nifty Near Key Moving AveragesWhat I'm Seeing
Imagine a person who has been running fast for a long distance. After some time, they need to slow down, catch their breath, and regain energy before deciding whether to continue running.
I think Nifty is doing something similar right now.
After a strong rally of around 5%, Nifty has started slowing down. Instead of moving higher quickly, the market seems to be taking a small break before its next big move.
Why It Matters
I am watching two popular moving averages:
200
BEL Bearish biasLooking forward on a bearish outlook on Bharat Electronics Stock.
Technically the stock is at a key resistance area and the company ‘s stock is trading at approximately 12.2 times its book value. Adding to this, the company has high debtors of 170 days.
Personally not taking this setup but if a key area is to be looked out for, it would be this one.
Kwality Walls cmp 35 Daily Chart since listedKwality Walls cmp 35 Daily Chart since listed
- Support Zone 27.50 to 32.50 Price Band
- Resistance Zone 35 to ATH 39.45 Price Band
- Rounding Bottoms by Resistance Zone neckline
- Price breakout been attempted from Resistance Zone
- Falling Resistance Trendline Breakout seen well sustained
- Volumes spiking intermittently heavily over the past few days
XAUUSD GOLD ANALYSIS ON (06 AUG 2026)#XAUUSD UPDATEDE
SELL LIMITED - 4300-4318
If price stay below 4355, then next target 4260,4200 and 4150,4100 and above that 4400
Plan;If price break 4300-4318 area,and stay below 4310,we will place sell order in gold with target of 4260,4200 and 4150,4100 & stop loss should be placed at 4355
NIFTY DAILY / Short Range Level Analysis for 07th AUG 2026🔕 SGMN SplD BULLISH Above => 24686
🔕 SGMN SplD Bearish BELOW => 24589
Mentioned analysis based on 2 consecutive candle close in 15 min Time Frame.
━━━━━🟥🟧🟨🟩🟦🟪⬛━━━━━
💥Level Interpretation / description:
✍🏻L#1: If the candle crossed & stays above the “Buy Gen”, it is treated / considered as Bullish bias. Cfm=> Confirmation.
L#2: Possibility / Probability of REVERSAL near 🔕RL/TF1 & 🔔RL/TF2
L#3: If the candle stays above “Sell Gen” but below “Buy Gen”, it is treated / considered as Sidew
We are back consolidating! As we can see NIFTY had been weak but still above our demand zone showing strength! Hence as long as we are above the demand zone! Every dip can be bought! Following the consolidation, we may see NIFTY preparing for next upmove. So, plan your trades accordingly and keep watching these important levels.
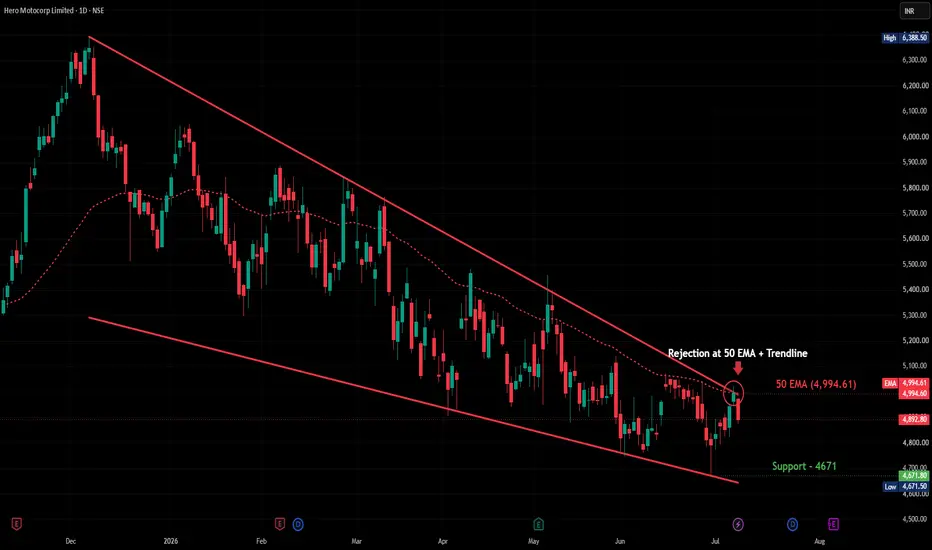
HEROMOTOCO — Falling Wedge Resistance Holds at the 50 EMAOverview
Hero MotoCorp attempted to break above its falling wedge resistance today, touching a high of 4,975 before reversing sharply to close down 2.05% at 4,892.80. Notably, this rejection occurred right at the 50 EMA (4,994.61), which has been tracking closely with the wedge's upper boundary — a double layer of resistance that proved difficult to clear on the first attempt.
Pattern Explanation
The stock has been compressing inside a falling wedge since the December high of 6,388.50, with the
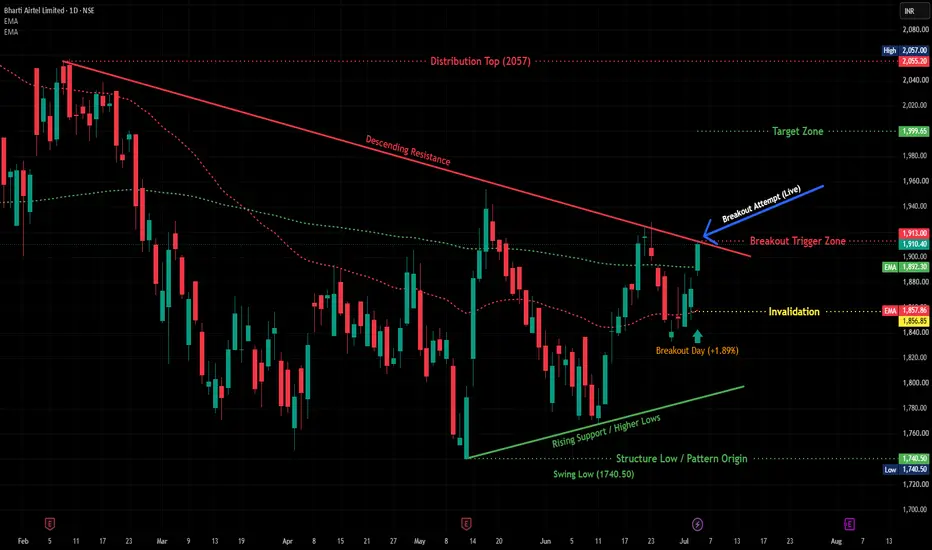
BHARTIARTL — Descending Triangle Testing Breakout on Daily ChartOverview
Bharti Airtel has spent the last five months carving out a textbook descending triangle on the daily chart, and today's session is where it starts getting interesting. Price rallied 1.89% off a strong base, pushing right into the resistance line that's been capping every rally since February. If this holds, we could be looking at the start of a fresh leg higher after months of range-bound grinding.
Pattern Explanation
The structure here is clean: a descending resistance line connecting
Nifty Intraday Analysis for 06th August 2026NSE:NIFTY
24600 is becoming immediate resistance and uptrend only possible if the index decisively sustains above 26600 level.
The upward movement may lead to 24850 – 24900 resistance range and if the index crosses and sustains above this level then may reach near 25100 – 25150 range.
On the contrary, The downward moment may drag the Index to 24350 – 24300 support range in downward momentum and if this support is broken then index may tank near 24100 – 24050 range.
Banknifty Intraday Analysis for 06th August 2026NSE:BANKNIFTY
58000 is becoming immediate resistance and uptrend only possible if index breaks and sustains above 58000 level.
The upward moment may lead the Index to 58500 – 58600 resistance range in upward momentum and if the index crosses and sustains above this level then may reach near 59200 – 59300 range.
On the contrary, The downward moment may drag the Index to 57200 – 56900 support range in downward momentum and if this support is broken then the index may tank near the 56300 – 56
Finnifty Intraday Analysis for 06th August 2026NSE:CNXFINANCE
27000 is becoming immediate resistance and uptrend only possible if index breaks and sustains above 27000 level.
The upward movement may lead the Index to 27100 - 27150 resistance range and if the index crosses and sustains above this level then may reach near 27400 - 27450 range.
On the contrary, The downward moment may drag the to 26600 – 26550 support range and if this support too is broken then index may tank near 26300 – 26250 range.
Midnifty Intraday Analysis for 06th August 2026NSE:NIFTY_MID_SELECT
The immediate support is shifted upward to 14800 level and uptrend is expected to continue as long as the Index is above 14800.
The upward movement may lead the Index near 15025 – 15050 resistance range and if the index crosses and sustains above this level then may reach 15200 – 15225 range.
On the contrary, The downward moment may drag the index to 14725 – 14700 support range and if this support is broken then index may tank near 14550 – 14525 range.
Markolines Pavement cmp 181.50 Daily Chart since listedMarkolines Pavement cmp 181.50 Daily Chart since listed
Support Zone 160 to 176 Price Band
- Resistance Zone 182 to ATH 191.75 Price Band
- Long Rounding Bottom + Small Rounding Bottoms
- Closely Considerate VCP pattern seems to be made
- Price breakout been attempted from Resistance Zone
- Falling Resistance Trendline Breakout seen well sustained
- Volumes needed for breakout through the Resistance Zone