Nifty Intraday Analysis for 03rd June 2026NSE:NIFTY
The market is negative due to escalations in the West Asia conflict which resulted in a jump in crude prices. Upside momentum is capped until resolution of the West Asia conflict and fall in crude prices.
A downward moment may drag the Index to 23250 – 23200 support range in downward momentum and if this support is broken then index may tank near 22975 – 22925 range.
On the contrary, any upward movement may lead to 23700 – 23750 resistance range and if the index crosses and susta
Trend Lines
Banknifty Intraday Analysis for 03rd June 2026NSE:BANKNIFTY
The market is negative due to escalations in the West Asia conflict which resulted in a jump in crude prices. Upside momentum is capped until resolution of the West Asia conflict and fall in crude prices.
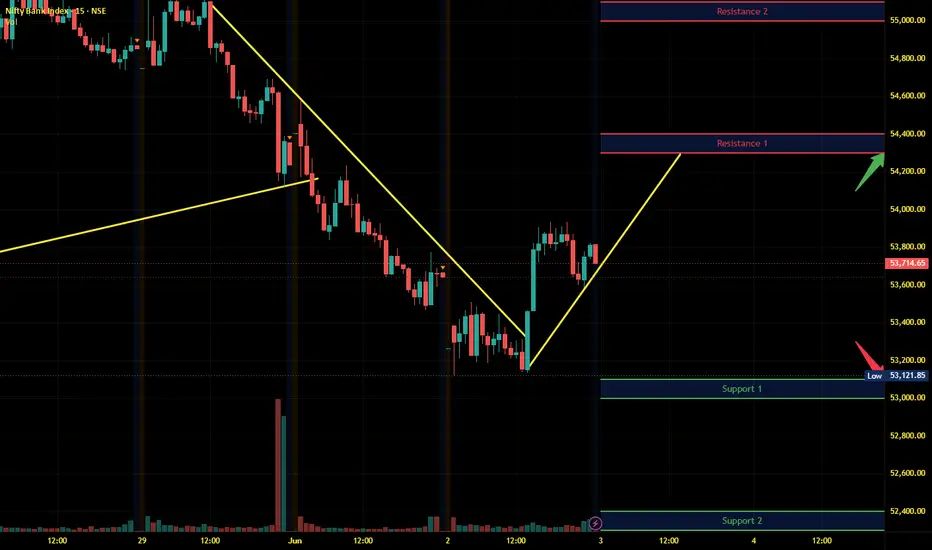
A downward moment may drag the Index to 53100 – 53000 support range in downward momentum and if this support is broken then the index may tank near the 52400 – 52300 range.
On the contrary, any upward moment may lead the Index to 54300 – 54400 resistance range in upward momen
Finnifty Intraday Analysis for 03rd June 2026 NSE:CNXFINANCE
The market is negative due to escalations in the West Asia conflict which resulted in a jump in crude prices. Upside momentum is capped until resolution of the West Asia conflict and fall in crude prices.
A downward moment may drag the to 24550 – 24500 support range and if this support too is broken then index may tank near 24200 – 24150 range.
On the contrary, any upward movement may lead the Index to 25150 - 25200 resistance range and if the index crosses and sustains abov
Midnifty Intraday Analysis for 03rd June 2026NSE:NIFTY_MID_SELECT
The market is negative due to escalations in the West Asia conflict which resulted in a jump in crude prices. Upside momentum is capped until resolution of the West Asia conflict and fall in crude prices.
A downward moment may drag the index to 14100 – 14075 support range and if this support is broken then index may tank near 13925 – 13900 range.
On the contrary, any upward movement may lead the Index near 14450 – 14475 resistance range and if the index crosses and sus
Skipper Ltd - Double Bottom PatternSkipper Ltd is heading for a 50% jump. The factors are:
Technical:
1. Double Bottom Pattern and that too on a weekly time frame
2. Last week's candle is quite bullish with rising volumes
Fundamental:
1. With India's growth / modernisation of Power Sector, Skipper has lot of opportunities.
2. Best 2026 year - Revenue, Profits were best ever
3. Exports are rising
4. Capacity expansion
These factors will lead the price upwards. Keep following @Cleaneasycharts
Cheers!!
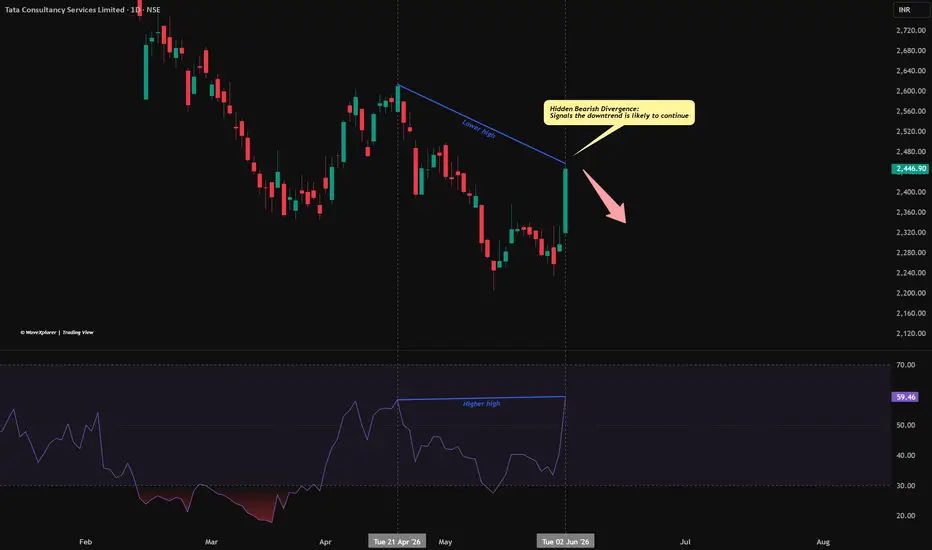
TCS(1D): Understanding the Disagreement Between Price and RSIThe recent sharp jump in Tata Consultancy Services (TCS) has certainly caught a lot of eyes. On the surface, that large green candle looks very strong. But if we dig a bit deeper into the relationship between price and momentum, there is an interesting technical puzzle on the daily chart as shown in chart.
Let’s break down what the chart is showing without any bias:
The Price vs. Indicator Clash
If you look at the blue lines on the chart connecting the mid-April peaks to the current June pea
Aye Finance – Fresh IPO Momentum BreakoutNSE:AYE
Aye Finance has shown a strong breakout from its recent consolidation zone with a sharp price move and strong volume participation. The stock closed near ₹164 with around 10% gain, supported by a visible liquidity rush and elevated relative volume.
Momentum indicators are improving. RSI is in bullish territory, MACD is turning positive with histogram expansion, and relative strength is also improving. Price is trading above key short-term moving averages, indicating trend continuation
Billionbrains Garage Ventures: Post-Breakout Consolidation Near NSE:GROWW
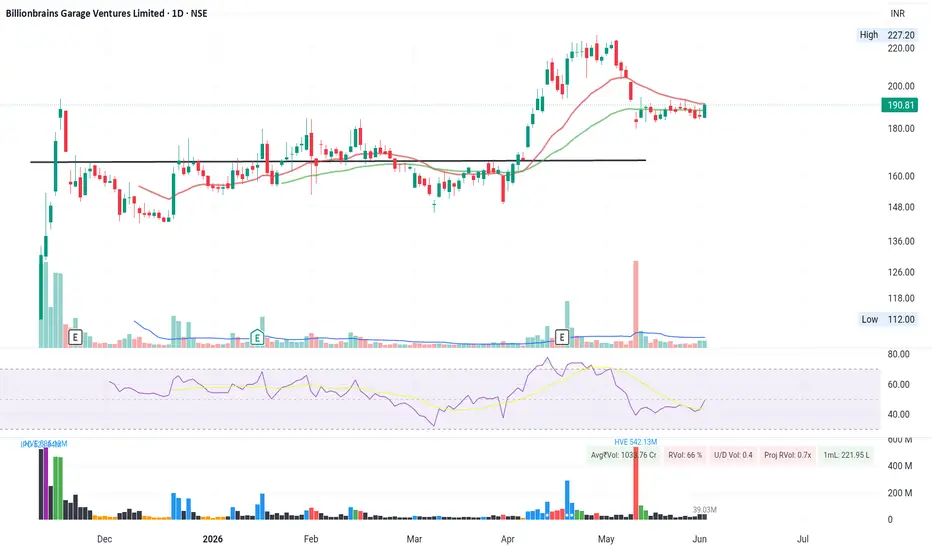
Billionbrains Garage Ventures Ltd — Daily Chart Observation
Billionbrains Garage Ventures had a strong breakout move from the ₹160–₹165 base zone and rallied sharply toward the ₹220+ area. After the breakout, the stock has corrected and is now consolidating around ₹185–₹195.
Current observations:
Price is holding near the short-term moving average zone and has shown a bounce from the recent consolidation area. RSI is recovering from the lower range, indicating early momentum i
Nifty Intraday Analysis for 02nd June 2026NSE:NIFTY
The market is negative due to escalations in the West Asia conflict which resulted in a jump in crude prices. Upside momentum is capped until resolution of the West Asia conflict and fall in crude prices.
A downward moment may drag the Index to 23150 – 23100 support range in downward momentum and if this support is broken then index may tank near 22875 – 22825 range.
On the contrary, any upward movement may lead to 23600 – 23650 resistance range and if the index crosses and susta
Banknifty Intraday Analysis for 02nd June 2026NSE:BANKNIFTY
The market is negative due to escalations in the West Asia conflict which resulted in a jump in crude prices. Upside momentum is capped until resolution of the West Asia conflict and fall in crude prices.
A downward moment may drag the Index to 52950 – 52850 support range in downward momentum and if this support is broken then the index may tank near the 52150 – 52050 range.
On the contrary, any upward moment may lead the Index to 54350 – 54450 resistance range in upward momen
Finnifty Intraday Analysis for 02nd June 2026 NSE:CNXFINANCE
The market is negative due to escalations in the West Asia conflict which resulted in a jump in crude prices. Upside momentum is capped until resolution of the West Asia conflict and fall in crude prices.
A downward moment may drag the to 24700 – 24650 support range and if this support too is broken then index may tank near 24350 – 24300 range.
On the contrary, any upward movement may lead the Index to 25300 - 25350 resistance range and if index crosses and sustains above th
Midnifty Intraday Analysis for 02nd June 2026NSE:NIFTY_MID_SELECT
The market is negative due to escalations in the West Asia conflict which resulted in a jump in crude prices. Upside momentum is capped until resolution of the West Asia conflict and fall in crude prices.
A downward moment may drag the index to 14100 – 14075 support range and if this support is broken then index may tank near 13925 – 13900 range.
On the contrary, any upward movement may lead the Index near 14450 – 14475 resistance range and if the index crosses and sus
NIFTY50 Weekly Expiry Setup | Key Technical Levels to WatchNIFTY50 Analysis
NIFTY50 continues to trade below a descending trendline, reflecting a weak short-term market structure. Price is currently positioned near the Break Down zone around 23,277, while the Buy Reversal level near 23,405 remains an important reference area on the chart.
The recent price action highlights continued pressure below key intraday levels, with market participants closely monitoring reactions around nearby support and resistance zones.
Key Levels:
• Resistance : 23,4
NIFTY might show more of weakness from here As we can see NIFTY has closed below the trendline which makes NIFTY even weaker. Hence as long nifty manages to stay below the level, we can expect nifty to remain even weaker, because NIFTY can now act as a resistance. So until and unless we see closing above the trendline, ever rise can be shorted for bigger targets. So plan your trades accordingly and keep watching everyone.
Rounding Bottom & Trendline BreakoutUniversal Cables Looks like a good candidate for a good upswing
Rounding bottom in weekly timeframe along with a weekly downwards trendline breakout above 800 levels should give a good breakout for
Target1 = 942
Targer2 - 1180
Cable industry has been in the recent news as some giants are looking to invest in the next couple of years
Looks like a multibagger but please do your fundamental analysis
Nifty Intraday Analysis for 01st June 2026NSE:NIFTY
The market is expected flat to lower opening due to fresh escalations in the West Asia conflict; however, the finalisation of a US-Iran deal could lift market sentiment at any time.
Upward movement may lead to 23275 – 23825 resistance range and if the index crosses and sustains above this level then may reach near 24050 – 24100 range.
On the contrary, the index may drag to 23325 – 23275 support range in downward momentum and if this support is broken then index may tank near 23
Banknifty Intraday Analysis for 01st June 2026NSE:BANKNIFTY
The market is expected flat to lower opening due to fresh escalations in the West Asia conflict; however, the finalisation of a US-Iran deal could lift market sentiment at any time.
Any upward moment may lead the Index to 54950 – 55050 resistance range in upward momentum and if the index crosses and sustains above this level then may reach near 55750 – 55850 range.
On the contrary, Index may drag to 53550 – 53450 support range in downward momentum and if this support is broken
Finnifty Intraday Analysis for 01st June 2026 NSE:CNXFINANCE
The market is expected flat to lower opening due to fresh escalations in the West Asia conflict; however, the finalisation of a US-Iran deal could lift market sentiment at any time.
Upward movement may lead the Index to 25600 - 25650 resistance range and if index crosses and sustains above this level then may reach near 25900 - 25950 range which seems unlikely.
On the contrary, any downward moment, Index may drag to 25100 – 25050 support range and if this support too is bro
Midnifty Intraday Analysis for 01st June 2026NSE:NIFTY_MID_SELECT
The market is expected flat to lower opening due to fresh escalations in the West Asia conflict; however, the finalisation of a US-Iran deal could lift market sentiment at any time.
Upward movement may lead the Index near 14625 – 14650 resistance range and if the index crosses and sustains above this level then may reach 14800 – 14825 range.
On the contrary, a downward moment may drag the index to 14325 – 14300 support range and if this support is broken then index ma
$SPY How you an trade the top. AMEX:SPY SPY Technical Analysis: Multi-Day Upward Channel
The SPY is maintaining a clean, well-defined ascending (upward) channel that has guided price action over the last several trading sessions. The market is respecting both parallel boundaries of this structure, providing clear, high-probability structural levels to build a game plan around.
* Channel Resistance (Upper Boundary): Currently capping upside momentum near the $758 – $760 zone.
* Channel Support (Lower Boundary): Acting as a c
Will not short unless NIFTY breaches 23470As we can see NIFTY fell sharply in last 30 minutes largely due to MSCI rebalancing. Now we can see NIFTY trading at an important trendline support. So unless NIFTY beaches below 23450 level, it should not be shorted as we can expect NIFTY for some short covering subject to opening of Hormuz and us-Iran agreement. So plan your trades accordingly and keep watching everyone.
NIFTY Monthly/Weekly updateNIFTY has traded in the tight range of 23260-24480, closing 1.8% lower compared to April, during May. Unless there are some positive developments wrt ongoing US-Iran War, we can expect market to trade in the tight range with a negative bias because of Oil prices. RBI MPC outcome scheduled on June 5 and GDP release data on June 7 can act as a near term triggers for the market.
30 Weekly EMA (~24400) has been acting as a resistance level since April, and I expect it to be the same in the coming