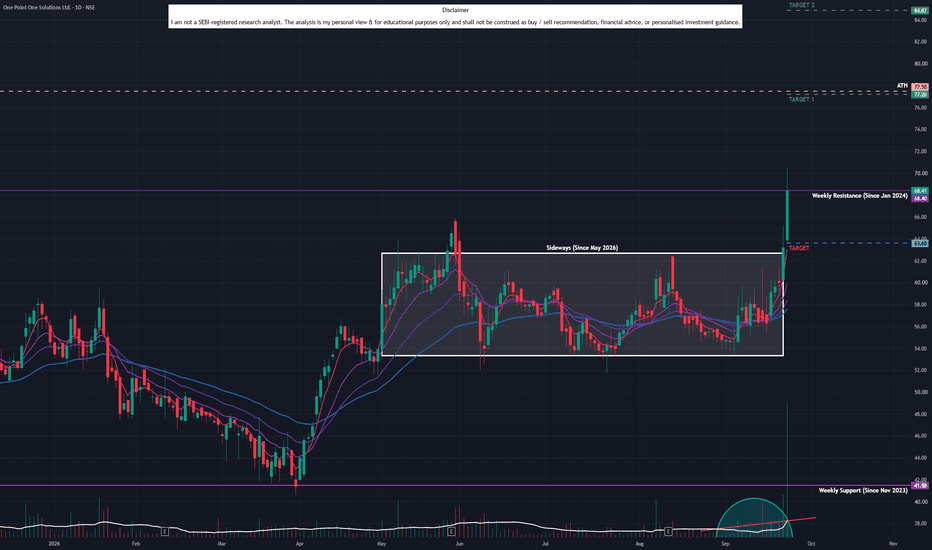
One Point One Solutions (D): RESISTANCE TEST & BREAKOUTTimeframe: Daily | Chart Scale: Linear
Explosive +8.24% surge today backed by a massive 21.83M volume spike! 🔥
Technical Highlights:
✅ Trend Breakout: Broke out of a sideways consolidation (since May '26) yesterday, with strong confirmation today!
⚠️ Resistance Test: Pushing directly into long-term horizontal resistance (active since Jan '24).
✅ Volume: Rising volume trend shows aggressive buyer accumulation.
✅ Momentum: Short-term EMAs in positive crossover (Daily/Weekly/Mont
Trend Lines
Sensex - Expiry day analysis Sep 24The price has formed a symmetrical triangle; it can give movement in any direction. Nearby resistance is at 75000. The price has to sustain above it to move up.
Buy above 75060 with the stop loss of 74880 for the targets 75180, 75320, 75460, 75620 and 75780.
Sell below 74720 with the stop loss of 74900 for the targets 74580, 74420, 74260, 74100 and 73940.
As per the daily chart, the price is forming inside bars, and resistance is at the 75400 zone.
The expected expiry day range is 74400 to 7540
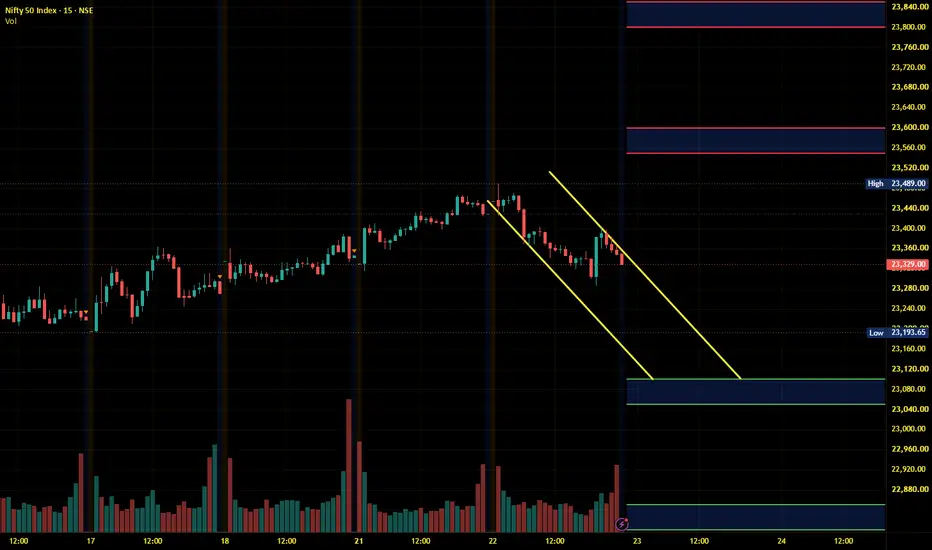
Nifty Intraday Analysis for 23rd September 2026NSE:NIFTY
The index is above 23300 - 23250 support range and reversal is expected if the index sustains above support range in downtrend and uptrend will be formed when index sustains above 23500 level.
The upward movement may lead to 23550 – 23600 resistance range and if the index crosses and sustains above this level then may reach near 23800 – 23850 range.
On the contrary, The downward moment may drag the Index to 23100 – 23050 support range in downward momentum and if this support i
Banknifty Intraday Analysis for 23rd September 2026NSE:BANKNIFTY
The index is above 56000 support and reversal is expected if the index sustains above 56000 in downtrend.
The upward moment may lead the Index to 56900 – 57000 resistance range in upward momentum and if the index crosses and sustains above this level then may reach near 57600 – 57700 range.
On the contrary, The downward moment may drag the Index to 55500 – 55400 support range in downward momentum and if this support is broken then the index may tank near the 54800 – 54700 ra
Finnifty Intraday Analysis for 23rd September 2026NSE:CNXFINANCE
The index is above 25300 support and reversal is expected if the index sustains above 25300 in downtrend.
The upward movement may lead the Index to 25675 - 25725 resistance range and if the index crosses and sustains above this level then may reach near 26000 - 26050 range.
On the contrary, The downward moment may drag the to 25150 – 25100 support range and if this support too is broken then index may tank near 24850 – 24800 range.
Midnifty Intraday Analysis for 23rd September 2026NSE:NIFTY_MID_SELECT
The index is above 14500 and as long as the index is above 14500, the uptrend is expected to continue with momentum when index sustains above 14600.
The upward movement may lead the Index near 14700 – 14725 resistance range and if the index crosses and sustains above this level then may reach 14875 – 14900 range.
On the contrary, The downward moment may drag the index to 14400 – 14375 support range and if this support is broken then index may tank near 14225 – 14200
MEESHO Symmetrical Triangle Breakout with Volume ConfirmationAnalysis: The price action has been steadily consolidating within a symmetrical triangle, characterized by a descending resistance line and an ascending support line.
The most recent weekly candle indicates a definitive bullish breakout above the upper trendline.
A robust analysis requires at least two supporting technical reasons; this setup is validated by both the structural trendline breakout and the surge in trading volume visible at the bottom of the chart, signaling strong market partic
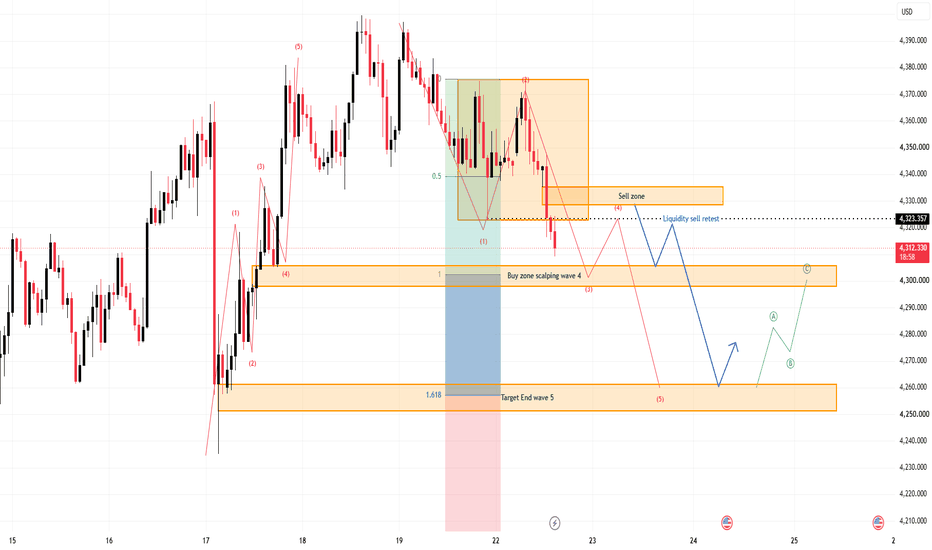
XAUUSD — Wave 5 Lower Toward 4,250
From Kelly’s view, gold remains inside a short-term bearish structure after rejecting from the 4,370 area. Price is now trading around 4,313, below the key liquidity retest level at 4,323, while the current decline continues to respect the projected Elliott Wave sequence.
The key idea is simple: the broader downside structure may remain active while price stays below the 4,325–4,335 sell zone, with Wave (5) potentially extending toward the 4,250–4,260 target area.
⟡ Market structure
Gold has
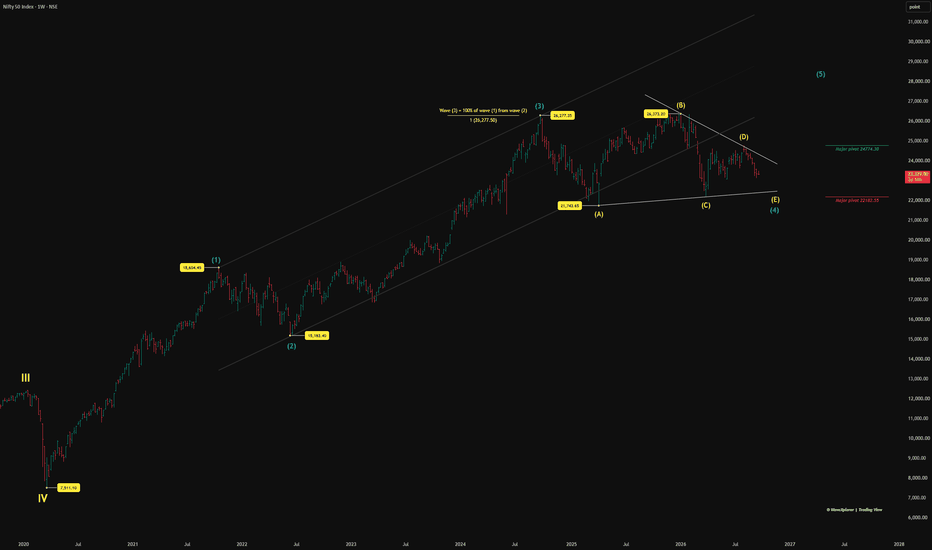
Nifty's Identity Crisis: Triangle? Flat? Already Done?Same chart, same swing points, three honest ways to read what wave (4) is doing. Rather than force one, here's all three, plus the two levels that'll settle it for us.
Chart 1 — The Patient Version (the one visible on the main analysis post)
A contracting triangle, still working through its final E-leg. (A)-(B)-(C)-(D) are already in place — one more sideways leg before wave (5) can even begin. Slow and choppy, but the destination doesn't change.
Chart 2 — The Flat Version
Same pivots, di
Nifty levels for 23rd Sept (start of new series)Nifty projections are shown on the chart
23365 will be the level to watch
if it sustains above 23365 during the morning session then most probably it may reach 23455 by 12 noon as per the uptrendline drawn, if it remains strong then it may even reach 23529 to 23570 during the day
However any weakness in 23365 region may take it down to 23272
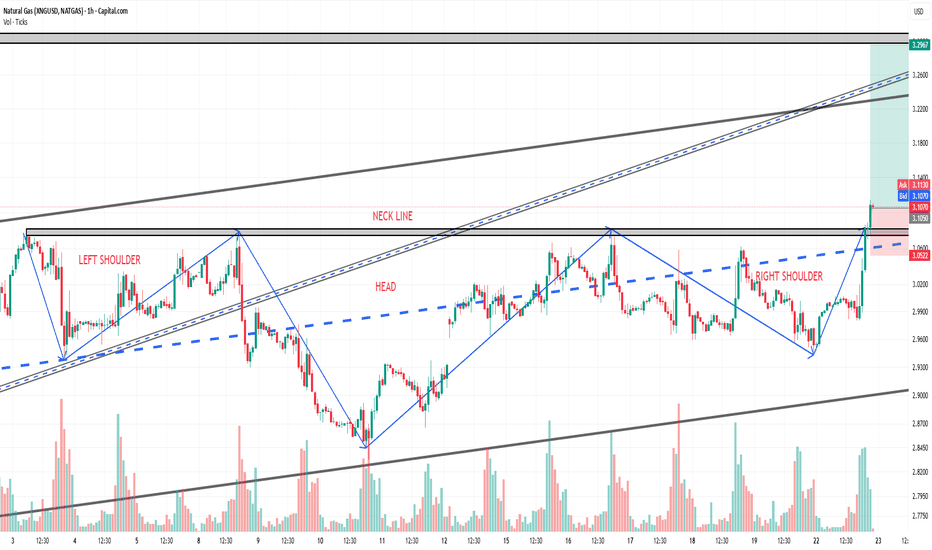
Natural Gas (NATGAS/XNGUSD) – 1H Chart | Inverse Head & ShoulderNatural Gas (NATGAS/XNGUSD) – 1H Chart | Inverse Head & Shoulders Breakout
Instrument: Natural Gas (XNGUSD) — Capital.com
Timeframe: 1 Hour
Date: Sep 22, 2026, 22:30 UTC+5:30
CMP: $3.1085
Pattern Identified: Inverse (Bullish) Head & Shoulders
A textbook Inverse Head and Shoulders reversal pattern has formed on the 1H chart, signaling a potential trend reversal from the recent downtrend to the upside.
Structure Level Notes
Left Shoulder ~2.955 Formed early Sep 3–4, followed by a
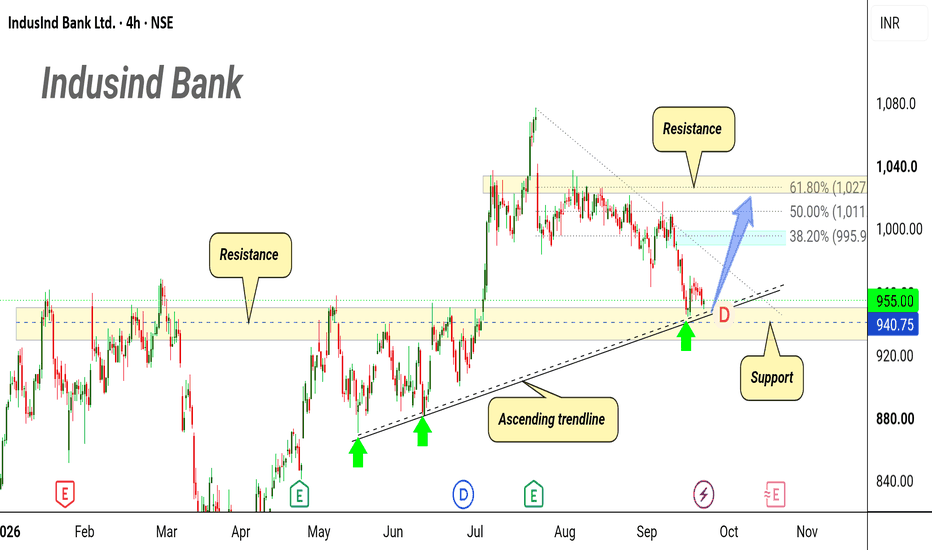
INDUSIND BANK – Ascending Support Bounce & Potential Long SetupTechnical Analysis
Timeframe & Chart Type: 4-Hour (4h) Bar Chart on NSE.
Current Price Action: The stock is trading around ₹955.00, sitting at a confluence support level.
PNG
Support Confluence:
Ascending Trendline: An ascending trendline formed since May/June is providing dynamic support, marked by multiple successful tests (green arrows).
Horizontal Support Zone: The yellow highlighted band around ₹940.75 – ₹955.00 previously acted as a key resistance area throughout Q1/Q2 and is now fu
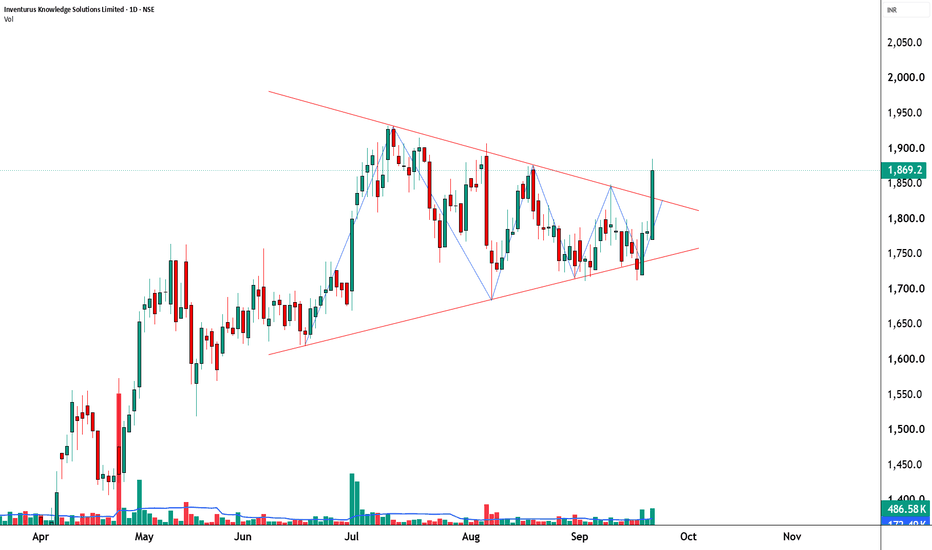
IKS Symmetrical Triangle Breakout with Strong Volume🔥 Inventurus Knowledge Solutions: Symmetrical Triangle Breakout with Strong Volume
📊 MARKET STRUCTURE SNAPSHOT | NSE: IKS | DAILY
Closing Price: 1,869.20
Core Trend: Developing Bullish Structure
Market State: Bullish Expansion / Breakout
Chart Pattern: Symmetrical Triangle — Bullish Breakout
Candlestick Pattern: Strong Bullish Candle
Price Structure: Price had been forming a clear series of lower highs and higher lows inside a contracting symmetrical triangle. The latest session has produced a
Engineers India (D): ATH BREAKOUT & CAUTIONTimeframe: Daily | Chart Scale: Linear
Gap-up +6.06% surge today backed by a massive 23.54M volume spike to hit a new ATH of 303.90! 🔥
Technical Highlights:
✅ Breakout: Cleared & closed above short-term angular resistance (Apr '26).
⚠️ Resistance Rejection: Broke above long-term horizontal resistance (Jul '24) intraday but failed to hold the close.
⚠️ MONTHLY CAUTION: Double-Top pattern forming on the monthly chart with MACD & RSI bearish divergence! 📉
Key Levels to Watch:
AGI GREENPAC LIMITED (AGI) — FALLING WEDGE BREAKOUT | 4H | NSENSE:AGI has been trading inside a well-defined descending/falling wedge since the December 2024 swing high near ₹1,307.90, with lower highs and lower lows compressing into a narrowing range — a classic bullish reversal structure.
Key observations:
Price recently broke out above the upper trendline of the wedge near the ₹748 breakout zone, closing at ₹752.60 (+1.20%).
The breakout is accompanied by a shift in structure, with price reclaiming the descending resistance line that had capped ral
XAUUSD — Wave 5 Lower Toward 4,280
From Kelly’s view, gold is still trading inside a broader bearish structure. Price is currently around 4,352, while the recent rebound remains below the previous lower-high area near 4,380–4,395.
The key idea is simple: the current move may be completing a corrective Wave (4) around resistance, while the main structure still favors another bearish leg toward 4,320, 4,305, and potentially the 4,280 Wave (5) target zone.
⟡ Market structure
Gold continues to show a sequence of lower highs after
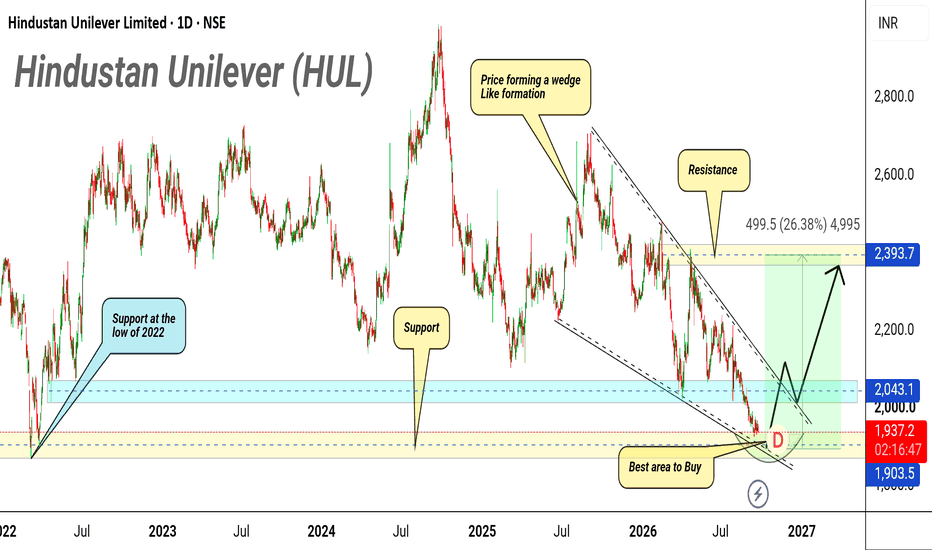
Hindustan Unilever : Classic Wedge & Multi-Year Support reversalHindustan Unilever Limited (HUL) Daily Chart: Classic Wedge Breakout & Multi-Year Support Reversal
Technical Analysis
The daily chart shows Hindustan Unilever Limited (HUL) consolidating near a major horizontal demand zone around ₹1,900–₹2,040.
The price has previously formed a strong long-term foundation at the "Support at the low of 2022" in the ₹1,900 range.
A clear descending wedge/channel formation is visible from early 2026, indicating a prolonged correction that is now approaching ex
NZDJPY Strong Bearish Momentum Turned OnThe JPY is showing increasing strength, while NZDJPY currently looks like one of the weakest pairs in the Forex market.
The daily chart has finally broken down from the long-standing accumulation box, confirming a bearish structure. Ideally, we would wait for a retracement back into the broken support before entering.
However, the 1H timeframe is already giving us another opportunity.
The price is breaking down from a Reversal Flag, with a projected target that aligns closely with the measure
EURNZD Bullish Scenario in PlayNZD is weak for almost 2-3 weeks now. It is now getting a good replacement with opportunity to sell it on strength.
We have EURNZD pair selected for our bull case. The ride is long enough. Though our target is smaller than the target set on 4H for Flag pattern but we assume that it will hit the flag target.
We will take a limit order position right above 4H FVG formed at 2.00174.
I will place two Buy Limit orders at the same entry level:
Once TP1 is hit, I will move the SL of the remaini
Nifty - Expiry day analysis Sep 22As per the daily chart, the price is still forming an inside bar. On the 15th, we got a trending bearish move. The high that formed on the 15th can act as resistance.
On a lower time frame, we can see the price is moving along with the ascending channel's lower trend line.
Buy above 23420 with a stop-loss of 23360 for the targets 23460, 23500, 23560 and 23620.
Sell below 23300 with a stop loss of 23360 for the targets 23260, 23200, 23160 and 23120.
The expected expiry day range is 23200 to 2360
XAU/USD - Trapped Falling Channel, Bears Take ControlOANDA:XAUUSD remains inside a clear downward channel after breaking its previous rising trendline. The latest rebound is now running into the 4,325–4,421 sell zone, while price is still struggling around the Ichimoku cloud.
As long as Gold stays below the upper channel resistance and fails to reclaim 4,421, I favor another bearish leg toward:
🎯 Target: 4,155
Macro Market: the Fed’s recent rate hike is still a headwind for Gold, and US Treasury yields are rising again as markets price fu