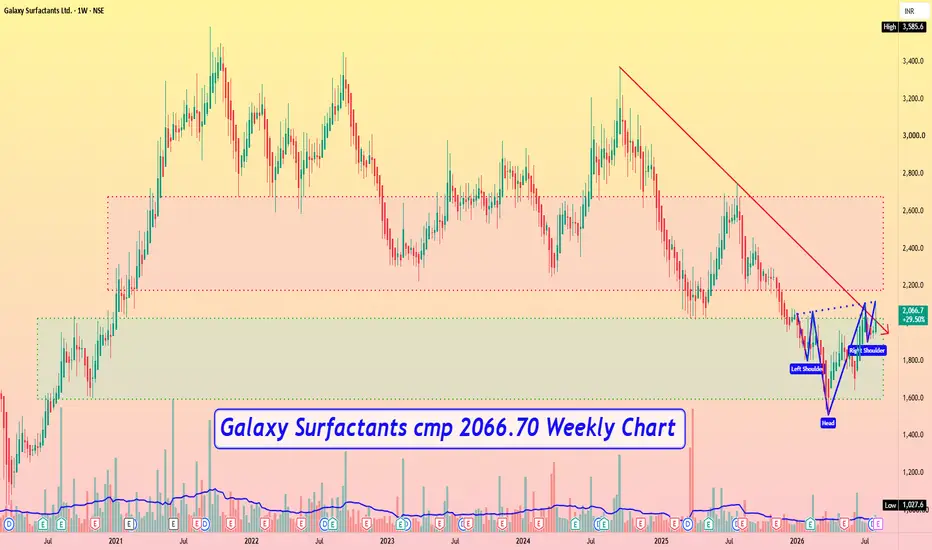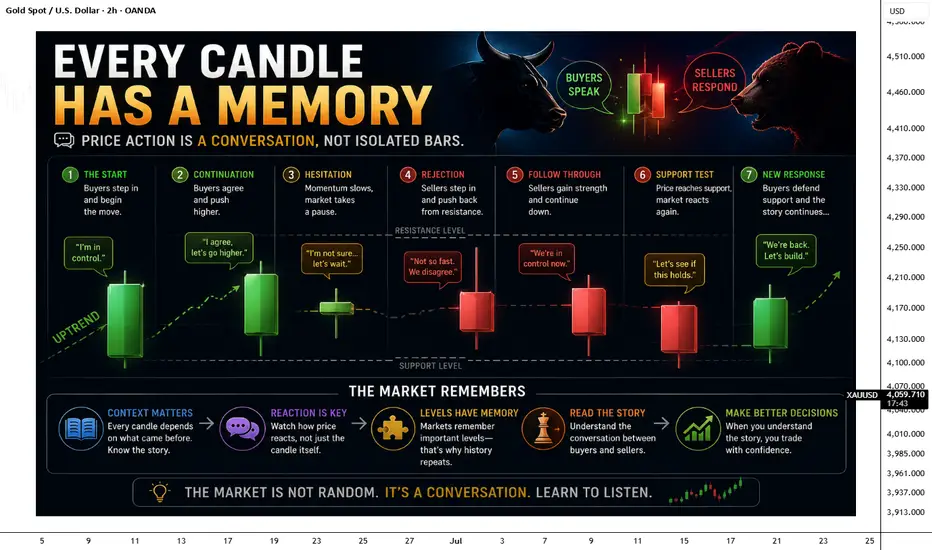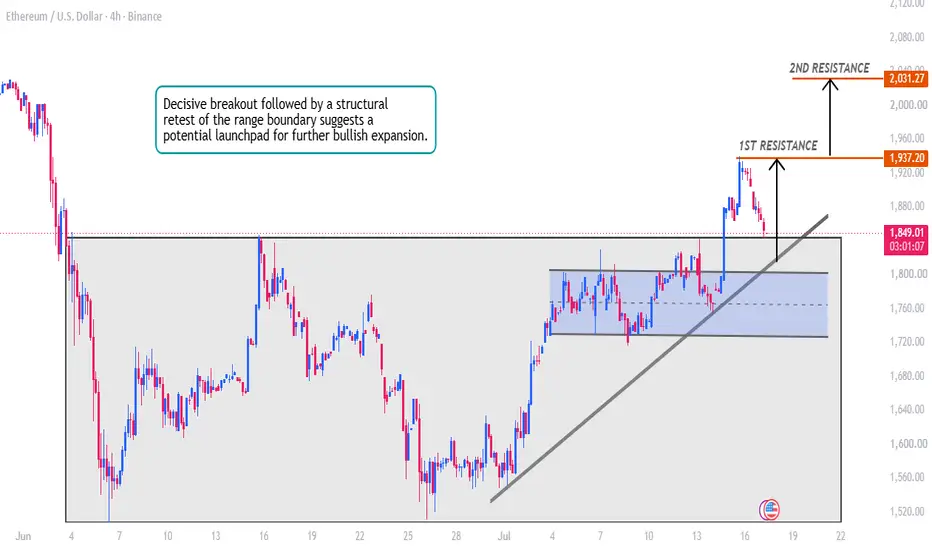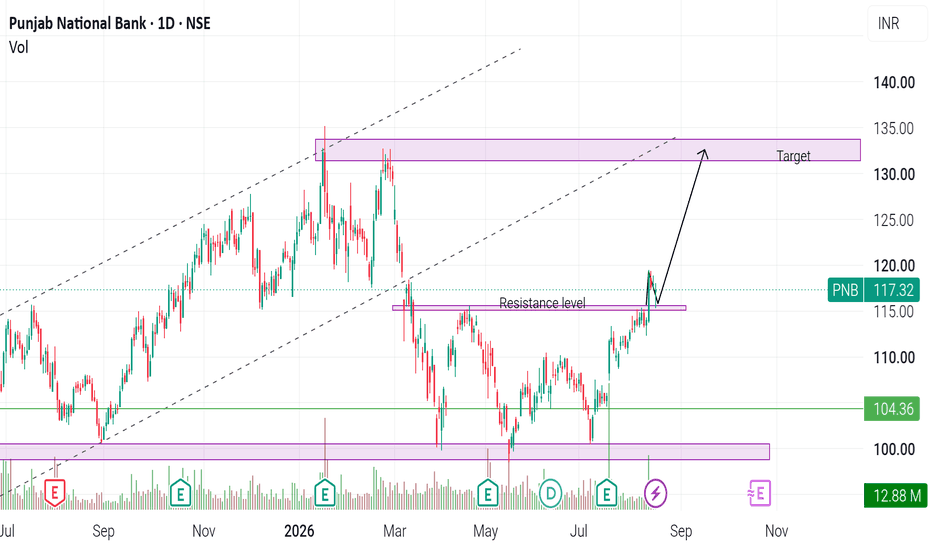
Intrday AnalysisOption Chain Analysis: Decoding Open Interest (OI) to find where the "Big Players" are positioned.
FII/DII Data: Understanding institutional activity and its impact on market direction.
Intraday Strategies: Scalping and swing setups using Price Action and key EMAs.
Global Market Cues: How GIFT Nifty and US Markets might influence our opening.
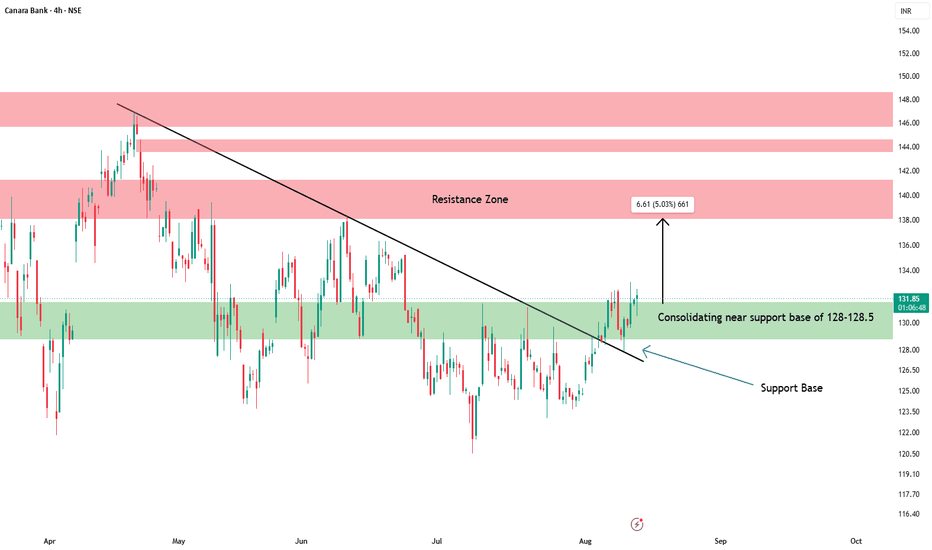
Trend Line Break
XAUUSD — Recovery First, Bearish Rejection Later
Fundamental Analysis
Gold remains sensitive to USD momentum, Treasury yields, and upcoming U.S. macro data. For next week, price may create a technical recovery first, but the larger structure still shows bearish pressure while gold stays below the main descending trendline.
Technical Analysis
On the 12H chart, XAUUSD is trading around 4,120 after holding above short-term support. The first upside area to watch is 4,204, which acts as strong resistance. If price continues higher, the major sell zone is around 4,300 - 4,310, where Fibonacci resistance, previous structure, and the descending trendline align. A rejection from this area could send gold back toward 3,942, then the deeper Fibonacci target near 3,754.
Important Key Levels
Current price: 4,120
Short-term resistance: 4,204
Main sell zone: 4,300 - 4,310
Strong support: 3,942
Main Fibonacci target: 3,754 - 3,751
Invalidation: above 4,310
Trading Scenario
Main Sell Setup
Entry: 4,300 - 4,310
Stop Loss: 4,360
Take Profit 1: 4,204
Take Profit 2: 3,942
Take Profit 3: 3,754 - 3,751
Sell Condition
Wait for gold to recover toward the 4,300 - 4,310 Fibonacci sell zone. A valid sell setup needs bearish rejection from this area, such as a long upper wick, failed breakout, or bearish candle close below the zone. If price rejects and breaks back below 4,204, the bearish continuation view becomes stronger. If price breaks and holds above 4,310, the sell setup is invalid.
Overall View
The main plan for next week is not to sell too early at the current price. Gold may rise first toward 4,204 or even 4,300 - 4,310 before sellers return. As long as price stays below the descending trendline and rejects the Fibonacci sell zone, the larger downside target remains 3,942 and 3,754.
Do you share the same view that gold may recover first before the next bearish move?
MASON XAUUSD – Accumulation Inside Bearish Channel
XAUUSD is trading around 4,120 while still moving inside the medium-term descending channel. Although the broader structure has not fully broken out yet, gold is showing strong accumulation around the lower-middle area of the channel.
The priority view is that gold may continue building a base above the 4,080–4,095 buy zone before attempting a stronger medium-term recovery toward the upper resistance zones.
Technical View
Gold is still inside a bearish price channel on the 6H structure. The upper trendline of the channel continues to act as the main resistance, so the market has not confirmed a full bullish reversal yet.
However, the recent price action shows a clear change in behaviour. Instead of continuing lower after reaching the lower channel area, gold started to form a stronger accumulation base. This means sellers are losing momentum, while buyers are slowly defending the market around the 4,080–4,095 area.
The 4,080–4,095 zone is the key buy zone on the chart. This area is important because price has reacted from it several times, and it also sits near the lower accumulation structure. As long as gold holds above this zone, the recovery scenario remains valid.
Ichimoku is still important here. Price is trying to recover around the Ichimoku structure, but it still needs a clean break above the short-term resistance around 4,162 to confirm stronger bullish momentum. If gold can break and hold above this level, the next move may target the descending channel resistance.
The first major upside area is around 4,300–4,330, marked as the market psychology sell zone. This area may create some reaction first. If buyers can absorb the selling pressure there, gold may continue toward 4,400–4,420 and later the Fibonacci resistance zone around 4,500–4,530.
Key Zones
Current price: 4,120
Main buy zone: 4,080–4,095
Short-term support: 4,033–4,050
Bullish confirmation: above 4,162
Channel resistance area: 4,280–4,330
Market psychology sell zone: 4,300–4,330
Price reaction zone: 4,400–4,420
Fibonacci resistance: 4,500–4,530
Invalidation: below 4,033
Trading Plan
Buy Priority: 4,080–4,095
Condition: wait for bullish rejection, higher low formation, or price holding above the buy zone and Ichimoku support.
SL: below 4,033
TP1: 4,162
TP2: 4,300–4,330
TP3: 4,400–4,420
Final target: 4,500–4,530
Alternative Scenario
If gold breaks above 4,162 directly, wait for a retest of this level as support before looking for buy continuation. A clean hold above 4,162 would confirm that accumulation is turning into a stronger bullish recovery phase.
Sell View
Sell is not the priority while price continues to hold above 4,080–4,095. A short-term sell reaction may appear around 4,300–4,330 because this is still channel resistance and a psychological supply zone. However, unless gold breaks below 4,033, any pullback from that area should be treated as correction inside a larger recovery attempt.
Final View
Overall, gold remains inside a medium-term bearish channel, but the price behaviour is no longer strongly bearish. The market is showing accumulation above the buy zone, and this may prepare for a stronger bullish move if 4,162 breaks cleanly. As long as 4,080–4,095 holds, the medium-term recovery path toward 4,300, 4,400, and 4,500 remains possible.
Will gold complete the accumulation phase and break the channel resistance, or retest the buy zone one more time before the next bullish leg?
XAUUSD — Bullish Channel Holds Above Buy Zone
Fundamental Analysis
Gold is still reacting to USD momentum, Treasury yields, and upcoming U.S. macro data. For now, the short-term structure remains positive while price continues to hold inside the rising channel.
Technical Analysis
On the 2H chart, XAUUSD is trading around 4,142 and still respecting the bullish channel structure. The main buy order trendline zone is around 4,141 - 4,143. If price holds this area, buyers may continue to defend the trend and push gold toward the liquidity zone at 4,144, then the mid-channel resistance around 4,145 - 4,146. A stronger breakout above this area may open the way toward the main target around 4,152.
Important Key Levels
Current price: 4,142
Main buy zone: 4,141 - 4,143
Short-term support: 4,140
Liquidity resistance: 4,144
Mid-channel resistance: 4,145 - 4,146
Main target: 4,152
Invalidation: below 4,140
Trading Scenario
Main Buy Setup
Entry: 4,141 - 4,143
Stop Loss: 4,140
Take Profit 1: 4,144
Take Profit 2: 4,145 - 4,146
Take Profit 3: 4,152
Buy Condition
Wait for gold to retest the 4,141 - 4,143 buy zone and show bullish rejection. A clean hold above the trendline keeps the bullish setup valid. If price breaks above 4,144, upside momentum becomes stronger toward 4,145 - 4,146 and 4,152. If price breaks and holds below 4,140, the buy setup is invalid.
Overall View
XAUUSD remains bullish while price stays inside the rising channel and holds above the buy order trendline zone. The preferred plan is to wait for confirmation around 4,141 - 4,143, then look for continuation toward 4,144, 4,146, and 4,152.
Do you share the same bullish view on gold, or are you waiting for confirmation above the liquidity zone first?
XAUUSD — Buy Trend Holding Above 4,100 Liquidity
Gold is trading around $4,118 after recovering from the lower structure near $4,022. The current price is holding above the $4,100–$4,107 buy zone liquidity, while the market has already created a short-term CHOCH and BOS after the previous downside move.
From an SMC perspective, gold has shifted from the lower liquidity area into a recovery structure. The market is now correcting under the descending trendline, but the structure is not bearish as long as price holds above the main buy zone. The $4,100–$4,107 area is important because it is where liquidity may be tested before buyers attempt another bullish continuation.
The main plan is to wait for gold to respect the buy zone liquidity and build confirmation. If buyers defend $4,100–$4,107, gold may push back toward $4,137 first. A clean break above this level and the descending trendline would confirm stronger bullish continuation toward the upper OB area and the buy-side liquidity around $4,221.
Buy setup 1
Condition:
Gold pulls back into the $4,100–$4,107 buy zone liquidity and forms bullish rejection with lower timeframe MSS / CHOCH.
Entry: $4,100–$4,107
SL: below $4,080
TP1: $4,137
TP2: $4,160
TP3: $4,190–$4,200
TP4: $4,221
Buy setup 2
Condition:
If gold breaks above the descending trendline and retests it as support, bullish continuation remains valid without waiting for a deeper pullback.
Entry: above $4,137 after breakout retest
SL: below $4,100
TP1: $4,160
TP2: $4,190–$4,200
TP3: $4,221
Buy setup 3
Condition:
If gold drops deeper but still holds the lower buy zone around $4,065–$4,075, this can create a secondary liquidity-buy setup.
Entry: $4,065–$4,075 after bullish rejection
SL: below $4,022
TP1: $4,100–$4,107
TP2: $4,137
TP3: $4,190–$4,200
Sell setup
Condition:
Selling is not the main priority. A sell setup is only valid if gold fails to hold above $4,100–$4,107 and breaks the lower structure clearly.
Entry: below $4,080 after breakdown retest
SL: above $4,107
TP1: $4,065–$4,075
TP2: $4,022
TP3: $3,960
Key levels
Current price area: $4,118
Main buy zone liquidity: $4,100–$4,107
Secondary buy zone: $4,065–$4,075
Major low support: $4,022
Short-term breakout level: $4,137
Trendline resistance: around $4,137–$4,150
Upper OB reaction zone: $4,190–$4,200
Buy-side liquidity: $4,221
Bullish continuation confirmation: clean break above $4,137
Stronger bullish confirmation: clean break above $4,160
Bullish invalidation: clean 2H close below $4,022
My current view is that gold still has a buy-side structure as long as price holds above the $4,100–$4,107 liquidity zone. The Prime Gold plan is to avoid chasing price in the middle, wait for confirmation around the buy zone or after a breakout above the descending trendline, then follow the move toward $4,137, $4,160 and potentially $4,221.
No confirmation, no trade.
EURUSD — Bullish Channel Holding Above Buy Zone
Fundamental Analysis
EURUSD is still reacting to USD momentum and upcoming U.S. macro data. For now, the short-term structure remains positive while price continues to hold inside the rising channel.
Technical Analysis
On the 2H chart, EURUSD is trading around 1.1426 and still respecting the bullish channel structure. The key buy order trendline zone is around 1.1418 - 1.1426. If price holds this area, buyers may continue to defend the trend and push price toward the liquidity zone at 1.1448, then the mid-channel resistance around 1.1458. A stronger breakout above this area may open the way toward the main target at 1.1526.
Important Key Levels
Current price: 1.1426
Main buy zone: 1.1418 - 1.1426
Short-term support: 1.1400
Liquidity resistance: 1.1448
Mid-channel resistance: 1.1458
Main target: 1.1526
Invalidation: below 1.1400
Trading Scenario
Main Buy Setup
Entry: 1.1418 - 1.1426
Stop Loss: 1.1400
Take Profit 1: 1.1448
Take Profit 2: 1.1458
Take Profit 3: 1.1526
Buy Condition
Wait for price to retest the 1.1418 - 1.1426 buy zone and show bullish rejection. A clean hold above this trendline area keeps the bullish setup valid. If price breaks above 1.1448, upside momentum becomes stronger toward 1.1458 and 1.1526. If price breaks and holds below 1.1400, the buy setup is invalid.
Overall View
EURUSD remains bullish while price stays inside the rising channel and holds above the buy order trendline zone. The preferred plan is to wait for confirmation around 1.1418 - 1.1426, then look for continuation toward 1.1448, 1.1458, and 1.1526.
Do you share the same bullish view on EURUSD, or are you waiting for confirmation above 1.1448 first?
MAXESTATE: Recovery TrendNSE:MAXESTATES
MAXESTATE continues to display an improving market structure with higher highs and higher lows while holding above its key moving averages. Buyers have defended the recent pullback, suggesting demand remains active.
Key observations:
• Bullish EMA alignment with healthy momentum (RSI above 50)
• Strong support around ₹436–442
• Immediate resistance at ₹460–470 (tested now)
• Major supply zone between ₹495–500
• A sustained breakout above ₹500 may strengthen the medium-term bullish structure, while a loss of ₹430 would weaken the current setup.
The chart remains constructive, but confirmation through price acceptance above resistance and supportive volume is still required.
Levels to watch: ₹442 | ₹470 | ₹500 | ₹560
Indicator Used:
--------------------------------------------------------------------------------------------------------------------
Disclosure
This analysis is shared purely for educational and informational purposes based on technical analysis and publicly available price data. It is not investment advice or a recommendation to buy or sell any security. Always conduct your own research and manage risk appropriately before making trading or investing decisions.
MASON XAUUSD – Short-Term Sell Bias Below Ichimoku
XAUUSD is trading around 4,125 after failing to show a clear bullish continuation. Price is still under the Ichimoku resistance area, and the buying pressure looks weak around the current recovery zone.
The priority view remains sell with the short-term trend, especially if gold retests the sell order liquidity zone near the descending trendline and Fibonacci area.
Technical View
Gold is currently moving below the Ichimoku structure, which shows that buyers have not fully regained control. The cloud and Ichimoku lines above price are acting as dynamic resistance, so any recovery should still be treated carefully.
The recent bounce from 4,096 shows that buyers reacted from support, but the move is not strong enough to confirm a clean bullish reversal. Price is still below the trendline resistance, and the structure remains corrective.
The 4,135–4,145 area is the key sell order liquidity zone on the chart. This zone is important because it aligns with the descending trendline, Fibonacci reaction area, and short-term Ichimoku resistance. If gold reaches this area and rejects, it may confirm another lower high before continuation lower.
The 4,096 level is the nearest support. If price breaks below this area, bearish pressure may continue toward the Fibonacci 50 reaction zone around 4,070–4,080.
The deeper downside target is around 4,035–4,045, which is marked as the next target zone on the chart. This area becomes more likely if gold loses 4,096 and fails to recover above the sell zone.
Key Zones
Current price: 4,125
Sell order liquidity zone: 4,135–4,145
Ichimoku resistance area: 4,151–4,156
Nearest support: 4,096
Fibonacci 50 reaction zone: 4,070–4,080
Downside target: 4,035–4,045
Major resistance: 4,221
Invalidation: above 4,156
Trading Plan
Sell Priority: 4,135–4,145
Condition: wait for bearish rejection, failed breakout above the trendline, or price staying below the Ichimoku resistance area.
SL: above 4,156
TP1: 4,096
TP2: 4,070–4,080
TP3: 4,035–4,045
Alternative Scenario
If gold breaks below 4,096 directly, wait for a retest of this level as resistance before looking for sell continuation toward 4,070 and 4,035.
Buy View
Buy is not the priority while price remains below the Ichimoku structure and descending trendline. A short-term buy reaction may appear near 4,070–4,080, but it needs clear bullish confirmation first.
Final View
Overall, gold has not confirmed a strong bullish reversal yet. Price is still under Ichimoku pressure, and the cleaner plan is to watch for sell confirmation around 4,135–4,145. If this zone rejects, the next downside focus remains 4,096, 4,070, and 4,035.
Will gold reject from the trendline and Ichimoku zone, or break above 4,156 to weaken the short-term sell view?
XAUUSD — Waiting Sell From EMA Value Zone
Fundamental Analysis
Gold remains sensitive to USD momentum, Treasury yields, and upcoming U.S. macro data. For now, the market is still moving with short-term bearish pressure, so any recovery should be treated as a pullback unless price can reclaim the upper resistance zone.
The better plan is to wait for price to return to a clear sell value zone instead of chasing the move after a strong drop.
Technical Analysis
On the 1H chart, XAUUSD is trading around 4,053 after reacting strongly from the 0.382 Fibonacci area near 4,041. This reaction shows that buyers are trying to defend the short-term support, but the overall structure is still not bullish yet.
Price remains inside a descending channel, and the EMA structure is still acting as dynamic resistance above the current price. The recent bounce looks more like a corrective recovery inside a bearish trend rather than a full reversal.
The main sell zone is around 4,094 - 4,101. This area aligns with the previous support turned resistance, Fibonacci reaction zone, descending trendline pressure, and EMA value area. If price recovers into this zone and rejects, sellers may continue to push gold lower.
The downside target remains around 4,003 first, followed by the psychological Fibonacci target zone near 3,990 - 3,988.
Important Key Levels
Current price area: 4,053
Fibonacci reaction support: 4,041
Main sell zone: 4,094 - 4,101
Upper resistance: 4,135
Short-term downside level: 4,003
Main Fibonacci target: 3,990 - 3,988
Invalidation area: above 4,135
Trading Scenario
Main Sell Scenario
Entry: 4,094 - 4,101
Stop Loss: 4,135
Take Profit 1: 4,041
Take Profit 2: 4,003
Take Profit 3: 3,990 - 3,988
Sell Condition
The preferred setup is to wait for gold to pull back into the 4,094 - 4,101 sell zone. This is the key value area because it combines Fibonacci structure, EMA resistance, and the descending channel reaction zone.
A sell setup becomes more valid if price forms bearish rejection from this area, such as a long upper wick, bearish engulfing candle, failed breakout, or lower high below 4,101.
If price rejects from the sell zone and breaks back below 4,041, the bearish continuation view becomes stronger. The next downside focus would be 4,003, followed by the Fibonacci psychological target around 3,990 - 3,988.
Alternative Buy Scenario
Entry: above 4,135 after breakout confirmation
Stop Loss: 4,101
Take Profit 1: 4,160
Take Profit 2: 4,180
Take Profit 3: 4,200
Buy Condition
This is not the main view. A buy setup should only be considered if gold breaks above 4,135 and holds above the descending structure with strong confirmation.
If price cannot break and hold above 4,135, the bearish setup remains the priority.
Entry Conditions
Wait for price to retest 4,094 - 4,101.
Look for bearish rejection before entering sell.
Do not sell aggressively at the low without a pullback.
A break below 4,041 confirms stronger downside pressure.
If price breaks and holds above 4,135, the sell setup is invalid.
Overall, the main view remains bearish while XAUUSD trades below the EMA resistance structure and inside the descending channel. The preferred plan is to wait for a pullback into 4,094 - 4,101, then look for sell confirmation toward 4,041, 4,003, and 3,990 - 3,988.
Do you share the same bearish view on gold, or are you waiting for a cleaner rejection from the EMA value zone first?
XAUUSD — Pullback to Fibonacci Before Bullish Recovery
Fundamental Analysis
Gold remains sensitive to USD momentum, Treasury yields, and upcoming U.S. macro data. For now, the market is still moving inside a technical recovery phase, but traders should avoid chasing price near the middle of the range.
The better plan is to wait for price to return to a clear value zone before looking for continuation.
Technical Analysis
On the 2H chart, XAUUSD is trading around 4,129 after losing short-term momentum near the current EMA area. Price is still holding above the lower recovery structure, but the market may need one more pullback before buyers step in again.
The key area to watch is the Fibonacci and liquidity buy zone around 4,056 - 4,073. This zone aligns with the previous reaction area, Fibonacci support, and short-term liquidity.
If gold drops into this zone and forms bullish rejection, the recovery scenario may continue toward the resistance and Fibonacci zone around 4,212 - 4,231.
However, if price fails to hold the buy zone, the downside may extend toward 4,001.
Important Key Levels
Current price area: 4,129
Short-term EMA reaction area: 4,110 - 4,135
Main buy zone: 4,056 - 4,073
Deeper downside liquidity: 4,001
Near resistance: 4,151 - 4,160
Main upside target: 4,212 - 4,231
Invalidation area: below 4,001
Trading Scenario
Main Buy Scenario
Entry: 4,056 - 4,073
Stop Loss: 4,001
Take Profit 1: 4,110
Take Profit 2: 4,151
Take Profit 3: 4,212 - 4,231
Buy Condition
The preferred setup is to wait for gold to pull back into the 4,056 - 4,073 Fibonacci and liquidity buy zone. This area is important because it gives a cleaner value entry instead of buying in the middle of the current range.
A buy setup becomes more valid if price forms bullish rejection from this zone, such as a long lower wick, bullish engulfing candle, higher low formation, or a clean reclaim above 4,073.
If gold reacts from the buy zone and breaks back above 4,151, the bullish recovery view becomes stronger. The next upside focus would be 4,212 - 4,231.
Alternative Sell Scenario
Entry: below 4,001 after breakdown confirmation
Stop Loss: 4,056
Take Profit 1: 3,960
Take Profit 2: 3,930
Take Profit 3: 3,900
Sell Condition
This is not the main view. A sell setup should only be considered if gold breaks below 4,001 and fails to recover the Fibonacci buy zone.
If price loses 4,001 with strong bearish momentum, the recovery structure becomes weaker and gold may continue toward lower liquidity areas.
Entry Conditions
Wait for price to test 4,056 - 4,073.
Look for bullish rejection before entering buy.
Do not chase price while it is still between support and resistance.
A break above 4,151 confirms stronger recovery momentum.
If price breaks and holds below 4,001, the buy setup is invalid.
Overall, the main view is that gold may drop first into the Fibonacci and liquidity zone before creating a stronger bullish recovery. The preferred plan is to wait for confirmation around 4,056 - 4,073, then look for continuation toward 4,151 and 4,212 - 4,231.
Do you share the same view that gold needs one more pullback before the next bullish recovery?
XAUUSD – Gold Corrects Into Fibonacci And Ichimoku Support
XAUUSD is trading around 4,129 after pulling back from the recent high area near 4,190–4,200. The short-term bullish structure is still valid, but price is now correcting into an important Fibonacci and Ichimoku support area.
The priority view remains buy on pullback, as long as gold holds above the key Fibonacci zones and does not break below the rising structure.
Technical View
Gold has created a strong recovery from the previous strong support zone around 3,960. The market moved higher and formed a clear bullish leg, showing that buyers were in control during the recent move.
However, price is now correcting after reaching the upper resistance and descending trendline area near 4,190–4,200. This pullback is normal after a strong bullish move, but the key question is whether buyers can defend the Fibonacci support zones.
The current area around 4,128–4,136 is acting as a short-term reaction zone. Price is testing this area after the pullback, but a clean bullish continuation still needs stronger confirmation.
The first important buy zone is 4,102–4,106. This zone aligns with the Fibonacci 0.618 area and also sits close to the Ichimoku support structure. If gold pulls back here and forms bullish rejection, it may confirm a higher low before the next upside move.
The deeper buy zone is 4,071–4,075, near the Fibonacci 0.5 area. If the first buy zone fails, this lower zone becomes the next area to watch for a stronger reaction.
Ichimoku still supports the recovery structure as long as price holds above the main cloud support and does not close deeply below the lower support zone. A clean break below 4,071 would weaken the bullish view and may open a deeper correction.
The upside target remains around 4,190–4,200, where the descending trendline and recent resistance are located. If gold breaks above this zone, the bullish structure may extend further.
Key Zones
Current price: 4,129
Short-term reaction zone: 4,128–4,136
Buy order zone 1: 4,102–4,106
Buy order zone 2: 4,071–4,075
Ichimoku support area: 4,115–4,166
Upper resistance: 4,190–4,200
Major trendline resistance: around 4,200
Invalidation: below 4,071
Trading Plan
Buy Priority: 4,102–4,106
Condition: wait for bullish rejection, higher low formation, or price holding above the Fibonacci 0.618 zone and Ichimoku support.
SL: below 4,071
TP1: 4,136
TP2: 4,166
TP3: 4,190–4,200
Alternative Scenario
If gold breaks below 4,102–4,106, wait for the deeper buy zone at 4,071–4,075. A bullish reaction from this area may still support continuation, but confirmation must be clearer.
Sell View
Sell is not the priority while price remains above the Fibonacci support zones and the rising structure. A sell setup only becomes safer if gold breaks below 4,071 and fails to recover back above the Ichimoku support area.
Final View
Overall, gold is correcting after a strong bullish move, but the main structure is not broken yet. The cleaner plan is to wait for price to test the Fibonacci and Ichimoku support zones around 4,102–4,106 or 4,071–4,075. If buyers defend these areas, gold may continue toward 4,166 and 4,190–4,200.
Will gold hold the Fibonacci support zone and continue higher, or break lower into a deeper correction first?
XAUUSD — Early Week Pullback Before Bullish Recovery
Gold is trading around $4,167 after recovering strongly from the lower liquidity area. Price is now testing the short-term descending trendline, so the market may first create a pullback before the next bullish continuation attempt.
From an SMC perspective, gold has already swept the lower liquidity twice and created a recovery structure from the bottom. The current move is approaching a trendline reaction area, so an early-week rejection is possible. However, as long as price holds above the $4,095–$4,101 FVG buy zone, the recovery structure can still remain valid.
The main plan for the beginning of the week is to avoid chasing gold at the current price. If price rejects from the trendline area, gold may first pull back toward the $4,095–$4,101 buy zone. This zone is the key area where buyers may defend the structure before pushing price back toward $4,269, $4,283 and the strong liquidity area around $4,382.
Sell scalping setup
Condition:
Gold rejects from the descending trendline area around the current price and fails to break above the short-term resistance.
Entry: $4,167–$4,195 after bearish rejection
SL: above $4,230
TP1: $4,120
TP2: $4,095–$4,101
TP3: $4,029
Buy setup 1
Condition:
Gold pulls back into the FVG buy zone around $4,095–$4,101 and forms bullish rejection with lower timeframe MSS / CHOCH.
Entry: $4,095–$4,101
SL: below $4,029
TP1: $4,167
TP2: $4,269
TP3: $4,283
TP4: $4,382
Buy setup 2
Condition:
If gold breaks above the descending trendline and retests it as support, bullish continuation remains valid without waiting for a deep pullback.
Entry: above $4,195 after breakout retest
SL: below $4,120
TP1: $4,269
TP2: $4,283
TP3: $4,382
Sell setup
Condition:
Selling is not the main priority after a deep pullback. A stronger sell setup is only valid if gold reaches the $4,269–$4,283 FVG sell scalping zone and shows clear bearish rejection.
Entry: $4,269–$4,283 after rejection
SL: above $4,330
TP1: $4,195
TP2: $4,167
TP3: $4,095–$4,101
Key levels
Current price area: $4,167
Short-term trendline resistance: $4,167–$4,195
FVG buy zone: $4,095–$4,101
Sell-side liquidity: $4,029
FVG sell scalping zone: $4,269–$4,283
Strong liquidity: $4,382
Higher FVG resistance: $4,420–$4,455
Bullish continuation confirmation: clean break above $4,195
Bullish target confirmation: clean break above $4,283
Bullish invalidation: clean 2H close below $4,029
My current view is that gold may drop first at the beginning of the week before building another bullish recovery. The Prime Gold plan is to wait for price to pull back into the FVG buy zone around $4,095–$4,101, confirm bullish reaction, then follow the move toward the upper liquidity zones.
No confirmation, no trade.
MASON XAUUSD – Gold Holds Bullish Structure At Weekly Open
XAUUSD is trading around 4,181 at the start of the week after holding above the recent breakout structure. Price remains inside the rising trendline channel and above the Ichimoku support area, so the short-term bias is still bullish.
The priority view remains buy on pullback, especially if gold retests the 4,172–4,177 buy order zone and continues to hold above the key support area.
Technical View
Gold is still showing a bullish structure after the strong recovery from the 3,960 area. The market has created higher highs and higher lows, which shows that buyers are still controlling the short-term direction.
Price is currently moving inside a rising trendline channel. This channel is important because it shows the path of the bullish momentum. As long as gold holds above the lower trendline, the upside structure remains valid.
Ichimoku also supports the bullish view. Price is trading above the Ichimoku structure, while the cloud and Ichimoku lines below price may now act as dynamic support. This means pullbacks are still healthier than chasing price at resistance.
The 4,172–4,177 area is the key buy order zone on the chart. If gold pulls back into this zone and forms bullish rejection, it may confirm another higher low before continuing higher.
The 4,155 area is the key support zone. If price stays above this level, buyers still have the advantage. A breakdown below 4,155 would weaken the bullish structure and may create a deeper correction.
The main upside target remains the psychological resistance zone around 4,270–4,280, which also aligns with the Fibonacci 2.618 extension area. This is the next major zone where price may react.
Key Zones
Current price: 4,181
Buy order zone: 4,172–4,177
Key support zone: 4,155
Ichimoku support area: 4,093–4,052
Short-term resistance: 4,190–4,200
Psychological resistance zone: 4,270–4,280
Fibonacci extension target: 2.618
Invalidation: below 4,155
Trading Plan
Buy Priority: 4,172–4,177
Condition: wait for bullish rejection, higher low formation, or price holding above the rising trendline and Ichimoku structure.
SL: below 4,155
TP1: 4,200
TP2: 4,240
TP3: 4,270–4,280
Alternative Scenario
If gold breaks above 4,200 directly, wait for a retest of this level as support before looking for continuation toward 4,240 and the psychological resistance zone.
Sell View
Sell is not the priority while price stays above the rising trendline, the buy order zone, and the Ichimoku structure. A sell setup only becomes safer if gold breaks below 4,155 and fails to recover back above the key support zone.
Final View
Overall, gold continues to hold a bullish structure at the start of the week. The cleaner plan is to wait for a pullback into the 4,172–4,177 buy zone instead of chasing price near resistance. If this zone holds, the next upside focus remains 4,200, 4,240, and 4,270–4,280.
Will gold retest the buy order zone first, or continue directly toward the psychological resistance area?
MASON XAUUSD – Gold Tests Trendline And Ichimoku Value Area
XAUUSD is trading around 4,175 after a strong recovery from the recent support zone. However, the bullish structure has not been fully confirmed yet because price is now testing the descending trendline and the Ichimoku value area.
For next week, the priority view is to watch for sell confirmation around the trendline resistance zone, especially if gold fails to break and hold above 4,187–4,198.
Technical View
Gold has recovered strongly from the 3,960 support area, but the current move is still approaching a major decision zone. Price is now testing the descending trendline that has been controlling the broader bearish structure.
The zone around 4,187–4,198 is important because it is marked as a sell order area and sits close to the trendline resistance. If price reacts bearishly here, this area may become the next lower high before another downside move.
Ichimoku also shows that gold is not fully bullish yet. Price is around the Ichimoku value area, where the market often slows down before choosing direction. A clean bullish confirmation needs price to break above this area and hold above the trendline. Without that confirmation, the recovery should still be treated as a corrective move.
The 4,260–4,290 Sell FVG is the higher resistance zone. If gold breaks above 4,198 and continues higher, this FVG may become the next area where sellers watch for reaction.
The downside structure remains valid if price rejects from the current trendline zone. The first reaction zone is around 4,059, followed by the strong support area near 3,960–3,980. If this support breaks, the weekly bearish targets are 3,900–3,920 and 3,740–3,760.
Key Zones
Current price: 4,175
Sell order zone: 4,187–4,198
Trendline resistance: around 4,180–4,200
Price reaction zone: 4,059
Strong support: 3,960–3,980
Target 1: 3,900–3,920
Target 2: 3,740–3,760
Sell FVG: 4,260–4,290
Major resistance: 4,382
Invalidation: above 4,290
Trading Plan
Sell Priority: 4,187–4,198
Condition: wait for bearish rejection, failed breakout above the trendline, or price closing back below the Ichimoku value area.
SL: above 4,290
TP1: 4,059
TP2: 3,960–3,980
TP3: 3,900–3,920
Final target: 3,740–3,760
Alternative Scenario
If gold breaks above 4,198 and holds, the sell setup should not be rushed. In that case, wait for price to move toward the 4,260–4,290 Sell FVG and watch for a new bearish reaction there.
Buy View
Buy is not the priority while price is still below the major resistance and testing the descending trendline. A bullish view becomes cleaner only if gold breaks above 4,290 and holds above the Sell FVG.
Final View
Overall, gold has recovered strongly, but the weekly bullish confirmation is still not clear. The key area for next week is 4,187–4,198. If gold rejects from the trendline and Ichimoku value area, the market may rotate lower toward 4,059, 3,960, and the deeper Fibonacci target zones.
Will gold confirm a breakout above the trendline, or reject from the Ichimoku value area and start a new bearish leg?
XAUUSD Weekly Recovery Pullback, Main Trend Still Under Pressure
Gold is trading around $4,175 after reacting from the lower support area near the monthly low. The short-term price action is showing signs of a corrective recovery, but the broader structure is still under pressure as price remains below the descending trendline and below the main OB sell zone.
From an SMC perspective, gold has already broken the previous bullish structure and formed a clear CHoCH to the downside. The recent rebound can be viewed as a pullback after a strong bearish leg, not a confirmed bullish reversal yet. As long as price stays below the $4,530–$4,550 OB sell zone, sellers may continue to defend the higher liquidity areas.
For next week, the main scenario is that gold may recover first toward $4,269, then possibly $4,386 if buyers maintain short-term momentum. However, these upper zones are also where liquidity and sell pressure may appear again. The key area to watch is the OB sell zone around $4,530–$4,550, which aligns with the descending trendline and remains the strongest reaction zone on the chart.
Buy setup
Condition:
Gold holds above the monthly low area and forms bullish continuation on lower timeframe. A short-term buy is only valid as a recovery trade, not a full trend reversal.
Entry: $4,100–$4,120 after bullish confirmation
SL: below $3,943
TP1: $4,269
TP2: $4,386
TP3: $4,530–$4,550
Sell setup 1
Condition:
Gold recovers into the $4,269–$4,386 liquidity area and shows bearish rejection with lower timeframe MSS / CHOCH.
Entry: $4,269–$4,386 after rejection
SL: above $4,420
TP1: $4,102
TP2: $3,943
TP3: $3,889
Sell setup 2
Condition:
If gold continues higher into the OB sell zone around $4,530–$4,550 and rejects from the descending trendline, the main bearish continuation setup becomes stronger.
Entry: $4,530–$4,550 after bearish rejection
SL: above $4,620
TP1: $4,386
TP2: $4,102
TP3: $3,889
TP4: $3,720–$3,760
Key levels
Current price area: $4,175
Short-term resistance: $4,269
Buy-side liquidity: $4,386
Main OB sell zone: $4,530–$4,550
Higher buy-side liquidity: $4,777
Strong liquidity: $4,895
Monthly low area: $3,943
Strong lower liquidity: $3,889
Major demand zone: $3,720–$3,760
Bearish continuation confirmation: rejection below $4,530–$4,550
Bullish recovery confirmation: clean break above $4,386
Bearish invalidation: clean daily close above $4,550
My current view is that gold may have a recovery pullback next week, but the main trend is not fully bullish yet. The Prime Gold plan is to avoid selling too low and wait for price to recover into liquidity or the OB sell zone before looking for bearish confirmation. If the market holds above the monthly low, a short-term recovery toward $4,269–$4,386 is possible before the next major decision zone.
No confirmation, no trade.
Nifty spot 24270.85 Daily Chart - Weekly Update*Nifty spot 24270.85 Daily Chart - Weekly Update*
- Nifty closed positive by 0.89% fairly above last week*
- Stable Support Zone 23300 to 23850 for Nifty Index Band
- Stable Resistance Zone 24100 to 24675 for Nifty Index Band
- Firm ground "W" Double Bottom + repeat tiny Rounding Bottoms
- Nifty Index taking attempts to breakout from the Resistance Zone band
- Rising Trendline stands firm with stable Breakout of Falling Resistance Trendline
- Consolidation droplets of Geo Political scenario relieves anxiety for Domestic Markets
Stop Trading Random Candles: Identify Intraday Trend First# Intraday Trend Identification: Stop Trading Random Candles 📊
Most beginners lose money in intraday trading because they focus only on one candle.
One green candle = Buy
One red candle = Sell
But professional traders do not trade like that.
They first ask one simple question:
**“Who is controlling today’s market — buyers, sellers, or nobody?”**
That is called **Intraday Trend Identification**.
------------------------------------------
## 1. Understand the Market Condition First
Before taking any trade, identify whether the market is:
✅ Bullish
✅ Bearish
✅ Sideways
--> If the market is bullish, focus on buying opportunities.
--> If the market is bearish, focus on selling opportunities.
--> If the market is sideways, avoid overtrading.
The biggest mistake beginners make is using the same strategy in every market condition.
------------------------------------------
## 2. Bullish Intraday Trend
A bullish intraday trend forms when price makes:
**Higher Highs + Higher Lows**
This means buyers are active and every dip is being bought.
In this condition, do not chase big green candles.
Instead, wait for price to come near:
• Support
• VWAP
• 20 EMA
• Breakout retest zone
Then look for confirmation.
The best buying opportunity usually comes on a pullback, not after a huge candle.
------------------------------------------
## 3. Bearish Intraday Trend
A bearish intraday trend forms when price makes:
**Lower Highs + Lower Lows**
This means sellers are active and every bounce is being sold.
In this condition, avoid buying only because price has fallen too much.
Instead, wait for price to pull back near:
• Resistance
• VWAP
• 20 EMA
• Breakdown retest zone
Then check if sellers are again becoming active.
------------------------------------------
## 4. Sideways Market
A sideways market forms when price keeps moving between support and resistance.
In this condition:
• VWAP becomes flat
• EMAs get tangled
• Breakouts fail quickly
• Candles show wicks on both sides
• Both buyers and sellers get trapped
This is where many traders lose money because they keep taking trades without clear direction.
Sometimes, the best trade is no trade.
------------------------------------------
## 5. Use VWAP for Intraday Bias
VWAP is one of the simplest tools for intraday trend identification.
--> Price above VWAP = Bullish bias
--> Price below VWAP = Bearish bias
--> Price around VWAP = Choppy market
But remember, VWAP alone is not enough.
Always combine it with price structure, support/resistance, candle close, and volume.
------------------------------------------
## 6. Opening Range Matters
The first 15–30 minutes of the market are very important.
Mark the high and low of the opening range.
--> If price breaks above the opening range high and sustains, buyers may be stronger.
--> If price breaks below the opening range low and sustains, sellers may be stronger.
But do not trade only on a wick breakout.
Wait for a proper candle close and follow-through.
------------------------------------------
## 7. Simple Intraday Trend Formula
Use this formula before taking a trade:
**Trend = Structure + Level + VWAP + Volume + Candle Close**
If all these factors support the same direction, the trade quality improves.
Example:
--> If price is making higher highs and higher lows, staying above VWAP, holding support, and moving with volume, then bullish bias is stronger.
--> If price is making lower highs and lower lows, staying below VWAP, rejecting resistance, and falling with volume, then bearish bias is stronger.
------------------------------------------
## 8. Best Beginner Rule
Do not trade every candle.
Trade only when the market shows clear direction.
--> In a bullish market, buy near logical support.
--> In a bearish market, sell near logical resistance.
In a sideways market, reduce trades and wait for clarity.
------------------------------------------
## Important Note:
Intraday trading is not about predicting every move.
It is about identifying the current market control and trading with discipline.
--> If buyers are in control, avoid random shorts.
--> If sellers are in control, avoid random buying.
--> If nobody is in control, protect your capital.
**First identify the trend.
Then wait for the right entry.
Then manage your risk.**
That is how intraday trading becomes structured, not emotional.
------------------------------------------
Educational Purpose Only.
XAUUSD — Bullish Structure Holds Above EMA Value ZoneXAUUSD — Bullish Structure Holds Above EMA Value Zone
Fundamental Analysis
Gold is holding a stronger recovery structure as traders continue to watch USD momentum, Treasury yields, and upcoming U.S. macro data.
For now, the technical structure is improving. As long as price holds above the EMA value zone, the bullish continuation scenario remains favoured.
Technical Analysis
On the 1H chart, XAUUSD is trading around 4,179 after a strong recovery from the lower structure near 3,970 - 4,020. EMA 34, EMA 89, and EMA 200 are starting to turn upward, showing that buyers are gaining better control of the short-term trend.
Price has already broken above the previous EMA resistance area and is now holding above the rising EMA structure. This suggests that the recent pullback may be a continuation setup rather than a bearish reversal.
The first buy zone is around 4,132 - 4,145. This area aligns with the nearest value zone and may act as the first support if price pulls back.
The second buy zone is around 4,088 - 4,113. This is a deeper value area and also aligns with the previous breakout structure. If gold sweeps lower before reacting, this zone may offer a stronger buy reaction.
The main upside target is the Fibonacci range around 4,281 - 4,283.
Important Key Levels
Current price area: 4,179
Buy zone 1: 4,132 - 4,145
Buy zone 2: 4,088 - 4,113
EMA support area: 4,079 - 4,145
Short-term resistance: 4,200 - 4,220
Main Fibonacci target: 4,281 - 4,283
Invalidation area: below 4,079
Trading Scenario
Main Buy Scenario
Entry: 4,132 - 4,145
Stop Loss: 4,120
Take Profit 1: 4,200
Take Profit 2: 4,240
Take Profit 3: 4,281 - 4,283
Buy Condition
The preferred setup is to wait for gold to pull back into the 4,132 - 4,145 buy zone. This area is important because it aligns with the rising EMA structure and the nearest value support.
A buy setup becomes more valid if price forms bullish rejection from this zone, such as a long lower wick, bullish engulfing candle, higher low formation, or a clean reclaim above 4,145.
If price holds above this zone and breaks above 4,200, the bullish continuation view becomes stronger. The next upside focus would be 4,240, followed by the Fibonacci range around 4,281 - 4,283.
Alternative Buy Scenario
Entry: 4,088 - 4,113
Stop Loss: 4,079
Take Profit 1: 4,145
Take Profit 2: 4,200
Take Profit 3: 4,281 - 4,283
Buy Condition
This deeper buy setup is valid only if gold pulls back below the first zone but still holds above 4,079. A rejection from 4,088 - 4,113 would show that buyers are still defending the larger bullish structure.
If price breaks below 4,079 and holds there, the bullish setup becomes weaker and should be reassessed.
Entry Conditions
Wait for price to retest one of the buy zones.
Look for bullish rejection before entering buy.
Do not chase price after a strong move.
A break above 4,200 confirms stronger bullish momentum.
If price breaks and holds below 4,079, the buy setup is invalid.
Overall, the main view remains bullish while XAUUSD holds above the rising EMA structure. The preferred plan is to wait for a pullback into 4,132 - 4,145 or 4,088 - 4,113, then look for buy confirmation toward 4,200, 4,240, and the Fibonacci target around 4,281 - 4,283.
Do you share the same bullish view on gold, or are you waiting for a cleaner pullback into the EMA value zone first?
EURUSD — Bearish EMA Trend, Sell From Fibonacci Value Zone
Fundamental Analysis
EURUSD remains under pressure as traders continue to watch USD momentum, Fed expectations, and upcoming macro data.
For now, the main structure still favours sellers while price trades below the higher EMA resistance zone. Any recovery should be viewed as a corrective pullback unless EURUSD can reclaim the main sell zone with strong confirmation.
Technical Analysis
On the 2H chart, EURUSD is still moving in a bearish structure. EMA 34, EMA 89, and EMA 200 remain positioned above the key recovery area, showing that the main trend is still controlled by sellers.
Price is currently around 1.1417 after a short-term rebound from the lower area. However, this recovery is moving toward the Fibonacci value zone, where sellers may look for continuation entries.
The first reaction zone is around 1.1435 - 1.1440, where price has already tested the Fibonacci area. The stronger sell zone is around 1.1458 - 1.1474, which aligns with Fibonacci retracement, previous structure, and EMA resistance.
If price reaches this sell zone and rejects, the bearish continuation scenario remains valid. The main downside target is the Fibonacci extension zone around 1.1297.
Important Key Levels
Current price area: 1.1417
Fibonacci reaction zone: 1.1435 - 1.1440
Main sell price zone: 1.1458 - 1.1474
EMA resistance area: 1.1474 - 1.1490
Short-term support: 1.1390 - 1.1360
Fibonacci target: 1.1297
Invalidation area: above 1.1490
Trading Scenario
Main Sell Scenario
Entry: 1.1458 - 1.1474
Stop Loss: 1.1490
Take Profit 1: 1.1390
Take Profit 2: 1.1360
Take Profit 3: 1.1297
Sell Condition
The preferred setup is to wait for EURUSD to recover into the 1.1458 - 1.1474 sell zone. This area is important because it combines Fibonacci retracement, EMA resistance, and previous bearish structure.
A sell setup becomes more valid if price forms bearish rejection from this zone, such as a long upper wick, bearish engulfing candle, failed breakout, or lower high below the EMA structure.
If price rejects from the sell zone and breaks back below 1.1390, the bearish continuation view becomes stronger. The next downside focus would be 1.1360, followed by the Fibonacci target around 1.1297.
Alternative Buy Scenario
Entry: 1.1390 - 1.1400
Stop Loss: 1.1360
Take Profit 1: 1.1435
Take Profit 2: 1.1458
Take Profit 3: 1.1474
Buy Condition
This is only a short-term corrective bounce setup, not the main trend view. A buy setup is valid only if EURUSD holds above 1.1390 and forms clear bullish rejection.
If price fails to hold this area, the bounce setup is invalid and sellers may push directly toward the Fibonacci target zone.
Entry Conditions
Wait for price to retest 1.1458 - 1.1474.
Look for bearish rejection before entering sell.
Do not sell aggressively at the low without a pullback.
A break below 1.1390 confirms stronger downside pressure.
If price breaks and holds above 1.1490, the sell setup is invalid.
Overall, the main view remains bearish while EURUSD trades below the EMA resistance structure. The preferred plan is to wait for a corrective pullback into the Fibonacci value zone, then look for sell confirmation toward 1.1390, 1.1360, and the Fibonacci target around 1.1297.
Do you share the same bearish view on EURUSD, or are you waiting for a cleaner rejection from the Fibonacci value zone first?
XAUUSD — Bullish Trend Holds, Buy From Major Liquidity ZoneXAUUSD — Bullish Trend Holds, Buy From Major Liquidity Zone
Gold is trading around $4,165 after a strong recovery from the lower structure. The bullish trend is still holding, and price continues to form higher reactions after several CHoCH signals. Buyers are still controlling the short-term structure as long as gold stays above the main liquidity and FVG support area.
From an SMC perspective, gold has already swept the lower sell-side liquidity, reacted from demand, and pushed back into the upper OB zone. The current pullback is not yet a bearish reversal. It can still be viewed as a correction inside a bullish recovery structure, especially if price respects the $4,123–$4,130 liquidity zone.
The main buy area to watch is $4,123–$4,130. This is the closest major liquidity zone where buyers may look to defend the structure. If gold pulls back into this area and confirms bullish MSS / CHOCH on lower timeframe, the next upside target remains the OB reaction zone around $4,180–$4,195, followed by buy-side liquidity near $4,221.
Buy setup 1
Condition:
Gold pulls back into the major buy liquidity zone around $4,123–$4,130 and forms bullish rejection with lower timeframe MSS / CHOCH.
Entry: $4,123–$4,130
SL: below $4,057
TP1: $4,165
TP2: $4,180–$4,195
TP3: $4,221
Buy setup 2
Condition:
If gold breaks above the OB reaction zone around $4,180–$4,195 and retests it as support, bullish continuation remains valid.
Entry: above $4,195 after breakout retest
SL: below $4,150
TP1: $4,221
TP2: $4,240
TP3: $4,260
Sell setup
Condition:
Selling is not the priority. A sell setup is only valid if gold rejects strongly from the $4,180–$4,195 OB zone and loses the $4,123–$4,130 liquidity zone.
Entry: below $4,123 after breakdown retest
SL: above $4,165
TP1: $4,057
TP2: $4,030
TP3: $4,000
Key levels
Current price area: $4,165
Major buy liquidity zone: $4,123–$4,130
FVG support area: $4,070–$4,110
Sell-side liquidity: $4,057
OB reaction zone: $4,180–$4,195
Buy-side liquidity: $4,221
Bullish continuation confirmation: clean break above $4,195
Bullish invalidation: clean 2H close below $4,057
My current view is that gold remains in a bullish recovery structure. The trend is still holding as long as price respects the major liquidity zone around $4,123–$4,130. The Prime Gold plan is to avoid chasing the upper range and wait for price to pull back into liquidity, confirm bullish reaction, then follow the move toward the upper OB and buy-side liquidity.
No confirmation, no trade.
MASON XAUUSD – Gold Extends Bullish Momentum After NFP
XAUUSD is trading around 4,178 after a strong bullish continuation following the NFP reaction. Price has broken above the previous resistance zone and continues to hold above the Ichimoku structure, keeping the short-term bias bullish.
The priority view remains buy on pullback, but traders should be careful today because bank holiday conditions may reduce liquidity and create irregular price movement.
Technical View
Gold is showing clear bullish momentum after breaking above the previous resistance area around 4,090–4,100. This zone was resistance before, but after the breakout, it can now act as an important support area if price pulls back.
The market is also moving inside a rising trendline channel. This shows that buyers are still controlling the short-term structure, with price creating higher highs and higher lows.
Ichimoku also supports the bullish view. Price is trading above the Ichimoku structure, and the cloud below price may now act as dynamic support. As long as gold stays above the Ichimoku support zone, the bullish recovery remains valid.
The 4,136–4,140 area is the key buy order test zone on the chart. If price pulls back into this area and holds, it may confirm another higher low before continuation.
The next major upside target is around 4,270–4,280. This area matches the Fibonacci 2.618 extension and also sits near a psychological resistance zone, so buyers may take profit or price may react strongly there.
Because today is a bank holiday, liquidity can be thinner than usual. This means price may move fast, but confirmation is still important. Chasing after a strong candle is risky; waiting for a pullback gives a cleaner structure.
Key Zones
Current price: 4,178
Buy order test zone: 4,136–4,140
Previous resistance turned support: 4,090–4,100
Ichimoku support area: 4,028–4,048
Main upside target: 4,270–4,280
Fibonacci extension: 2.618
Invalidation: below 4,090
Trading Plan
Buy Priority: 4,136–4,140
Condition: wait for bullish rejection, higher low formation, or price holding above the rising trendline and Ichimoku structure.
SL: below 4,090
TP1: 4,200
TP2: 4,240
TP3: 4,270–4,280
Alternative Scenario
If gold breaks above 4,200 directly, wait for a retest of this level as support before looking for continuation toward 4,240 and 4,270.
Sell View
Sell is not the priority while price stays above the rising trendline and Ichimoku structure. A sell setup only becomes safer if gold loses 4,136 and breaks back below 4,090 with strong bearish confirmation.
Final View
Overall, gold remains strongly bullish after the NFP reaction. The cleaner plan is to wait for a pullback into the 4,136–4,140 buy zone instead of chasing high prices. If this zone holds, the next upside target remains 4,270–4,280.
Will gold retest the buy zone first, or continue directly toward the Fibonacci psychological resistance?
MASON XAUUSD – Trendline Break Confirms Bullish Recovery
XAUUSD is trading around 4,070 after breaking above the descending trendline and recovering above the Ichimoku structure. This breakout changes the short-term structure from bearish pressure into a bullish recovery phase.
The priority view is buy on pullback, as long as gold continues to hold above the broken trendline and the nearest support zone.
Technical View
Gold has broken above the descending trendline that previously capped the upside move. This is an important shift because the market is no longer respecting the same bearish pressure line.
Price is also trading above the Ichimoku support area. The Ichimoku lines are now below price, which means they may act as dynamic support if gold pulls back. As long as price stays above this structure, buyers still have better control in the short term.
The current buy zone around 4,060–4,075 is important because price is testing this area after the breakout. If gold holds here and forms a higher low, the bullish continuation scenario remains valid.
The first upside liquidity area is around 4,114. A clean break above this level may open the way toward Target 1 near 4,155–4,165, which aligns with the Fibonacci 1.618 extension.
If buying pressure continues, the next major liquidity area is around 4,200–4,215, followed by Target 2 near 4,275–4,280, close to the Fibonacci 2.618 extension.
Key Zones
Current price: 4,070
Buy zone: 4,060–4,075
Nearest support: 4,028
Ichimoku support area: 4,016–4,028
Short-term liquidity: 4,114
Target 1: 4,155–4,165
Higher liquidity: 4,200–4,215
Target 2: 4,275–4,280
Invalidation: below 4,009
Trading Plan
Buy Priority: 4,060–4,075
Condition: wait for bullish rejection, higher low formation, or price holding above the broken trendline and Ichimoku support.
SL: below 4,009
TP1: 4,114
TP2: 4,155–4,165
TP3: 4,200–4,215
Final target: 4,275–4,280
Alternative Scenario
If gold breaks above 4,114 directly, wait for a retest of this level as support before looking for continuation toward Target 1.
Sell View
Sell is not the priority while price stays above the broken trendline and Ichimoku support. A sell setup only becomes safer if gold loses 4,028 and breaks back below the Ichimoku structure.
Final View
Overall, gold has confirmed a short-term bullish recovery after breaking the trendline. The cleaner plan is to wait for price to hold the buy zone, then follow the upside structure toward 4,114, 4,155, and potentially 4,275.
Will gold hold the buy zone and continue toward Target 1, or retest the Ichimoku support first?
TCS Monthly | Below 200 EMA — 15-Year Trendline Meets 0.786 FibOverview
Tata Consultancy Services — India's largest IT company by market cap — is at one of the most significant technical junctions in its entire listed history. On the Monthly timeframe, TCS has broken below its 200 Monthly EMA and is now in a deep Fibonacci retracement, approaching a confluence of two major long-term support structures.
This is a long-term view. The analysis covers price action spanning over 15 years.
The Fibonacci Structure
The Fibonacci retracement is drawn from the all-time high of ₹4,592 (0) to the major base of ₹1,072 (1) — a complete measurement of TCS's entire bull run.
Key levels:
0.236 — ₹3,761 (broken)
0.382 — ₹3,247 (broken)
0.5 — ₹2,832 (broken)
0.618 — ₹2,417 (broken)
0.786 — ₹1,826 (next major support)
Current price at ₹1,982 has already broken through the 0.618 level — a deep retracement level that typically signals either strong long-term buying opportunity or a fundamental structural shift.
The 200 Monthly EMA — A Rare Signal
TCS is currently trading below its 200 Monthly EMA at ₹2,087. This is an extremely rare occurrence for a quality large-cap stock of TCS's caliber. Historically, price trading below the 200 monthly EMA signals a major long-term trend shift and typically attracts significant institutional attention — either for accumulation or further distribution.
The Critical Confluence — 15-Year Trendline + 0.786 Fibonacci
The most important element on this chart is the convergence of two independent structures:
🟢 15-Year Rising Trendline — connecting the lows from 2011 all the way to present. This trendline has held through multiple market cycles — COVID crash, global selloffs, and sector rotations.
🟡 0.786 Fibonacci level at ₹1,826 — the deepest standard Fibonacci retracement level before a full 100% retracement.
Both of these meet at approximately the ₹1,826–1,900 zone — making this the most critical support area on TCS's entire chart history.
Key Levels
🔴 Resistance 1 — 3,342
🔴 Resistance 2 — 3,477
🔴 Resistance 3 — 3,647
🔴 Resistance 4 — 4,310
🟡 200 Monthly EMA — 2,087 (now resistance)
🟢 Current Price — 1,982
🟢 Major Confluence Support — 1,826 (0.786 Fib + 15-Year Trendline)
🔴 Full Retracement Base — 1,072
Two Scenarios
🟢 Scenario A — Confluence Holds
Price reaches the ₹1,826–1,900 confluence zone and finds strong long-term buyers. This would represent one of the best risk-reward buying opportunities in TCS's history — with the 15-year trendline and 0.786 Fib acting as dual support. First recovery target would be reclaiming the 200 Monthly EMA at ₹2,087, then progressively higher resistance levels.
🔴 Scenario B — Confluence Breaks
If price breaks below ₹1,826 on a monthly closing basis, both the 15-year trendline and the 0.786 Fibonacci support fail simultaneously. This would be a historically significant breakdown — signaling a fundamental long-term structural change for TCS. Next reference level would be the full retracement base near ₹1,072.
Important Context
This analysis is on the Monthly timeframe — each candle represents one full month of price action. Setups on this timeframe play out over months to years, not days. This is not a short-term trade setup — it is a long-term structural view for investors and positional traders.
TCS results are due soon — fundamental developments will interact with these technical levels. Always combine technical analysis with fundamental context before making decisions.
Conclusion
TCS is approaching a historic confluence — a 15-year rising trendline meeting the 0.786 Fibonacci retracement at ₹1,826. Whether this level holds or breaks will define TCS's long-term trajectory for years to come.
This is a level worth watching very carefully over the coming months.
For educational purposes only. Not financial advice. Always manage your risk.