Education

 Education

 Education

 Education

 Long
Long
How Digital Businesses Build Sustainable and Scalable EarningsUnderstanding the Nature of E-Commerce Profits
Unlike traditional brick-and-mortar businesses, e-commerce operates with lower physical infrastructure costs but higher digital and logistics complexity. Profits are derived from the difference between revenue and total costs, which include product sourcing, platform maintenance, marketing, fulfillment, customer service, and technology investments. The key advantage of e-commerce lies in scalability: once systems are built, businesses can increase sales volume without a proportional increase in fixed costs, allowing profit margins to expand over time.
However, this scalability is offset by intense competition and price transparency. Consumers can compare prices instantly, pressuring sellers to operate efficiently. As a result, e-commerce profits depend less on simple markups and more on optimizing the entire value chain—from supplier negotiations to last-mile delivery.
Revenue Drivers in E-Commerce
E-commerce profits begin with strong revenue generation. This is driven by multiple factors, including product selection, pricing strategy, customer acquisition, and repeat purchases. Successful e-commerce companies focus on high-demand products with favorable margins, whether through private labeling, exclusive sourcing, or differentiated offerings.
Pricing strategies play a crucial role. Dynamic pricing, bundling, subscription models, and personalized discounts help maximize revenue per customer. Additionally, increasing average order value through cross-selling and upselling directly improves profitability without increasing marketing costs. Repeat customers are particularly valuable, as the cost of acquiring them is already sunk, making subsequent purchases more profitable.
Cost Structure and Margin Management
Managing costs is central to e-commerce profitability. The main cost components include cost of goods sold (COGS), digital marketing expenses, logistics and fulfillment, platform fees, and customer support. Businesses that can negotiate better supplier terms, source directly from manufacturers, or build strong private brands often enjoy higher gross margins.
Marketing costs are one of the largest challenges. Paid advertising on search engines and social media has become increasingly expensive, compressing margins. Profitable e-commerce businesses balance paid acquisition with organic channels such as search engine optimization (SEO), content marketing, email marketing, and community building. Over time, reducing dependency on paid ads significantly improves net profits.
Logistics efficiency is another major profit lever. Optimizing warehousing, inventory management, packaging, and shipping reduces costs and improves delivery speed, which in turn boosts customer satisfaction and retention. Companies that master supply chain efficiency often outperform competitors even in low-margin categories.
Role of Technology and Data in Profit Optimization
Technology is a powerful driver of e-commerce profits. Advanced analytics help businesses understand customer behavior, forecast demand, manage inventory, and personalize marketing. Data-driven decision-making allows firms to allocate resources more efficiently, reduce waste, and improve conversion rates.
Automation also plays a critical role. Automated order processing, inventory updates, customer support chatbots, and AI-driven recommendations lower operational costs while enhancing the customer experience. As automation increases, profit margins improve due to reduced labor dependency and fewer operational errors.
Customer Lifetime Value and Profit Sustainability
Long-term e-commerce profits depend on maximizing customer lifetime value (CLV). Rather than focusing solely on one-time sales, successful businesses build relationships that encourage repeat purchases and brand loyalty. Loyalty programs, personalized communication, excellent customer service, and consistent product quality all contribute to higher CLV.
Retention-focused strategies are often more profitable than aggressive acquisition campaigns. A small increase in retention rates can lead to a significant rise in profits, as repeat customers typically spend more and require less marketing investment. Sustainable e-commerce profitability is therefore closely tied to trust, brand reputation, and customer experience.
Scaling Profits Through Market Expansion
One of the most attractive aspects of e-commerce is the ability to scale profits by expanding into new markets. Cross-border e-commerce allows businesses to reach global customers without establishing physical stores. While this introduces complexities such as currency management, taxation, and international logistics, the potential profit upside is substantial.
Additionally, expanding product lines, entering adjacent categories, or offering digital products and services can diversify revenue streams and stabilize profits. Many mature e-commerce companies leverage their existing customer base to introduce higher-margin offerings, further enhancing profitability.
Challenges and Risks to E-Commerce Profits
Despite its potential, e-commerce profitability faces several risks. Intense competition can lead to price wars, shrinking margins. Rising customer acquisition costs, increasing logistics expenses, and platform dependency (such as reliance on large marketplaces) can erode profits.
Regulatory changes, data privacy laws, and taxation policies also impact profitability, particularly for cross-border sellers. Cybersecurity risks and operational disruptions can result in financial losses and reputational damage. Profitable e-commerce businesses actively manage these risks through diversification, compliance, and robust technology infrastructure.
Conclusion
E-commerce profits are the result of a complex interplay between revenue growth, cost control, technology adoption, and customer relationship management. While the digital nature of e-commerce enables rapid scaling and global reach, sustained profitability requires strategic discipline and continuous optimization. Businesses that focus on efficient operations, data-driven decisions, strong branding, and long-term customer value are best positioned to generate consistent and growing profits. In an increasingly competitive digital marketplace, e-commerce success is not just about selling more—but about building smarter, leaner, and more resilient profit engines.  Education
Types of Swing Trading: Strategies, Styles, and Market Approach1. Trend-Based Swing Trading
Trend-based swing trading is one of the most widely used and beginner-friendly approaches. This type focuses on identifying an established market trend—uptrend, downtrend, or sideways—and entering trades in the direction of that trend.
In an uptrend, swing traders look to buy during pullbacks or consolidations, expecting the price to resume its upward movement. In a downtrend, traders may short-sell during temporary rallies. The logic behind this method is that trends tend to persist longer than expected due to institutional participation, economic drivers, or strong investor sentiment.
Trend-based swing traders rely heavily on technical indicators such as moving averages, trendlines, MACD, and RSI. The key advantage of this type is higher probability, as trading with the trend reduces the risk of sudden reversals. However, false breakouts and sudden trend changes can pose challenges.
2. Range-Bound Swing Trading
Range-bound swing trading is used when markets lack a clear trend and instead move within a defined price range. In such conditions, prices oscillate between support and resistance levels.
Swing traders using this method aim to buy near support and sell near resistance, repeatedly capitalizing on price reversals within the range. This type is especially effective in stable markets or during periods of low volatility when major economic triggers are absent.
Technical tools such as horizontal support and resistance, Bollinger Bands, and oscillators like RSI and Stochastic are crucial here. The primary risk lies in unexpected breakouts, which can quickly invalidate the trading range. Proper stop-loss placement is essential to manage this risk.
3. Breakout Swing Trading
Breakout swing trading focuses on entering trades when the price breaks out of a consolidation zone, chart pattern, or key resistance/support level. The expectation is that the breakout will lead to strong momentum and sustained movement.
Common breakout structures include triangles, rectangles, flags, wedges, and channels. Traders typically enter positions once volume confirms the breakout, increasing confidence that the move is genuine rather than a false signal.
This type of swing trading can deliver significant gains in a short time, but it carries the risk of false breakouts, where price briefly crosses a level and then reverses sharply. Discipline and confirmation through volume or retests are critical to success in this approach.
4. Pullback Swing Trading
Pullback swing trading is a refinement of trend trading and is highly favored by professional traders. Instead of chasing price momentum, traders wait for a temporary retracement (pullback) within a strong trend and then enter at a better price.
For example, in an uptrend, prices may fall slightly due to profit booking or short-term news. Swing traders look to enter near moving averages or Fibonacci retracement levels, anticipating the continuation of the main trend.
The strength of pullback trading lies in better risk-to-reward ratios, as entries are closer to support. However, distinguishing between a healthy pullback and a trend reversal requires experience and strong analytical skills.
5. Reversal Swing Trading
Reversal swing trading attempts to identify turning points in the market, where an existing trend is about to end and reverse direction. This type is more aggressive and riskier compared to trend-following strategies.
Traders look for signs such as divergence between price and indicators, exhaustion gaps, candlestick reversal patterns, and extreme overbought or oversold conditions. Successful reversal trading can offer large gains, as traders enter near the beginning of a new trend.
However, the difficulty lies in timing. Entering too early can result in losses if the trend continues longer than expected. Therefore, reversal swing trading is best suited for experienced traders with strong risk management.
6. Momentum Swing Trading
Momentum swing trading focuses on stocks or assets showing strong price acceleration backed by high volume. These moves are often driven by earnings announcements, news events, sector rotations, or broader market sentiment.
Swing traders aim to ride the momentum for a few days or weeks until signs of exhaustion appear. Indicators like volume analysis, rate of change (ROC), and relative strength help identify momentum candidates.
This type of swing trading can be highly profitable in volatile markets, but it requires constant monitoring, as momentum can fade quickly once news impact diminishes.
7. Event-Driven Swing Trading
Event-driven swing trading revolves around scheduled or unscheduled events such as earnings results, economic data releases, mergers, policy announcements, or geopolitical developments.
Traders anticipate how the market may react to these events and position themselves accordingly, often combining fundamental insights with technical confirmation. Positions are typically short-term and closed once volatility subsides.
While event-driven trading can generate rapid gains, it also carries higher uncertainty due to unpredictable market reactions. Risk control and position sizing are crucial in this type.
8. Sector and Relative Strength Swing Trading
This type of swing trading focuses on sector rotation and relative performance. Traders identify sectors outperforming the broader market and then select strong stocks within those sectors for swing trades.
The idea is that capital flows into certain industries during specific economic cycles, creating sustained price movements. Relative strength indicators and comparative charts are widely used in this approach.
This method blends macro understanding with technical analysis, offering diversification and consistency. However, sudden shifts in market leadership can impact performance.
Conclusion
Swing trading is not a single strategy but a collection of trading styles, each suited to different market environments and trader personalities. From trend-following and range trading to breakouts, reversals, and event-driven approaches, swing trading offers flexibility and adaptability. The key to long-term success lies in choosing a type that aligns with one’s risk tolerance, time commitment, and analytical strengths, while maintaining strict discipline and risk management. When executed correctly, swing trading can serve as a powerful bridge between short-term speculation and long-term investing.  Long
Long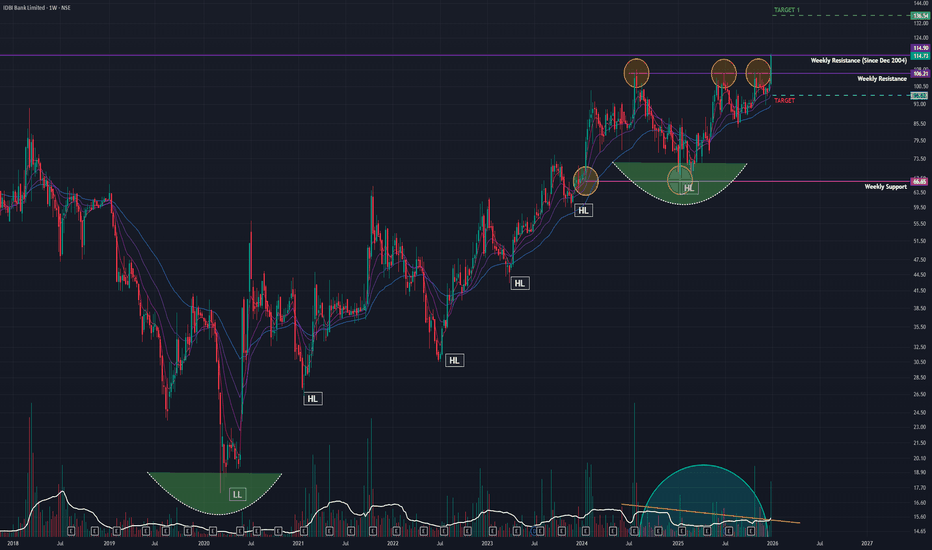
ENTERO: Trendline Breakout From IPO Base, Chart of The WeekFrom IPO Euphoria to Reality Check: Is Entero Healthcare Finding Its Footing at ₹1,000? Last Week, it broke the Trendline after Taking Support on the IPO base. Let's Understand in "Chart of the Week"
As per the Latest SEBI Mandate, this isn't a Trading/Investment RECOMMENDATION nor for Educational Purposes; it is just for Informational purposes only. The chart data used is 3 Months old, as Showing Live Chart Data is not allowed according to the New SEBI Mandate.
Disclaimer: "I am not a SEBI REGISTERED RESEARCH ANALYST AND INVESTMENT ADVISER."
This analysis is intended solely for informational purposes and should not be interpreted as financial advice. It is advisable to consult a qualified financial advisor or conduct thorough research before making investment decisions.
Price Action Analysis:
Overall Trend Structure:
The stock exhibits a classic post-IPO distribution pattern that has transitioned into a prolonged corrective phase. After listing at premium levels, Entero Healthcare established an all-time high of around ₹1,584 in the early trading sessions. Since then, the stock has been in a consistent downtrend, forming a descending channel pattern characterised by lower highs and lower lows.
The current price action at ₹1,123 represents a potential inflexion point, with the stock attempting to reverse from its 52-week low of ₹944. This level has now been tested multiple times, suggesting it may be forming a demand zone.
Base Formation and Consolidation Zones:
A Critical IPO base zone around the ₹950-1,000 level represents the convergence of several technical factors:
- Initial Public Offering pricing memory
- Multiple tests of support over several weeks
- High volume accumulation zone
- Psychological round number support at ₹1,000
The stock spent considerable time between ₹1,100-1,300 during the mid-2025 period, forming what appears to be a distribution zone where early investors and IPO allocates likely exited positions.
Trendline Analysis:
A prominent downtrend line connects the series of lower highs from the peak at ₹1,584 down to current levels. This trendline has acted as dynamic resistance throughout the decline, with multiple failed breakout attempts. The angle of decline suggests aggressive selling pressure that has only recently started to moderate.
The recent price action shows the stock attempting to break above this multi-week downtrend line, which, if successful on sustained volume, could signal a trend reversal.
Current Price Structure:
Recent candlestick patterns show increasing buying pressure:
- Strong bullish candle with 17.95% gain, breaking above recent consolidation
- Price attempting to reclaim the ₹1,100-1,200 zone
- Reduction in selling pressure as evidenced by smaller-bodied bearish candles in recent sessions
Volume Spread Analysis:
Volume Profile:
The volume bar chart at the bottom reveals several critical insights:
Initial listing period showed extremely high volumes (approaching 3M shares), reflecting IPO excitement and allocation distribution. As the stock price declined, volume generally decreased, which is typical of a loss of interest and momentum.
Recent sessions have shown a notable pickup in volume, particularly:
- The current session is showing 2.17M shares traded
- This represents the highest weekly volume since the post-IPO period
- Volume spike coinciding with price bounce from the ₹944 low
Volume-Price Correlation:
The relationship between price and volume provides important context:
- Downtrend was accompanied by declining volume, suggesting weak conviction in the selling
- Recent bounce from ₹944 came with significant volume expansion, indicating institutional or informed buying
- The volume surge at support levels suggests accumulation rather than distribution
- Volume on up days is starting to exceed volume on down days, a positive divergence
Volume at Key Levels:
The IPO base around ₹1,000 has seen sustained high volume, creating a significant support zone. This volume cluster suggests that many participants have established positions at these levels and are likely to defend them.
Key Support and Resistance:
Major Support Levels:
Primary Support: ₹944 - This represents the 52-week low and has been tested multiple times. A breakdown below this level would be technically significant and likely trigger stop losses.
Secondary Support : ₹1,000 (IPO Base) - This psychological level and IPO reference point have provided support during multiple retests.
Tertiary Support: ₹1,100 - This level has acted as both support and resistance during the consolidation phase and represents a minor demand zone.
Major Resistance Levels:
Immediate Resistance: ₹1,200 - This level represents the recent consolidation zone ceiling and the lower boundary of the prior distribution range.
Primary Resistance: ₹1,300 - Strong resistance zone where the stock has repeatedly failed to sustain higher prices. This area coincides with multiple supply zones from earlier in the year.
Major Resistance: ₹1,400 - The upper boundary of the post-IPO distribution range. Breaking above this would negate the bearish structure.
Ultimate Resistance: ₹1,584 (All-Time High) - The peak was established shortly after IPO listing. A move to this level would represent a full recovery.
Downtrend Line Resistance:
The descending trendline connecting the highs currently intersects around the ₹1,150-1,200 zone. This dynamic resistance will need to be convincingly broken for the downtrend to be considered over. The current price action suggests this breakout may be in progress.
Major Technical Patterns:
Falling Wedge (Potential): In the most recent price action, there are early signs of a falling wedge pattern forming, characterised by converging trendlines as the stock makes lower lows with decreasing momentum. This is typically a bullish reversal pattern.
Double Bottom (Forming): The chart shows a potential double bottom pattern with lows around ₹944 separated by several weeks. This pattern would be confirmed on a break above ₹1,200 with volume.
Candlestick Patterns:
Recent price action displays several notable candlestick formations:
- Hammer candles at the ₹944 support level, indicating rejection of lower prices
- Doji candles during consolidation phases, showing indecision
- Today's strong bullish engulfing pattern suggests a momentum shift
- Decreasing size of bearish candles in the downtrend, showing exhaustion
Chart Pattern Implications:
The combination of these patterns suggests:
- Downtrend may be exhausting
- Support at ₹944 is holding firm
- Volume accumulation at lows indicates smart money positioning
- Breaking the downtrend line could trigger technical buying
- A confirmed reversal would target ₹1,300-1,400 initially
Fundamental and Sectoral Backdrop:
Company Overview:
NSE:ENTERO operates as a leading healthcare products distributor in India, ranking among the top three in the sector. Founded in 2018 by promoter Prabhat Agrawal, the company has rapidly scaled its operations through both organic growth and strategic acquisitions.
Business Model and Operations:
Core Business: Distribution and marketing of pharmaceutical and surgical products, including generic formulations, surgical consumables, medical devices, nutraceuticals, biosimilars, and hospital consumables.
Infrastructure: The company operates an extensive distribution network with 101 warehouses across 20 states, serving over 95,300 retail pharmacies and more than 3,600 hospitals.
Growth Strategy: Aggressive expansion through acquisitions. In FY2025 alone, the company acquired stakes in seven distribution entities, including 80% stakes in Avenir Lifecare and Gourav Medical Agencies, and the full acquisition of Suprabhat Pharmaceuticals and Devi Pharma Wellness.
Technology Edge: Utilises a proprietary technology platform for demand fulfilment and supply chain optimisation, positioning itself as a "Healthcare Supply Chain Solutions Specialist."
Financial Performance:
Revenue Growth: Demonstrated strong top-line growth with Q2 FY2025-26 showing 20.1% year-over-year growth and 11.8% quarter-on-quarter increase to ₹5,135 crores.
Market Capitalization: Currently around ₹4,888 crores
Profitability Journey: The company was loss-making from FY2021-2023 but turned profitable in FY2024. For the full year FY2025-2026, profit reached ₹107.43 crores, marking a significant turnaround.
Institutional Interest:
Recent institutional activity indicates growing confidence:
ICICI Prudential Mutual Fund acquired approximately 21.82 lakh shares at ₹950 per share in December 2025, signalling institutional confidence at current levels.
The acquisition was part of bulk deals, with a total transaction value of around ₹207.3 crores, showing significant institutional capital allocation.
This institutional buying coincides with the technical support zone, suggesting smart money accumulation at perceived value levels.
Sectoral Dynamics:
India's Healthcare Distribution Opportunity:
The Indian healthcare sector is experiencing transformative growth, valued at ₹31.87 lakh crores ($372 billion) in 2023 and projected to reach ₹54.67 lakh crores ($638 billion) by 2025, representing a 17.5-22.5% CAGR.
Healthcare spending is increasing from 3.3% of GDP to an expected 5% by 2030, driven by government initiatives, insurance penetration, and rising middle-class healthcare consumption.
Market Structure: The healthcare distribution sector in India remains highly fragmented, with consolidation opportunities. Entero's strategy of acquiring regional distributors aligns with this consolidation trend.
Growth Drivers:
- Expanding hospital infrastructure: Private hospitals adding 4,000+ beds with ₹11,500 crore investments in FY26
- Rising insurance penetration: Over 550 million Indians are now covered under health insurance schemes
- Tier 2 and Tier 3 city expansion: 55-60% of new hospital beds coming from secondary cities
- Ageing population: A Growing elderly demographic requiring chronic disease management
- Medical tourism: Expected to reach $14.31 billion by 2029
Competitive Positioning:
Strengths:
- Pan-India presence with an extensive warehousing network
- Authorised distributor for top pharmaceutical companies
- Strategic relationships with leading corporate hospital chains
- Technology-driven platform providing operational efficiency
- Aggressive growth through acquisitions in a fragmented market
Challenges:
- Capital-intensive business model requiring continuous working capital
- Thin margins are typical of distribution businesses
- Integration risk from multiple acquisitions
- Competition from established distributors and direct distribution by manufacturers
Credit Rating and Financial Health:
India Ratings affirmed Entero Healthcare's issuer rating at IND A-/Stable in December 2025, indicating adequate credit quality with a stable outlook.
Working Capital Intensive: A Significant portion of IPO proceeds (₹600 crores) is allocated for long-term working capital requirements, highlighting the capital-intensive nature of the business.
Strategic Outlook:
The company is well-positioned to benefit from several macro trends:
Healthcare Sector Consolidation: As the industry matures, organised distribution players like Entero will gain market share from fragmented local distributors.
Digital Health Integration: The digital health market is expected to grow at a 24.4% CAGR from 2025-2030, and Entero's technology platform positions it to capitalise on this trend.
Supply Chain Optimisation: Post-pandemic focus on resilient healthcare supply chains favours established distribution networks.
Rural Penetration: Government push for rural healthcare infrastructure creates distribution opportunities beyond metros.
Risk Factors:
Business Risks:
- High dependence on working capital financing
- Potential for inventory obsolescence in pharmaceutical distribution
- Regulatory changes in pharmaceutical pricing and distribution
- Competition from direct-to-pharmacy models by manufacturers
Financial Risks:
- Debt levels from acquisition financing
- Integration challenges from multiple acquisitions
- Margin pressure in a competitive distribution landscape
Key Metrics to Watch:
- EBITDA margin improvement from operational leverage
- Return on capital employed as brownfield expansions mature
- Working capital efficiency and cash conversion cycle
- Market share gains in key geographies
My 2 Cents:
Entero Healthcare is at a critical technical juncture, testing the boundaries of a months-long downtrend. The stock has established a strong support base around ₹944-1,000, coinciding with IPO pricing memories and significant institutional buying. Recent volume surge and price action suggest potential trend reversal, though confirmation requires a sustained break above ₹1,200.
The technical setup presents a balanced risk-reward for traders willing to use tight stops below ₹944, with initial upside targets of ₹1,300-1,400 if the reversal confirms.
From a fundamental perspective, Entero Healthcare operates in a structurally attractive sector with strong tailwinds. The company has demonstrated impressive revenue growth and recently achieved profitability. Its extensive distribution network and strategic acquisitions position it well for continued market share gains in a consolidating industry.
However, investors should note the capital-intensive nature of the business, integration risks from rapid acquisitions, and the need for sustained margin improvement to justify valuations.
The alignment of technical support with institutional buying at ₹950 levels and the strong sectoral backdrop creates an interesting setup. The stock appears to be transitioning from the IPO distribution phase to the potential accumulation phase. For position traders, the current levels offer an entry opportunity with defined risk below ₹944 and potential reward toward ₹1,300-1,400.
The key catalysts to watch include:
- Quarterly results demonstrating margin expansion
- Successful integration of recent acquisitions
- Sustained volume above ₹1,200 confirming trend reversal
- Further institutional accumulation
- Sector-wide tailwinds from healthcare spending growth
The convergence of technical base formation, institutional interest, and strong sectoral dynamics creates a compelling narrative, though investors should remain mindful of execution risks and maintain appropriate position sizing with stop losses.
Full Coverage on my Mid-Week Newsletter coming Wednesday.
Keep in the Watchlist and DOYR.
NO RECO. For Buy/Sell.
📌Thank you for exploring my idea! I hope you found it valuable.
🙏FOLLOW for more
👍BOOST if you found it useful.
✍️COMMENT below with your views.
Meanwhile, check out my other stock ideas on the right side until this trade is activated. I would love your feedback.
As per the Latest SEBI Mandate, this isn't a Trading/Investment RECOMMENDATION nor for Educational Purposes; it is just for Informational purposes only. The chart data used is 3 Months old, as Showing Live Chart Data is not allowed according to the New SEBI Mandate.
Disclaimer: "I am not a SEBI REGISTERED RESEARCH ANALYST AND INVESTMENT ADVISER."
This analysis is intended solely for informational purposes and should not be interpreted as financial advice. It is advisable to consult a qualified financial advisor or conduct thorough research before making investment decisions.  Long
Long
 Long
Long
 Education

Part 9 Trading Master Class Real-World Example (NIFTY)
Suppose NIFTY is at 24,500.
If you expect a big move → Long Straddle
Buy 24,500 call + 24,500 put
High debit, but profits in big move.
If expecting sideways → Iron Condor
Sell 24,700 CE
Buy 24,900 CE
Sell 24,300 PE
Buy 24,100 PE
High probability, low risk.
If moderately bullish → Bull Put Spread
Sell 24,300 PE
Buy 24,100 PE
Credit strategy with limited risk.  Education

CAMS Story Repeating?Hello Traders,
CAMS has now formed similar chart pattern what it had form earlier on 1W Timeframe.
Pattern 1:
We saw a good retractment after rally in 2022. 0.38 was the fibo resistance in this time.
It went in consolidation till Aug 2023, when it finally started showing upmove. During this time, we can also see that Money Flow Index had show breakout but didn't sustained. However, the rally was continued.
Pattern 2:
After making All Time High in late 2024, it retraced and went sideways. And had retraced back till 0.50 fibo level, stronger pull back than the earlier(Pattern 1) pull back which was 0.38. Later it went sideways just like Pattern 1.
Now recently we have seen same MFI pattern of breakout and same like Pattern 1, i.e not sustaining, and not sustaining.
We haven't seen the price wise breakout yet in the stock.
However, there are two more common things here, the belt-hold candles formations in both the pattern 1 and 2.
And the rise and decline in volume.
I will be keeping close eye on this stock. Looks like it may show upmove just like pattern 1.
Note: This post is for information purpose only. Don't consider this as trading or investment recommendation or tip.  Education

 Long
Long
 Long
Long
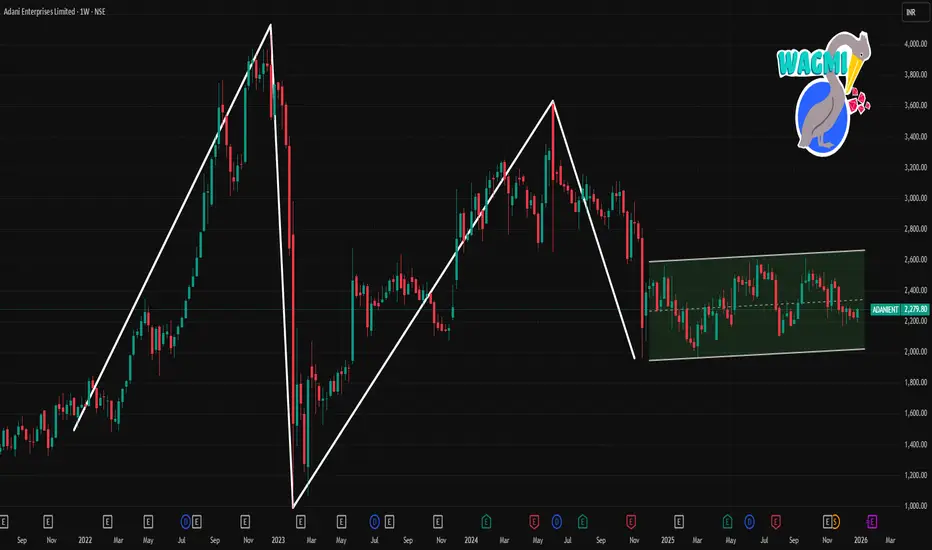
ADANIENT 1 Week Time Frame 📌 Current Price (approx): ~₹2,225-₹2,280 (showing slight variation in live feeds)
📊 Weekly Pivot / Key Levels
Resistance (Upside)
R1: ~₹2,289-₹2,298
R2: ~₹2,298-₹2,314
R3: ~₹2,314-₹2,320+
Pivot: ~₹2,274-₹2,280
Support (Downside)
S1: ~₹2,264-₹2,249
S2: ~₹2,240-₹2,227
S3: ~₹2,216-₹2,200
📈 Weekly Trading Range Expectation
✔ Bullish Break: Clear weekly close above ~₹2,298-₹2,314 would validate bullish momentum and open room toward higher resistance (~₹2,320+).
✔ Bearish Breakdown: Weekly close below ~₹2,227-₹2,216 suggests deeper corrective action toward lower supports.
📌 Trading Implications This Week
Bullish scenario:
Hold above pivot (~₹2,274-₹2,280)
Push through R1/R2 (~₹2,289-₹2,298) and target R3 (~₹2,314+)
Bearish scenario:
Failure to hold pivot/support zone (~₹2,240-₹2,227)
Risk to S2-S3 (~₹2,216 and below)  Long
Long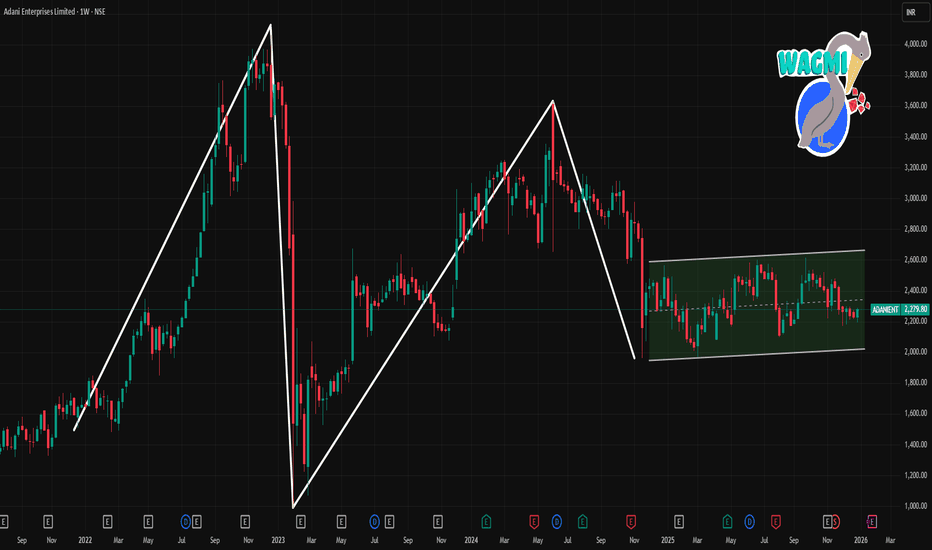
 Long
Long
Outlook Cycle SecretsUnderstanding Market Phases and Strategic Opportunities:
1. What Is an Outlook Cycle?
An outlook cycle represents the forward-looking expectations of market participants.
Markets do not react to current data alone; they price in future expectations.
Changes in outlook often occur before changes appear in economic data.
This makes outlook cycles critical for timing investments and trades.
2. The Four Core Phases of the Outlook Cycle
Most outlook cycles move through four broad stages:
Recovery
Expansion
Peak
Contraction
Each phase has unique characteristics in growth, inflation, earnings, and asset performance.
3. Recovery Phase – The Hidden Opportunity
Begins after a recession or major slowdown.
Economic data looks weak, but the outlook starts improving.
Central banks usually maintain low interest rates and provide liquidity.
Equity markets often rise sharply despite negative news.
The secret: Markets turn up when conditions feel worst.
4. Expansion Phase – Confidence Builds
Growth becomes visible in data like GDP, employment, and earnings.
Business investment increases and consumer spending strengthens.
Risk appetite rises; investors move into equities and growth assets.
Volatility remains low, creating a sense of stability.
The secret: Returns continue, but risks quietly build.
5. Peak Phase – Optimism Turns Excessive
Growth appears strong, and optimism reaches extremes.
Inflation pressures rise, forcing central banks to tighten policy.
Valuations become stretched; leverage increases.
Markets may still rise, but gains slow and volatility increases.
The secret: The best news often appears near market tops.
6. Contraction Phase – Fear Dominates
Economic slowdown or recession becomes evident.
Earnings decline and unemployment rises.
Liquidity tightens and asset prices fall.
Sentiment turns extremely negative.
The secret: This phase plants the seeds for the next recovery.
7. Why Outlook Cycles Lead Economic Data
Markets are discounting mechanisms, not mirrors of reality.
Investors react to changes in expectations, not absolute levels.
A slowing rate of decline can be bullish.
A slowing rate of growth can be bearish.
The secret: Direction matters more than current conditions.
8. Role of Central Banks in Outlook Cycles
Interest rate policy heavily influences cycle transitions.
Rate cuts often signal recovery, even if growth is weak.
Rate hikes often signal peaks, even if growth looks strong.
Liquidity injections boost asset prices before real growth improves.
The secret: Follow liquidity, not headlines.
9. Inflation’s Position in the Outlook Cycle
Inflation usually rises late in the expansion phase.
Falling inflation can support markets during early recovery.
Unexpected inflation shocks can shorten cycles.
Asset performance varies significantly with inflation trends.
The secret: Disinflation can be bullish even in weak economies.
10. Asset Performance Across Outlook Cycles
Equities perform best in recovery and early expansion.
Commodities peak during late expansion.
Bonds perform best during contraction and early recovery.
Cash gains value when volatility spikes.
The secret: Asset rotation outperforms static allocation.
11. Sector Rotation as a Cycle Indicator
Early cycle: Financials, Industrials, Small Caps.
Mid cycle: Technology, Consumer Discretionary.
Late cycle: Energy, Materials.
Recession: Utilities, Healthcare, Staples.
The secret: Sector leadership reveals where the cycle stands.
12. Sentiment as a Cycle Tool
Extreme pessimism often signals cycle bottoms.
Extreme optimism often signals cycle peaks.
Indicators include volatility indices, fund flows, and surveys.
Sentiment often turns before prices reverse.
The secret: Crowds are usually late.
13. Earnings and the Outlook Cycle
Earnings expectations lead actual earnings.
Markets fall when earnings growth slows, not when earnings decline.
Earnings recoveries begin while news remains negative.
The secret: Watch revisions, not results.
14. Global Outlook Cycles and Interconnections
Different countries can be in different cycle phases.
Capital flows move toward stronger outlook regions.
Currency strength often reflects cycle positioning.
Global diversification smooths cycle risks.
The secret: Cycles are global but not synchronized.
15. Psychological Traps in Outlook Cycles
Fear causes investors to exit near bottoms.
Greed causes overexposure near peaks.
Recency bias distorts outlook judgment.
Discipline is harder at turning points.
The secret: Emotional control is a competitive advantage.
16. Using Outlook Cycles for Risk Management
Reduce leverage near late-cycle phases.
Increase diversification when volatility is low.
Protect capital during contraction phases.
Prepare watchlists during downturns.
The secret: Survival matters more than short-term returns.
17. Outlook Cycles in Trading vs Investing
Traders focus on shorter sub-cycles within the main cycle.
Investors focus on major cycle transitions.
Both benefit from understanding macro direction.
Timing improves when outlook aligns with strategy.
The secret: Time horizon defines cycle relevance.
18. Technology and Faster Outlook Cycles
Information spreads faster, shortening cycles.
Algorithmic trading accelerates reactions.
Volatility spikes are sharper but shorter.
Long-term cycles still exist despite noise.
The secret: Noise increases, but structure remains.
19. Common Myths About Outlook Cycles
Myth: Cycles are perfectly predictable.
Myth: This time is always different.
Myth: Strong economies guarantee strong markets.
Reality: Cycles rhyme, not repeat.
The secret: Probabilities matter more than certainty.
20. Final Secret of the Outlook Cycle
The true power of outlook cycles lies in anticipation, not prediction.
Successful participants align strategy with cycle phase.
Flexibility outperforms rigid beliefs.
Patience and discipline compound returns over time.
Ultimate secret: Those who understand cycles react early, while others react emotionally.
Conclusion
The Outlook Cycle Secret is not about forecasting exact tops or bottoms, but about recognizing where expectations are shifting. Markets reward those who act when evidence is subtle and punish those who wait for confirmation. By understanding the phases, psychology, and signals of outlook cycles, investors and traders gain a durable edge—one that transcends market noise and short-term uncertainty.  Education
Turning Good Plans into High-Performance SystemsStrategy Optimization Guide:
Strategy optimization is the disciplined process of refining a plan, method, or system to achieve the best possible outcomes under real-world constraints. Whether applied to business, trading, investing, operations, or personal performance, optimization is not about finding a “perfect” strategy, but about continuously improving effectiveness, efficiency, and adaptability. In an environment defined by uncertainty, competition, and rapid change, optimized strategies are the difference between consistent success and repeated failure.
At its core, strategy optimization bridges the gap between theory and execution. Many strategies look powerful on paper, but only those that are stress-tested, measured, and refined over time survive in practice. This guide explains the principles, processes, and mindset required to optimize strategies in a sustainable and scalable way.
1. Understanding Strategy Optimization
Strategy optimization involves improving decision-making rules, resource allocation, timing, and risk controls to maximize desired objectives while minimizing unwanted outcomes. These objectives may include profitability, growth, stability, efficiency, or resilience. Optimization is iterative, meaning it evolves through repeated testing, learning, and adjustment.
Importantly, optimization is context-dependent. A strategy optimized for high-growth markets may fail in volatile or declining conditions. Therefore, optimization must always consider external factors such as market cycles, competition, regulation, technology, and human behavior.
2. Defining Clear Objectives
Every optimization effort begins with clarity. Without well-defined goals, optimization becomes directionless. Objectives should be specific, measurable, and realistic. For example, instead of aiming to “improve performance,” a better objective would be to “increase risk-adjusted returns while reducing maximum drawdowns.”
Clear objectives help in:
Identifying what needs improvement
Selecting appropriate metrics
Avoiding over-optimization
Maintaining long-term alignment
Optimization should never sacrifice core objectives for short-term gains. A strategy that generates high returns but exposes you to unacceptable risk is not truly optimized.
3. Identifying Key Variables and Constraints
Every strategy operates within constraints such as capital, time, risk tolerance, liquidity, skills, and regulations. Optimization requires identifying which variables have the greatest impact on performance. These may include entry and exit rules, position sizing, frequency of execution, diversification levels, or operational processes.
Understanding constraints is equally important. Constraints define what is possible and prevent unrealistic expectations. Effective optimization works within constraints rather than attempting to eliminate them.
4. Data Collection and Performance Measurement
Optimization without data is guesswork. Reliable data allows you to evaluate what is working and what is not. Historical performance data, simulations, and real-time results provide insights into strengths and weaknesses.
Key performance metrics often include:
Consistency of results
Risk-to-reward ratio
Volatility and drawdowns
Efficiency and cost metrics
Win/loss distribution
The goal is not just higher returns, but better quality returns—those achieved with controlled risk and repeatability.
5. Testing and Validation
One of the most critical steps in optimization is testing. Backtesting, forward testing, and scenario analysis help validate whether improvements are genuine or merely random outcomes. Testing should cover different conditions, including stress scenarios, to ensure robustness.
A common mistake is curve-fitting—over-adjusting a strategy to past data until it looks perfect but fails in live conditions. True optimization improves adaptability and resilience, not just historical performance.
6. Risk Management as a Core Pillar
No strategy is optimized without strong risk management. Optimization should aim to control downside risk before enhancing upside potential. Risk management includes defining acceptable losses, managing exposure, diversifying intelligently, and planning for worst-case scenarios.
An optimized strategy survives adverse conditions and remains operational during periods of uncertainty. Longevity is a powerful competitive advantage.
7. Continuous Improvement and Feedback Loops
Strategy optimization is not a one-time activity. Markets, businesses, and environments evolve, and strategies must evolve with them. Continuous monitoring and feedback loops allow for timely adjustments.
Regular reviews help identify:
Structural changes in the environment
Deterioration in performance
Emerging opportunities
Behavioral biases influencing decisions
Incremental improvements over time often outperform radical changes made infrequently.
8. Psychological and Behavioral Factors
Human behavior plays a major role in strategy execution. Even a well-optimized strategy can fail if emotional discipline is lacking. Fear, greed, overconfidence, and impatience often lead to deviations from the plan.
Optimization must account for psychological comfort. A strategy that aligns with the user’s temperament is more likely to be followed consistently. Simplicity, clarity, and rule-based execution enhance discipline and reduce emotional errors.
9. Balancing Simplicity and Complexity
While advanced models and tools can improve performance, excessive complexity often reduces reliability. Optimized strategies tend to balance sophistication with simplicity. Each added rule or parameter should provide meaningful value.
Simplicity improves transparency, execution speed, and adaptability. Complexity should only be introduced when it clearly enhances performance without increasing fragility.
10. Long-Term Perspective and Sustainability
True optimization focuses on sustainability. Short-term success achieved through excessive leverage, risk concentration, or luck is not optimization—it is exposure. A well-optimized strategy compounds results steadily over time.
Long-term optimization emphasizes:
Consistency over frequency
Survival over aggression
Process over outcomes
Learning over prediction
The best strategies are those that remain effective across cycles, not just during favorable conditions.
Conclusion
Strategy optimization is a structured, ongoing process that transforms average ideas into high-performance systems. It requires clarity of objectives, disciplined testing, robust risk management, and continuous learning. Most importantly, it demands patience and humility—the willingness to adapt when conditions change and to improve incrementally rather than chase perfection.
In a world of uncertainty, optimized strategies do not eliminate risk, but they manage it intelligently. They do not promise certainty, but they offer consistency. Over time, this consistency becomes the foundation for sustainable success, whether in markets, business, or life itself.  Education
The Present and Shaping the Future of Financial MarketsFutures Trading:
Futures trading is one of the most important pillars of modern financial markets. It plays a critical role in price discovery, risk management, speculation, and market efficiency across commodities, equities, currencies, interest rates, and cryptocurrencies. As global markets evolve with technology, regulation, and changing investor behavior, futures trading continues to adapt, making it an essential subject for traders, investors, institutions, and policymakers alike. This detailed explanation explores what futures trading is, how it works, its advantages and risks, and how the future of futures trading is likely to unfold.
What Is Futures Trading?
Futures trading involves buying or selling a standardized contract that obligates the buyer to purchase, and the seller to deliver, an underlying asset at a predetermined price on a specified future date. These contracts are traded on regulated exchanges such as the Chicago Mercantile Exchange (CME), National Stock Exchange (NSE), and others. The underlying asset can be commodities like crude oil, gold, and agricultural products; financial instruments like stock indices and bonds; currencies; or even newer assets like cryptocurrencies.
Unlike spot trading, where assets are exchanged immediately, futures trading focuses on future delivery. However, in practice, most futures contracts are not held until expiration. Traders usually square off their positions before maturity, profiting or losing based on price movements.
How Futures Trading Works
Futures contracts are standardized in terms of quantity, quality, and expiration dates, which ensures liquidity and transparency. Traders are required to deposit a margin, which is a small percentage of the total contract value, to enter a position. This margin system enables leverage, allowing traders to control large positions with relatively small capital.
Prices of futures contracts fluctuate based on supply and demand dynamics, macroeconomic data, interest rates, geopolitical events, and market sentiment. Gains and losses are marked to market daily, meaning profits or losses are credited or debited to the trader’s account at the end of each trading session.
Participants in Futures Markets
There are two main categories of participants in futures trading. Hedgers use futures contracts to protect themselves against adverse price movements. For example, a farmer may sell agricultural futures to lock in a price for crops, while an airline may buy crude oil futures to hedge fuel costs. Speculators, on the other hand, seek to profit from price fluctuations. They add liquidity to the market and help improve price discovery, though they also take on higher risk.
Institutional investors, proprietary trading firms, retail traders, and algorithmic traders all play increasingly significant roles in futures markets today.
Advantages of Futures Trading
One of the biggest advantages of futures trading is leverage. Traders can gain exposure to large positions with limited capital, potentially amplifying returns. Futures markets are also highly liquid, especially in popular contracts, allowing easy entry and exit. Transparency is another major benefit, as prices are publicly available and regulated by exchanges.
Futures trading is also cost-effective, with relatively low transaction costs compared to other financial instruments. Additionally, the ability to go long or short with equal ease makes futures suitable for both rising and falling markets.
Risks Involved in Futures Trading
Despite its benefits, futures trading carries significant risks. Leverage can magnify losses just as easily as it amplifies gains. A small adverse price movement can lead to substantial losses and margin calls. Futures markets can also be highly volatile, influenced by sudden economic data releases, geopolitical tensions, or policy decisions.
Emotional trading, lack of discipline, and inadequate risk management are common reasons traders fail in futures markets. Therefore, proper position sizing, stop-loss strategies, and a deep understanding of the underlying asset are essential.
Role of Technology in Futures Trading
Technology has transformed futures trading over the past few decades. Electronic trading platforms have replaced open outcry systems, enabling faster execution and global access. Algorithmic and high-frequency trading now account for a large share of futures market volume, improving liquidity but also increasing complexity.
Advanced charting tools, real-time data feeds, artificial intelligence, and machine learning models are shaping how traders analyze markets and execute strategies. Automation has reduced human error and improved efficiency, making futures trading more accessible to retail participants.
Regulatory Evolution and Market Stability
Regulation plays a crucial role in shaping the future of futures trading. Regulatory bodies aim to ensure transparency, reduce systemic risk, and protect market participants. Margin requirements, position limits, and reporting standards are continuously updated to reflect market realities.
As markets become more interconnected globally, regulators are also focusing on cross-border cooperation. Strong regulation is essential to maintain confidence and stability, especially as new asset classes and trading technologies emerge.
The Future of Futures Trading
The future of futures trading is expected to be shaped by innovation, globalization, and diversification. New futures contracts based on emerging assets such as cryptocurrencies, carbon credits, electricity, and data-related products are likely to gain popularity. Environmental, social, and governance (ESG) factors may also influence the development of new futures instruments.
Increased participation from retail traders, particularly in emerging markets like India, will continue to expand futures market depth. Education, digital platforms, and mobile trading applications are lowering entry barriers and democratizing access to futures trading.
Artificial intelligence and big data analytics are expected to play an even larger role in strategy development, risk assessment, and market forecasting. At the same time, risk management will remain the cornerstone of successful futures trading, as volatility and uncertainty are inherent to financial markets.
Conclusion
Futures trading is a powerful and versatile financial tool that serves multiple purposes, from hedging and speculation to price discovery and market efficiency. While it offers significant opportunities, it also demands discipline, knowledge, and respect for risk. As technology advances, regulations evolve, and new asset classes emerge, futures trading will continue to grow in importance and complexity.
Understanding futures trading today is not just about learning how contracts work, but about preparing for a future where markets are faster, more interconnected, and driven by both human insight and intelligent systems. For those willing to learn, adapt, and manage risk wisely, futures trading will remain a vital pathway to participating in the global financial ecosystem. Education