Part 2 Support and ResistanceOption Buyer vs Option Seller
Understanding their difference is crucial:
A. Option Buyer
Pays premium.
Limited risk (only the premium).
Unlimited profit potential in Calls.
High reward in Puts with limited risk.
Needs significant movement to make money.
B. Option Seller
Receives premium upfront.
Limited profit (only the premium).
High risk due to market movement.
High probability of profit (70–80% in range markets).
Requires margin.
Option selling is considered more stable, but ris
Trend Line Break
Part 1 Support and ResistanceHow Option Premium Works
When you buy an option, you pay a premium.
When you sell an option, you receive it.
The premium is influenced by:
i. Intrinsic Value
The real value if exercised now.
For Calls: Max(0, Spot – Strike)
For Puts: Max(0, Strike – Spot)
ii. Time Value
The extra value based on how much time is left before expiry.
More time → more value.
Closer to expiry → less value.
iii. Volatility
Higher volatility increases option premiums because prices may move dramatically.
iv
Part 11 Trading Master Class What Are Options?
An option is a contract between two parties:
Buyer (holder) – Pays a premium for rights.
Seller (writer) – Receives a premium and carries obligations.
Each option contract is linked to an underlying asset—commonly stocks, indices, commodities, or currencies. In most markets, one option contract represents a lot size (like 50 or 100 units of the underlying).
Options come with two important characteristics:
Strike price: The fixed price at which the underlying can be bought
HINDPETRO 1 Week Time Frame 📌 Latest Price (Reference)
HPCL is trading around ₹474 – ₹490 on NSE recently.
📊 Key Weekly Technical Levels (Support & Resistance)
🟩 Support Levels (Buy Zones)
These are levels where the price may find buying interest this week:
Strong Support: ₹469 – ₹472
Secondary Support: ₹466
Lower Weekly Support: ₹460
Deeper Support (if extended pullback): ₹454 – ₹449 (weekly pivot zone)
👉 If price stabilizes above ₹469, weekly trend remains bullish.
🟥 Resistance Levels (Sell / Barrier Zones)
Levels wh
How Digital Businesses Build Sustainable and Scalable EarningsUnderstanding the Nature of E-Commerce Profits
Unlike traditional brick-and-mortar businesses, e-commerce operates with lower physical infrastructure costs but higher digital and logistics complexity. Profits are derived from the difference between revenue and total costs, which include product sourcing, platform maintenance, marketing, fulfillment, customer service, and technology investments. The key advantage of e-commerce lies in scalability: once systems are built, businesses can increase
Types of Swing Trading: Strategies, Styles, and Market Approach1. Trend-Based Swing Trading
Trend-based swing trading is one of the most widely used and beginner-friendly approaches. This type focuses on identifying an established market trend—uptrend, downtrend, or sideways—and entering trades in the direction of that trend.
In an uptrend, swing traders look to buy during pullbacks or consolidations, expecting the price to resume its upward movement. In a downtrend, traders may short-sell during temporary rallies. The logic behind this method is that tre
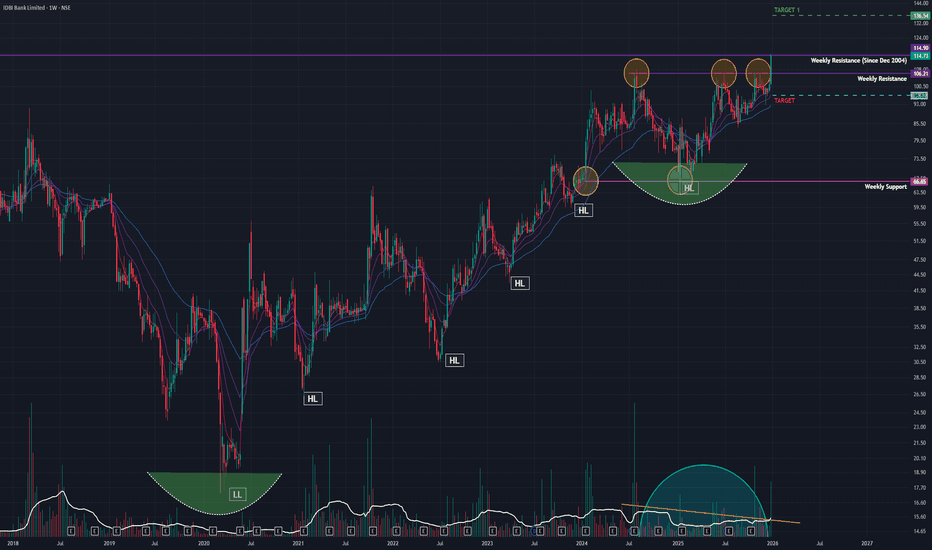
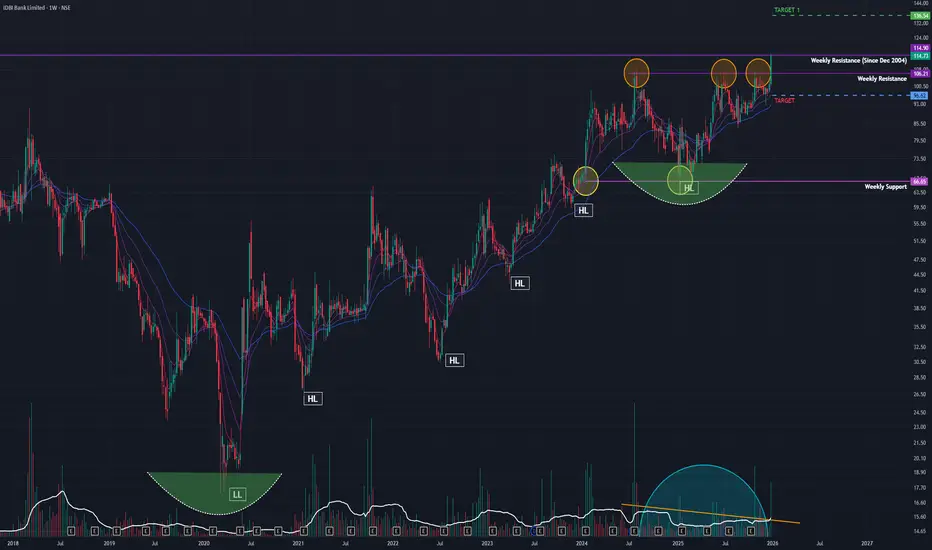
IDBI (W): Aggressive BullishTimeframe: Weekly | Scale: Logarithmic
The stock has confirmed a breakout from a 2-year consolidation phase (₹67–₹107). This move is supported by the highest weekly volume in months .
📈 1. The Chart Structure (The Box Breakout)
> The Consolidation: ₹67 – ₹107 range. The stock spent nearly 24 months in this zone, absorbing all supply.
> The Breakout: This week's close of ₹114.85 (+13%) is a decisive "Jailbreak."
- Significance: Breaking a 2-year base often leads to a trend that la
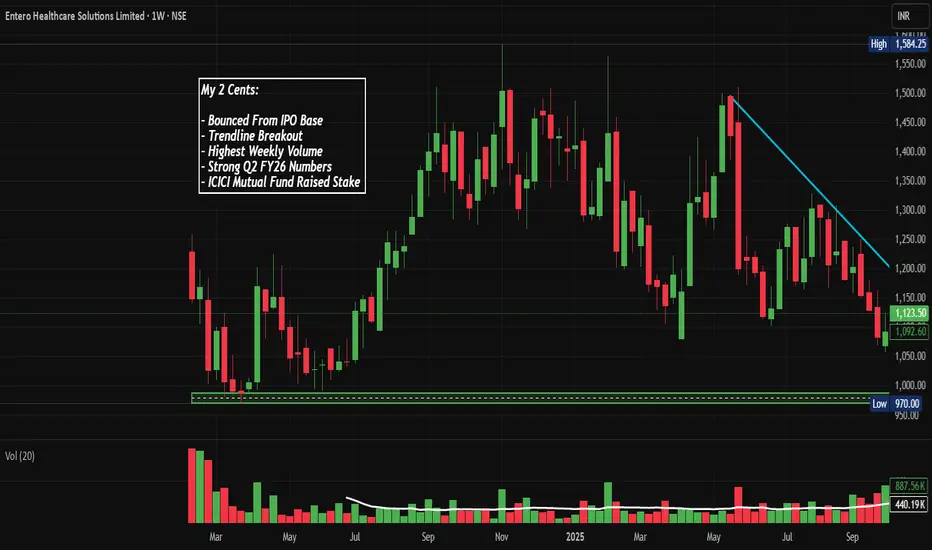
ENTERO: Trendline Breakout From IPO Base, Chart of The WeekFrom IPO Euphoria to Reality Check: Is Entero Healthcare Finding Its Footing at ₹1,000? Last Week, it broke the Trendline after Taking Support on the IPO base. Let's Understand in "Chart of the Week"
As per the Latest SEBI Mandate, this isn't a Trading/Investment RECOMMENDATION nor for Educational Purposes; it is just for Informational purposes only. The chart data used is 3 Months old, as Showing Live Chart Data is not allowed according to the New SEBI Mandate.
Disclaimer: "I am not a SEBI R
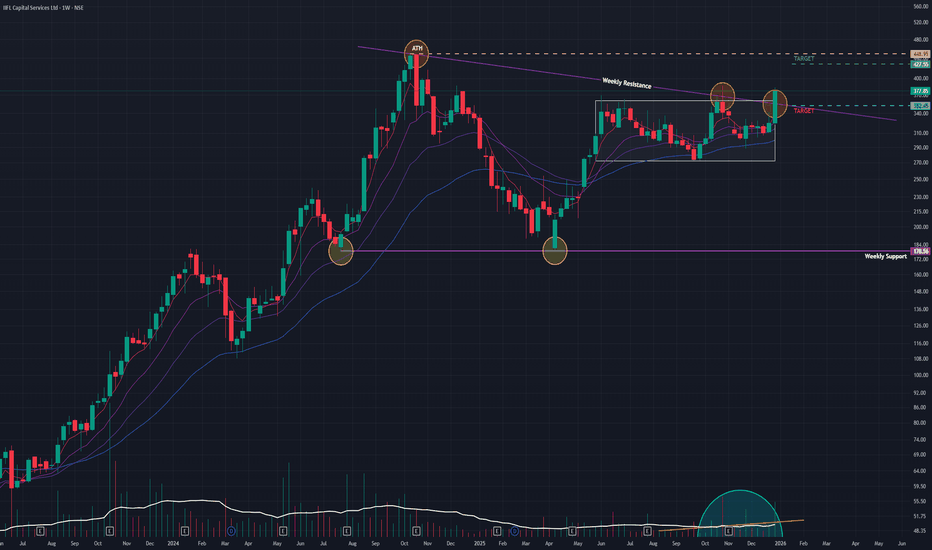
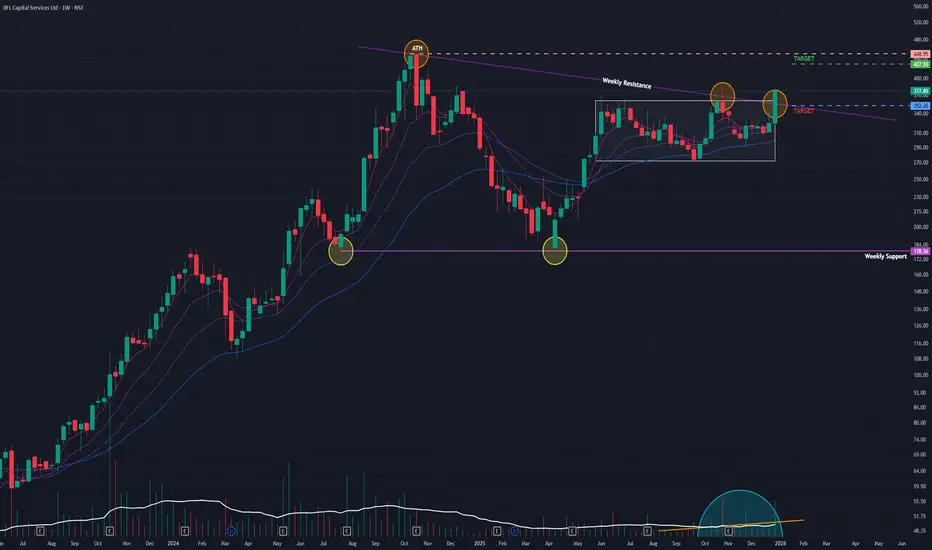
IIFL Capital (W): Aggressive Bullish (Re-rating Breakout)Timeframe: Weekly | Scale: Logarithmic
The stock has confirmed a major breakout from an 8-month consolidation pattern. This move is not just a technical fluctuation; it represents a structural "Re-rating" of the business following its pivot from pure broking to broader capital services.
🚀 1. The Fundamental Catalyst (The "Why")
The surge is driven by a convergence of business transformation and sector strength:
> Strategic Rebranding: The name change to "Capital Services" signals a s
Part 9 Trading Master Class Real-World Example (NIFTY)
Suppose NIFTY is at 24,500.
If you expect a big move → Long Straddle
Buy 24,500 call + 24,500 put
High debit, but profits in big move.
If expecting sideways → Iron Condor
Sell 24,700 CE
Buy 24,900 CE
Sell 24,300 PE
Buy 24,100 PE
High probability, low risk.
If moderately bullish → Bull Put Spread
Sell 24,300 PE
Buy 24,100 PE
Credit strategy with limited risk.
Part 4 Learn Institutional Trading Advanced Adjustments & Risk Management
For professional traders, the real skill is not just entering but managing the trade.
1. Rolling
Move strikes up/down
Shift expiry
Improve risk-to-reward
2. Delta Hedging
Neutralise directional risk by adjusting:
Futures
Opposite options
3. Volatility Adjustments
Changes in IV (implied volatility) affect:
Straddles
Strangles
Calendar spreads
Iron condors
Understanding how volatility affects P&L is essential.
CAMS Story Repeating?Hello Traders,
CAMS has now formed similar chart pattern what it had form earlier on 1W Timeframe.
Pattern 1:
We saw a good retractment after rally in 2022. 0.38 was the fibo resistance in this time.
It went in consolidation till Aug 2023, when it finally started showing upmove. During this time, we can also see that Money Flow Index had show breakout but didn't sustained. However, the rally was continued.
Pattern 2:
After making All Time High in late 2024, it retraced and went sideways. A
Part 3 Learn Institutional Trading Why Advanced Option Strategies Matter
Before exploring the strategies, it is important to understand their purpose:
1. Risk Management
Single-leg options (buying calls/puts) carry unlimited risk (when selling) or high premium cost (when buying). Multi-leg strategies help:
Define maximum risk
Reduce premium outflow
Balance profit zones
2. Volatility Trading
Advanced strategies allow traders to bet for or against volatility:
Straddles/strangles → high volatility expected
Iron condor/butt
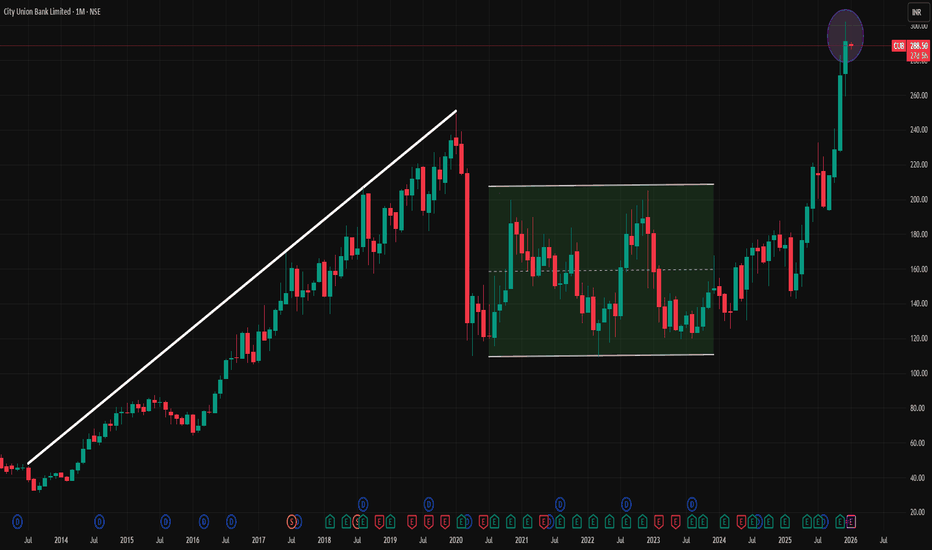
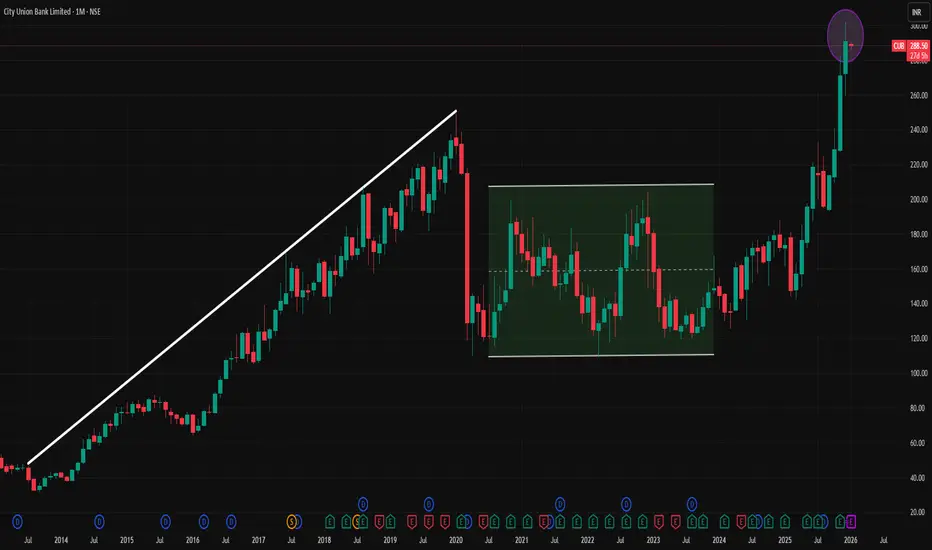
CUB 1 Month Time Frame 📌 Latest Price Context
Current price: Around ₹284–₹290 on NSE (varies by source/time) — markets fluctuate intra‑day.
📈 1‑Month Resistance Levels
These are areas where price often faces supply (selling) pressure:
Resistance Approx. Level (INR) Notes
R1 ~₹290–₹292 Near current cluster resistance.
R2 ~₹295–₹297 Resistance near recent highs & 52‑week top.
R3 ~₹300–₹305 Psychological / upper range breakou
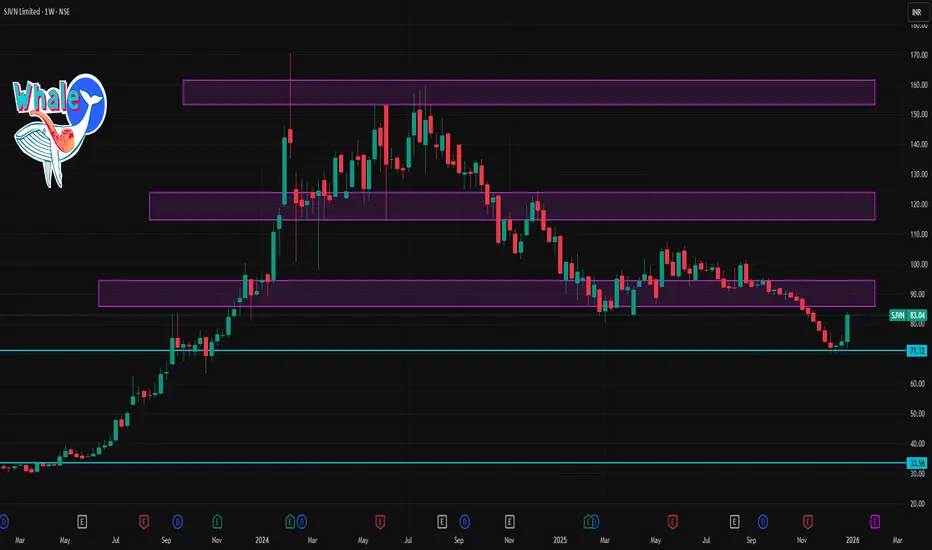
SJVN 1 Week Time Frame 📈 Current Price Context
SJVN is trading around ~₹73–₹83 recently (data varies by source/time — approximate current market level) with volatility around that band.
📌 Practical Weekly Trading Levels
Bullish Scenario (Price Structure)
Bullish threshold: Break & hold above ₹77–₹80 (weekly close)
Next upside zone: ₹83+ weekly resistance
Targets: ~₹83 → ₹88+ if bullish momentum continues
Bearish Scenario
Bearish invalidation: Failure below ₹69
Next lower supports: ~₹65, then ~₹62
Neutral / Range
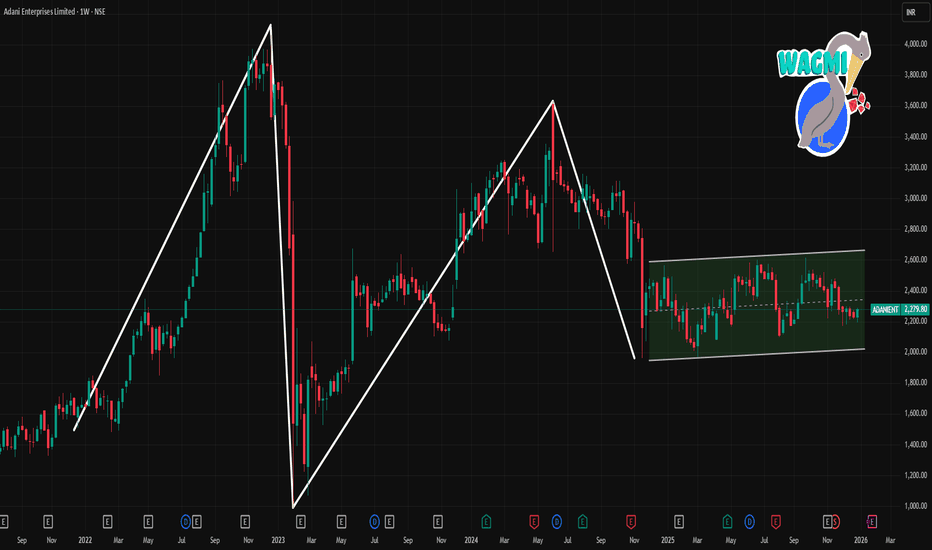
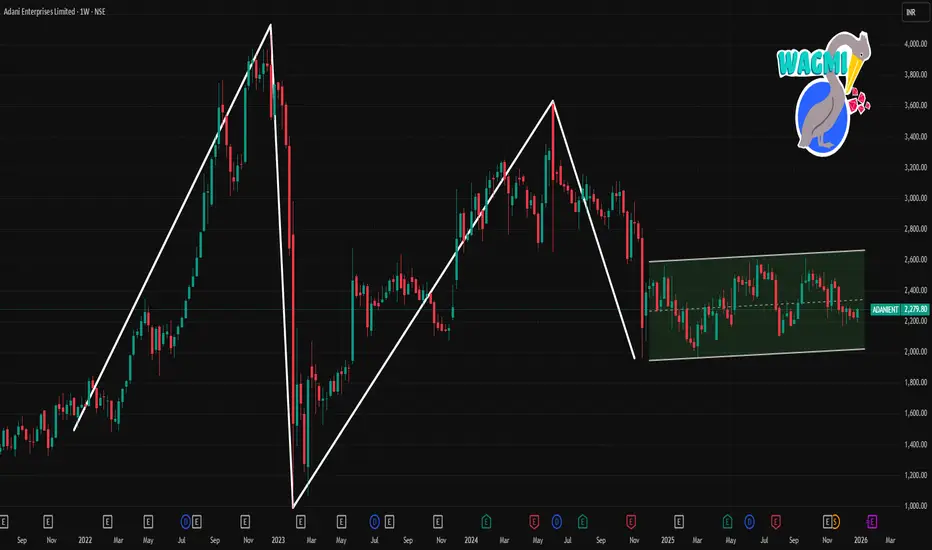
ADANIENT 1 Week Time Frame 📌 Current Price (approx): ~₹2,225-₹2,280 (showing slight variation in live feeds)
📊 Weekly Pivot / Key Levels
Resistance (Upside)
R1: ~₹2,289-₹2,298
R2: ~₹2,298-₹2,314
R3: ~₹2,314-₹2,320+
Pivot: ~₹2,274-₹2,280
Support (Downside)
S1: ~₹2,264-₹2,249
S2: ~₹2,240-₹2,227
S3: ~₹2,216-₹2,200
📈 Weekly Trading Range Expectation
✔ Bullish Break: Clear weekly close above ~₹2,298-₹2,314 would validate bullish momentum and open room toward higher resistance (~₹2,320+).
✔ Bearish Breakdown: Weekly clo
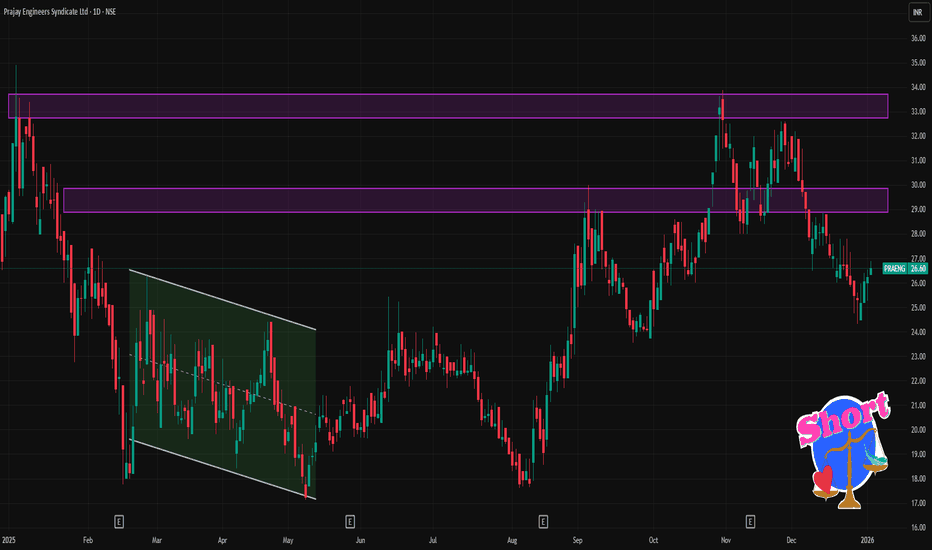
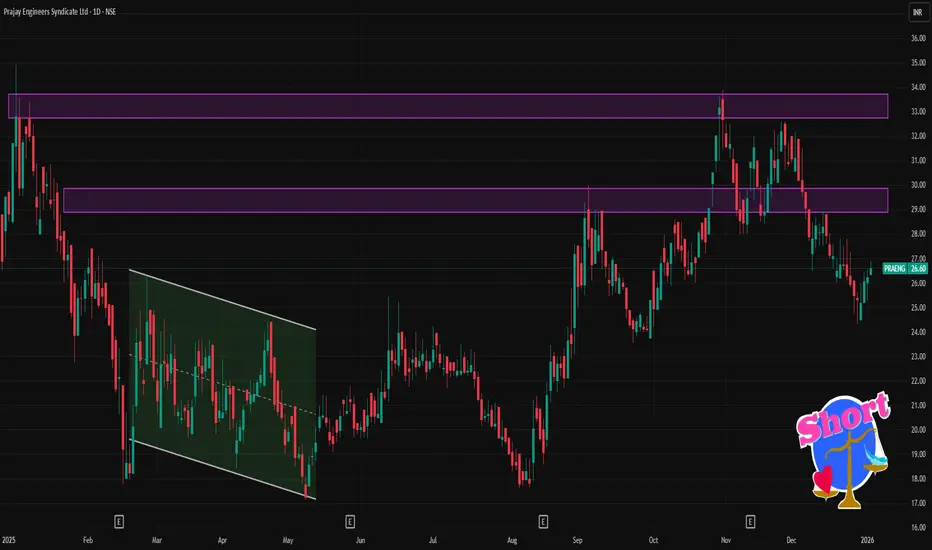
PRAENG 1 Day Time Frame 📈 Current Price Snapshot (Intraday)
Current trading price: ~₹26.6 (approx live price) — showing slight upside from prior close.
Today’s intraday range so far: ₹26.35 – ₹26.90.
📊 1-Day Pivot Levels (Today’s Key Levels)
Classic Pivot Points (based on yesterday’s price action):
Level Price
R3 ~₹27.19
R2 ~₹26.59
R1 ~₹26.30
Pivot (PP) ~₹25.70
S1 ~₹25.41
S2 ~₹24.81
S3 ~₹24.52
📌 Bullish bias if price s
Outlook Cycle SecretsUnderstanding Market Phases and Strategic Opportunities:
1. What Is an Outlook Cycle?
An outlook cycle represents the forward-looking expectations of market participants.
Markets do not react to current data alone; they price in future expectations.
Changes in outlook often occur before changes appear in economic data.
This makes outlook cycles critical for timing investments and trades.
2. The Four Core Phases of the Outlook Cycle
Most outlook cycles move through four broad stages:
Reco
Turning Good Plans into High-Performance SystemsStrategy Optimization Guide:
Strategy optimization is the disciplined process of refining a plan, method, or system to achieve the best possible outcomes under real-world constraints. Whether applied to business, trading, investing, operations, or personal performance, optimization is not about finding a “perfect” strategy, but about continuously improving effectiveness, efficiency, and adaptability. In an environment defined by uncertainty, competition, and rapid change, optimized strategies ar
The Present and Shaping the Future of Financial MarketsFutures Trading:
Futures trading is one of the most important pillars of modern financial markets. It plays a critical role in price discovery, risk management, speculation, and market efficiency across commodities, equities, currencies, interest rates, and cryptocurrencies. As global markets evolve with technology, regulation, and changing investor behavior, futures trading continues to adapt, making it an essential subject for traders, investors, institutions, and policymakers alike. This deta
Technical Analysis and Fundamental AnalysisTwo Pillars of Financial Market Decision-Making
In financial markets, investors and traders are constantly trying to answer one core question: Where is the price going next, and why? To find this answer, two major analytical approaches are widely used—Technical Analysis and Fundamental Analysis. While both aim to identify profitable investment opportunities, they differ significantly in philosophy, tools, time horizons, and decision-making processes. Understanding these two methods—and how they
Part 2 Ride The Big Moves Why Option Trading Is Popular in India
In India, especially in Nifty and Bank Nifty, options dominate:
Weekly expiry gives quick opportunities
Small capital needed for buying
High liquidity
Volatile markets give rapid premium movement
Options have become the go-to tool for traders seeking quick, leveraged returns.
Part 1 Ride The Big MovesOption Buying vs Option Selling
Option Buying
Low risk (limited to premium)
High reward potential
Requires accuracy in direction and timing
Suitable for beginners with small capital
Option Selling
High probability of profit (because time decay works in seller’s favor)
Requires larger capital
Higher risk (unlimited)
Suitable for experienced traders with risk management skills