Trend Line Break
Part 10 Trading Master Class With Experts Common Misconceptions
Options are risky: True if misused, but disciplined traders use them for hedging and risk management.
Only for advanced traders: Basic strategies like covered calls and protective puts are beginner-friendly.
Profits are always quick: Options require understanding market conditions, timing, and volatility.
Regulatory and Market Structure
Options are traded on exchanges (e.g., NSE, CBOE) or over-the-counter (OTC). Exchange-traded options are standardized in terms of stri
XAUUSD H4 – Trading the Uptrend Channel with LiquidityXAUUSD H4 – Trading the Uptrend Channel with Liquidity and Volume Profile
Gold remains bullish on the H4 timeframe and continues to respect a well-defined rising channel. With price approaching extended areas, the higher-probability approach is to buy pullbacks at value zones and treat the upper boundary as a short-term profit-taking area rather than chasing momentum.
TECHNICAL CONTEXT
The uptrend structure is still intact, with price forming higher lows inside the channel.
After a strong im
Part 6 Learn Institutional TradingUnderstanding Options
At its core, an option is a contract. There are two primary types of options:
Call Option – Grants the holder the right to buy an asset at a predetermined price (strike price) within a specific timeframe. Investors buy calls when they expect the underlying asset's price to rise.
Put Option – Grants the holder the right to sell an asset at a predetermined price within a specific timeframe. Investors buy puts when they anticipate a decline in the underlying asset’s price.
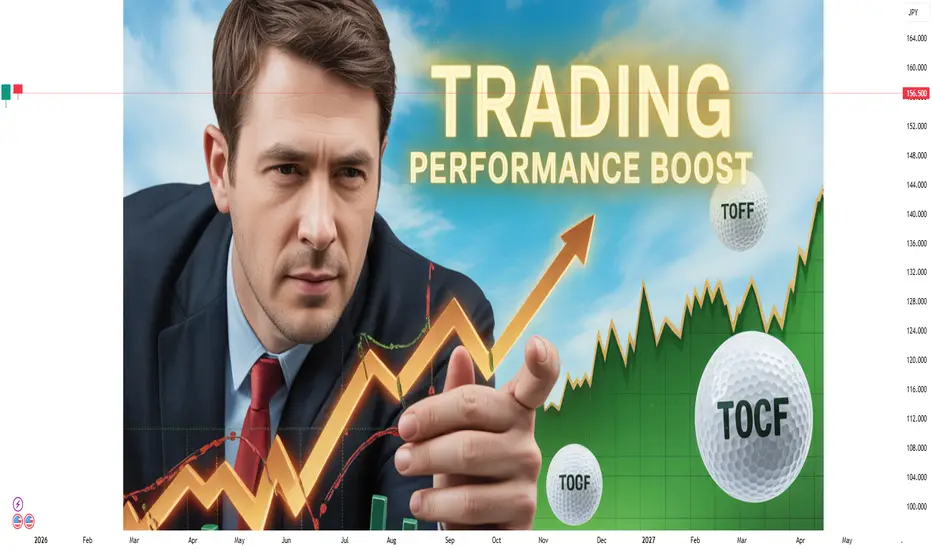
Trading Performance BoostStrategies, Systems, and Mindset for Consistent Market Success
Trading performance is not improved by a single indicator, secret strategy, or occasional big win. A true trading performance boost comes from aligning knowledge, discipline, psychology, risk control, and execution into one structured process. Whether you are a beginner or an experienced trader, the difference between average and exceptional performance lies in how consistently you apply proven principles over time. This comprehensi
Profitable Option StrategiesStructured Approaches to Consistent Returns
Options trading is often seen as complex and risky, but when used strategically, it can become a powerful tool for generating consistent and controlled profits. Profitable option strategies are not about predicting markets perfectly; instead, they focus on probability, risk management, and disciplined execution. Successful traders select strategies based on market conditions such as direction, volatility, and time decay, rather than relying on a singl
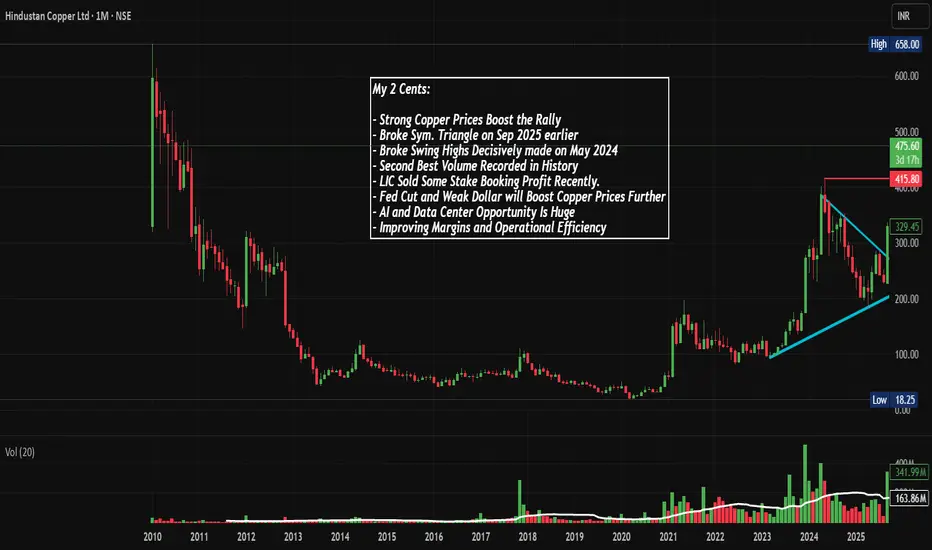
HINDCOPPER: Trendline and Triangle Breakout, Chart of the MonthWhy This NSE:HINDCOPPER Chart Could Signal India's Next Major Commodity Play, even after giving such a robust run so far. Let's Understand in the "Chart of The Month"
As per the Latest SEBI Mandate, this isn't a Trading/Investment RECOMMENDATION nor for Educational Purposes; it is just for Informational purposes only. The chart data used is 3 Months old, as Showing Live Chart Data is not allowed according to the New SEBI Mandate.
Disclaimer: "I am not a SEBI REGISTERED RESEARCH ANALYST AND
Part 3 Learn Institutional Trading What Is an Option?
An option is a financial contract that gives the buyer the right, but not the obligation, to buy or sell an underlying asset at a predetermined price, known as the strike price, on or before a specified date called the expiry date. The seller (or writer) of the option has the obligation to fulfill the contract if the buyer chooses to exercise the option.
Options are traded on various underlying assets, including stocks, indices, commodities, currencies, and ETFs. The price p
Part 1 Ride The Big Moves 1. Hedging
Investors use options to protect their portfolios from adverse price movements. For example, buying a put option on a stock you own acts like insurance against a price fall.
2. Speculation
Options allow traders to speculate on market direction with relatively low capital. A small move in the underlying can lead to a large percentage gain in the option premium.
3. Income Generation
By selling options (such as covered calls), traders can generate regular income in sideways or mildl
Part 1 Intraday Master Class Key Terminologies in Options
Understanding options requires familiarity with certain core concepts:
Strike Price: The price at which the option can be exercised.
Premium: The price paid for the option.
Expiry: The date on which the option contract expires.
Intrinsic Value: The immediate value of an option if exercised now.
Time Value: The portion of the premium attributable to the remaining time until expiry.
Option Trading Strategies Participants in Option Trading
Option trading involves two main participants:
Option Buyers: They pay a premium and have limited risk (the premium paid) with potentially unlimited or substantial profit.
Option Sellers (Writers): They receive the premium and have limited profit potential but can face significant or even unlimited risk, depending on the strategy.
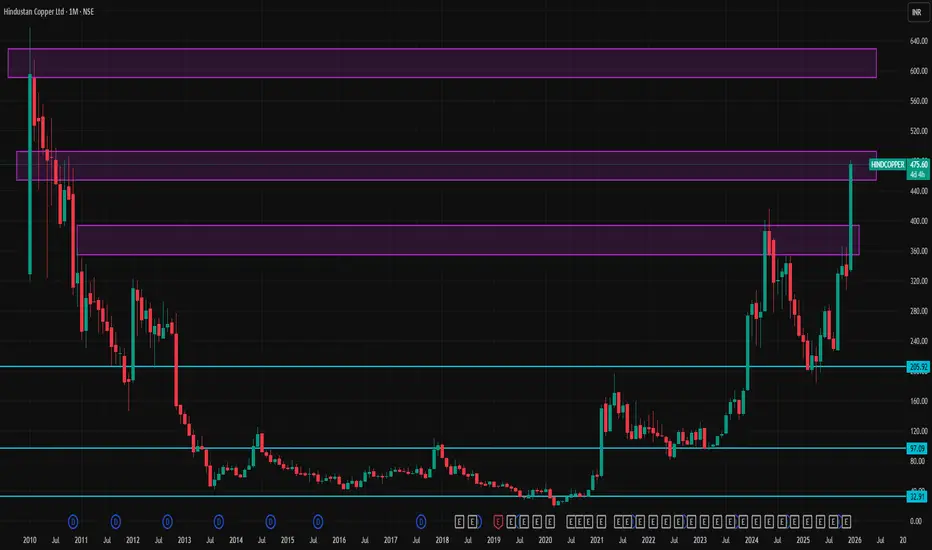
HINDCOPPER 1 Month Time Frame 📌 Current Price (Reference)
The stock is trading near ~₹475–₹480 on NSE/BSE (Dec 2025 close).
📊 Key Levels for ~1‑Month Time Frame
🔵 Bullish / Resistance Levels
These are potential upside barriers where price may slow or reverse:
1. ~₹490–₹495 — Near recent pivot resistance zone.
2. ~₹500–₹505 — Mid‑term resistance zone (psychological/technical).
3. ~₹525–₹530 — Extended upside if momentum remains strong.
Interpretation: If price sustains above ₹490–₹495, it may attempt to test ₹500–₹530. A
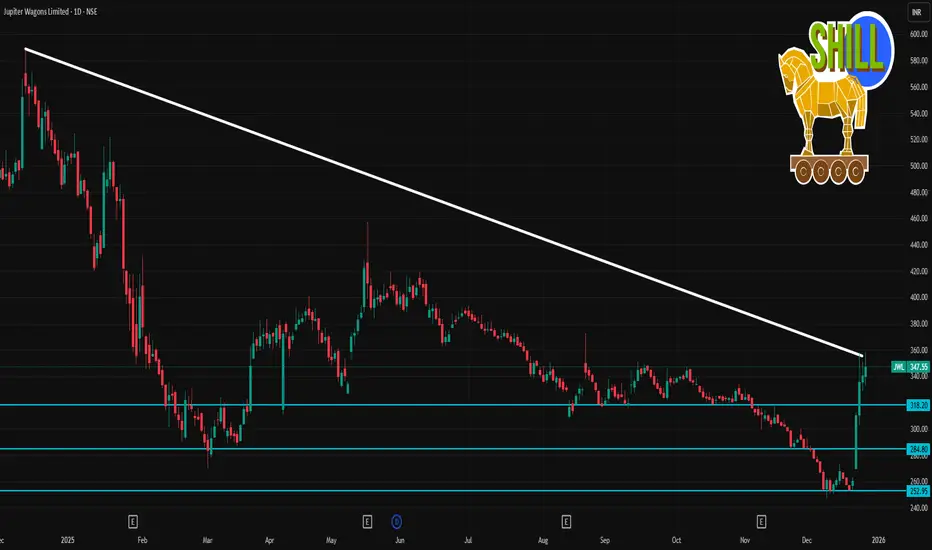
JWL 1 Day Time Frame 📌 Live / Current Price (Market Close)
📍 JWL closed around ₹347.5 (↑ ~2% on the day) on 26 Dec 2025 — this is the latest pricing reference.
📊 Intraday / 1‑Day Technical Levels
🔥 Key Pivot & Levels for Today
(Used for quick intraday setup — support and resistance for 1‑day horizon)
Daily Pivot Points (Classic)
Pivot: ~ ₹335‑340 (approx balance area)
Immediate Support 1: ₹334‑336
Support 2: ₹320‑322
Support 3: ₹308‑310
Resistance 1: ₹359‑360
Resistance 2: ₹371‑372
Resistance 3: ₹384‑385
📌
BANDHANBNK 1 Day Time Frame 📍 Current Price Snapshot
Current Price/Last Close: ~₹147–₹150 range intraday recently.
Day’s Range (recent session): ~₹144.95 (Low) to ~₹150.50 (High).
📈 Daily Support & Resistance Levels
📌 Support Levels (Buy Zones)
🟩 S1: ~₹145–₹146 — first support zone (near recent low).
🟩 S2: ~₹142–₹143 — secondary support zone.
🟩 S3: ~₹140–₹141 — strong support cluster from volume profile.
📌 Resistance Levels (Supply Zones)
🔴 R1: ~₹149–₹150 — near‑term resistance (price has struggled around here).
🔴 R
BSOFT 1 Month Time Frame 📌 Current Price Context
Birlasoft is trading around ₹445 – ₹450 on NSE in late December 2025.
📊 1‑Month Key Levels (Support & Resistance)
🔹 Immediate Resistance (Upside)
1. **₹455 – ₹458 ** – near recent short‑term highs / minor supply zone.
2. **₹461 – ₹466 ** – next resistance cluster.
3. ₹470 + – higher supply, medium‑term breakout zone.
📌 Resistance levels above ₹450 indicate where selling pressure has appeared in recent sessions.
🔸 Immediate Support (Downside)
1. **₹445 – ₹441 ** – fi
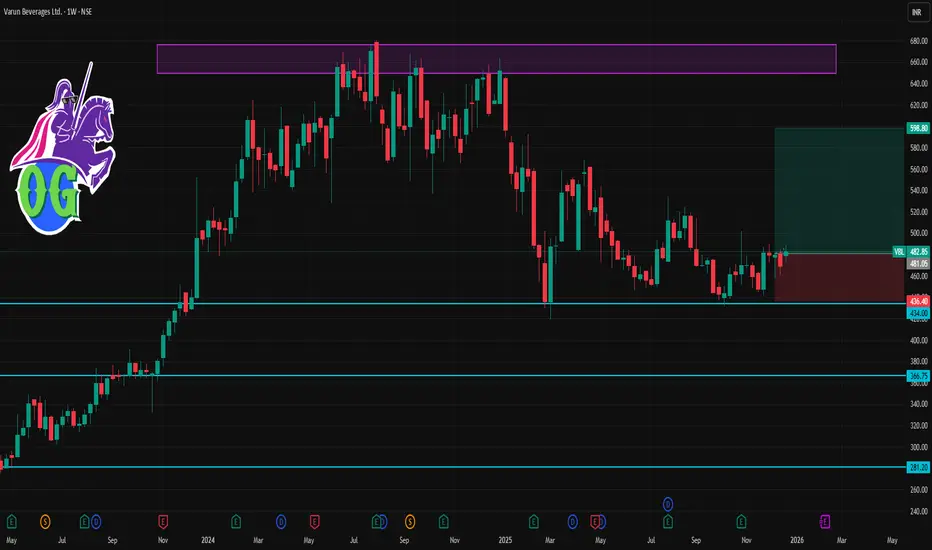
VBL 1 Week Time Frame 📌 Current Price Snapshot
Live price range: ~₹475 – ₹485 on recent sessions.
For reference, recent intraday levels show a high ~₹483.5 and low ~₹475.1.
🔥 Weekly Timeframe Key Levels
🟢 Support Levels
These levels can act as buy zones or trend-holds on weekly closes:
S1 (Immediate): ~₹465 – ₹460
S2 (Moderate): ~₹453 – ₹455
Strong weekly support: ~₹450 zone (psychological & Fibonacci importance)
If price stays above ₹460–₹465, the short‑term uptrend is comparatively stable on weekly outlook.
Option Trading Showdown: Your Strategy vs. the Market’s RealityWhat Is the Option Trading Showdown?
The Option Trading Showdown represents the real-life challenge every trader faces:
Can your strategy survive market volatility, emotional pressure, and rapid price movement?
Unlike simple buy-and-sell trading, options demand precision. Time decay, implied volatility, Greeks, strike selection, and position sizing all play a role. One wrong move can erase gains, while a well-planned strategy can multiply returns even in sideways or falling markets.
This show
Candle Patterns What Are Candlestick Patterns?
Candlestick patterns are formed using one or more candles and provide insights into short-term market sentiment. Each candle reflects the open, high, low, and close price, visually displaying the battle between bulls and bears.
Candlestick patterns are broadly classified as:
1. Single-Candle Patterns
2. Double-Candle Patterns
3. Triple-Candle Patterns
Chart Patterns What Are Chart Patterns?
Chart patterns are distinct formations created by price movements on a chart over a period of time. These patterns reflect the ongoing struggle between buyers and sellers and often signal trend continuation, trend reversal, or consolidation.
Chart patterns are typically classified into three main categories:
1. Reversal Patterns
2. Continuation Patterns
3. Bilateral (Neutral) Patterns
Algorithmic TradingData, Discipline & Technology Create Smarter Profits
In today’s fast-moving financial markets, speed, accuracy, and discipline matter more than ever. Human emotions, delayed reactions, and inconsistent decision-making often stand between traders and consistent profitability. This is where Algorithmic Trading transforms the game. Algorithmic trading is not just a tool—it is a systematic, data-driven approach that empowers traders and investors to participate in markets with precision, confidence
Trading Psychology: Your Offer vs Their Offer1. Understanding “Your Offer” in Trading
Your offer represents everything you bring into the market as a trader. It includes your capital, strategy, expectations, emotions, patience, discipline, and risk tolerance.
1.1 Expectations and Beliefs
Every trader enters the market with expectations—how much profit they want, how fast they want it, and how often they expect to win. Unrealistic expectations are one of the biggest psychological traps. When your expectations exceed market reality, frust
Divergence Secrets Intrinsic Value and Time Value
An option premium has two parts:
Intrinsic Value
The actual profit you would make if option were exercised now.
Time Value
Extra value based on:
Time left to expiration
Volatility
Market expectations
As expiry gets closer, time value decays—this is why options depreciate faster near expiry.
Part 2 Candle Stick Patterns How Put Options Work
Put Buyer
A put buyer expects the price to fall.
If stock is at ₹100 and you buy a Put Option at ₹95 for a premium of ₹4:
If stock falls to ₹80 → Profit
If stock stays above ₹95 → Loss limited to ₹4 premium
Put Seller
Expects price to stay above the strike.
They earn the premium but face large losses if price falls significantly.