Retail Trading vs Institutional Trading1. Who Are Retail Traders?
Retail traders are individual participants who trade financial instruments such as stocks, commodities, forex, cryptocurrencies, or derivatives using their own capital. They usually trade through online brokerage platforms and operate independently.
Key Characteristics of Retail Trading
Capital Size: Small to medium. Most retail traders trade with limited funds compared to institutions.
Access to Markets: Via discount brokers, trading apps, and online platforms.
D
Trend Line Break
Earnings Season Trading – A Complete Guide1. What Is Earnings Season?
Earnings season is the period when companies release their quarterly financial performance, including:
Revenue (sales)
Net profit or loss
Earnings per share (EPS)
Operating margins
Management guidance and outlook
In India, earnings seasons usually begin shortly after the end of each quarter:
Q1: April–June (results from July)
Q2: July–September (results from October)
Q3: October–December (results from January)
Q4: January–March (results from April/May)
Dur
Real Kowledge of Chart Pattern Key Principles for Chart Pattern Analysis
A. Trend Context
Patterns are more reliable when analyzed in the context of prevailing trends. For instance, reversal patterns in strong trends may fail without sufficient volume confirmation.
B. Volume Confirmation
Volume often provides confirmation for patterns:
Breakouts with high volume are more reliable.
Low volume breakouts can indicate false signals.
C. Time Frame
Patterns may appear differently across time frames. For example, a double top
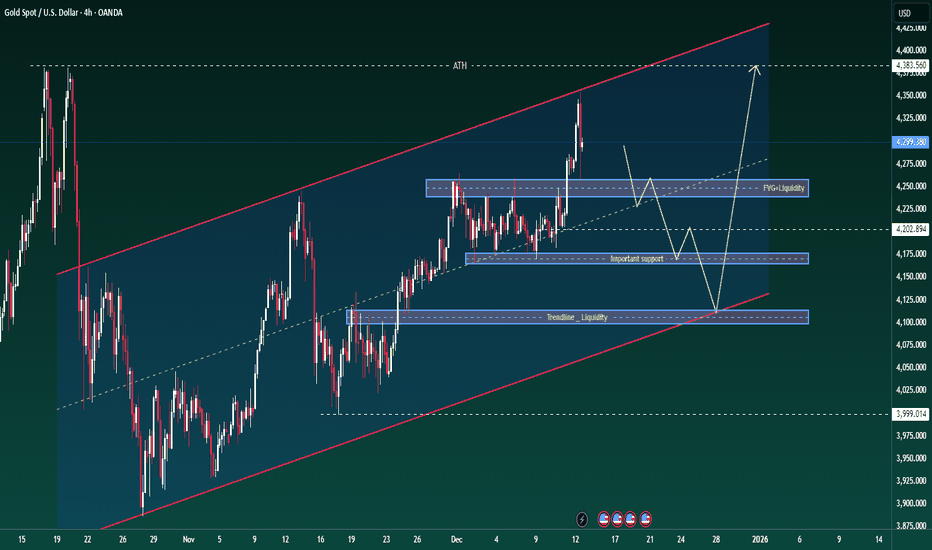
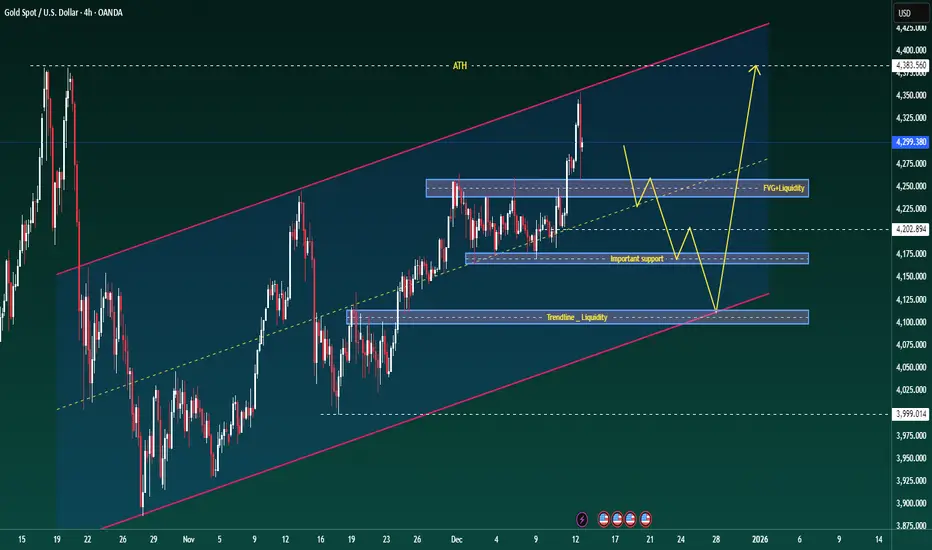
XAUUSD H4 Medium Term Rising Channel and Key Liquidity ZonesXAUUSD H4 – Medium-Term Rising Channel and Key Liquidity Zones
Gold reacted sharply after touching the trendline, with the primary focus next week on buying pullbacks in line with the dominant trend
PRIORITY SCENARIO – MAIN STRATEGY
Trend-following buy strategy on a corrective move into key support and liquidity areas
Primary buy zone: 4175 – 4203
Technical context: this area represents a previously validated support zone and a clear pool of downside liquidity
Price expectation: a correcti
Best Knowledge Of Candle Patterns Single-Candle Patterns
1. Doji:
A Doji forms when the opening and closing prices are virtually identical, resulting in a very small body. It represents indecision in the market. There are variations, such as the Long-Legged Doji, indicating high volatility with indecision, and the Gravestone Doji, often signaling a bearish reversal after an uptrend.
2. Hammer:
A Hammer has a small body near the top of the trading range and a long lower shadow. It typically appears at the bottom of a downtrend
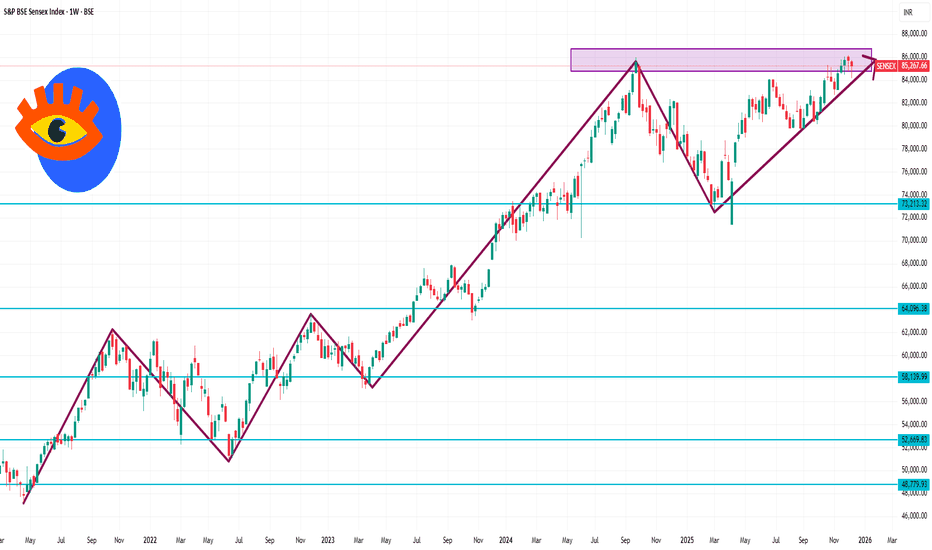
Sensex 1 Week Time Frame 📌 Live Index Level (Approximate Current Price)
Sensex today: ~85,268 points (trading slightly up) — this is the live market value you’re seeing right now.
📅 Weekly Time-Frame Snapshot
Based on recent daily closing prices (last week), the weekly movement looks like this (approximate):
Monday: ~85,712
Tuesday: ~85,102
Wednesday: ~84,666
Thursday: ~84,818
Friday (Latest): ~85,267
This suggests the week range is roughly:
Weekly High: ~85,700–85,720
Weekly Low: ~84,650–84,700
Current/Wee
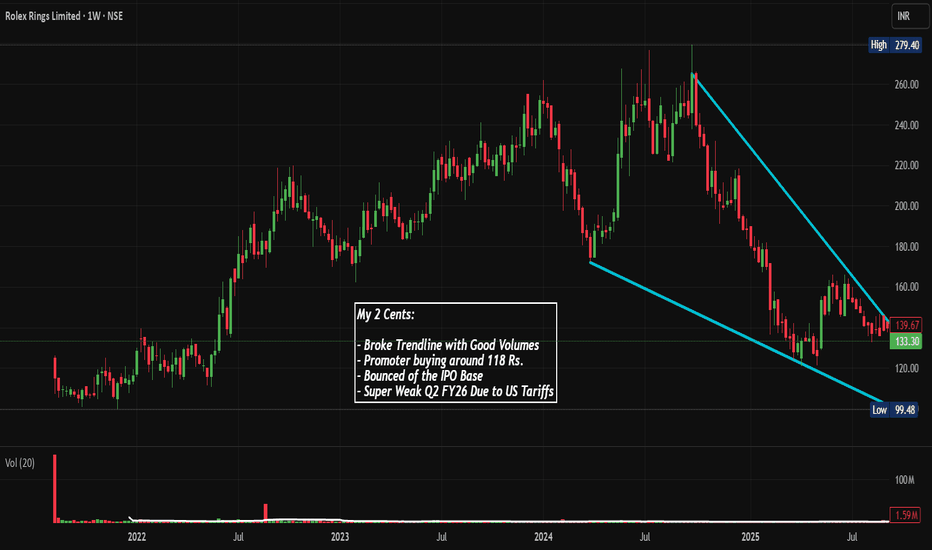
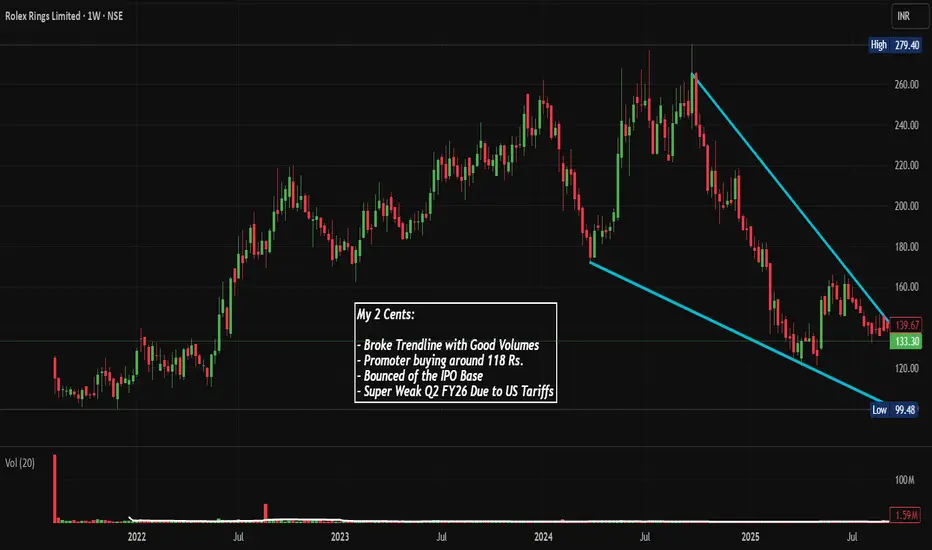
ROLEXRINGS: Trendline BO & IPO Base Bounce, Chart of the WeekFrom IPO Highs to back to IPO Base: Can Rolex Rings Break the Downtrend After 64% Crash?
After Promoter Buying and Decent Mangment Commentary Post Q2 FY26 Amid US Tariff, Let's Decode in This Week's "Chart of the Week"
As per the Latest SEBI Mandate, this isn't a Trading/Investment RECOMMENDATION nor for Educational Purposes; it is just for Informational purposes only. The chart data used is 3 Months old, as Showing Live Chart Data is not allowed according to the New SEBI Mandate.
Disclaimer:
Part 2 Ride The Big Moves Risk Management in Option Trading
Successful option trading depends heavily on risk management:
Position sizing
Defined stop-loss
Avoid over-leveraging
Understand implied volatility
Trade liquid instruments
Never risk large capital on naked option selling without protection.
Part 1 Ride The Big Moves Hedging Strategies Using Options
Protective Put
A protective put involves buying a put option against an existing stock position.
Purpose: Portfolio insurance
Cost: Premium paid
Benefit: Downside protection
Used by long-term investors during uncertain markets.
Collar Strategy
A collar combines:
Long stock
Long put
Short call
This caps both upside and downside and is useful during volatile periods.
Index Rebalancing Impact 1. What Is Index Rebalancing?
An index is a benchmark that tracks the performance of a selected group of securities, such as the Nifty 50, Sensex, S&P 500, or MSCI indices. Each index follows predefined rules regarding:
Number of constituents
Eligibility criteria (market capitalization, liquidity, free float)
Weighting methodology (market-cap weighted, equal-weighted, factor-based)
Index rebalancing occurs at regular intervals—quarterly, semi-annually, or annually—when the index provider re
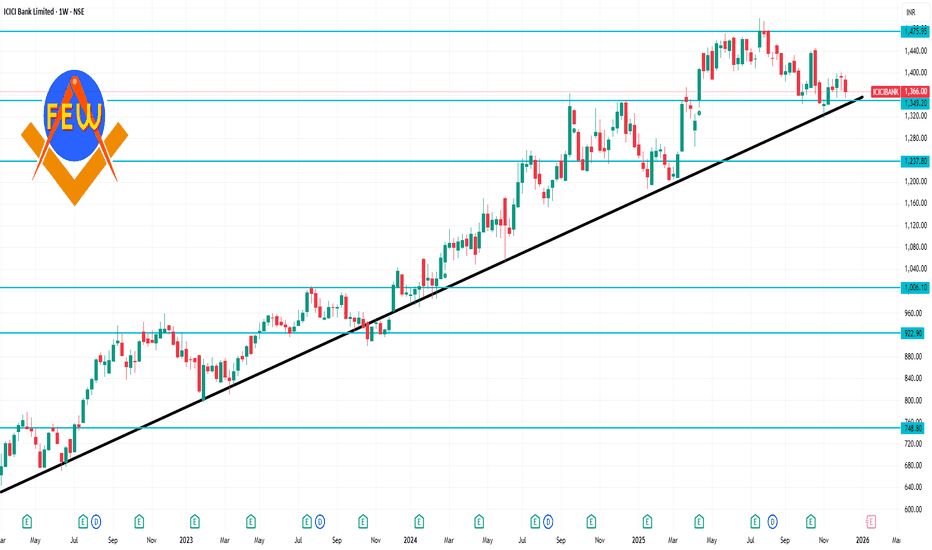
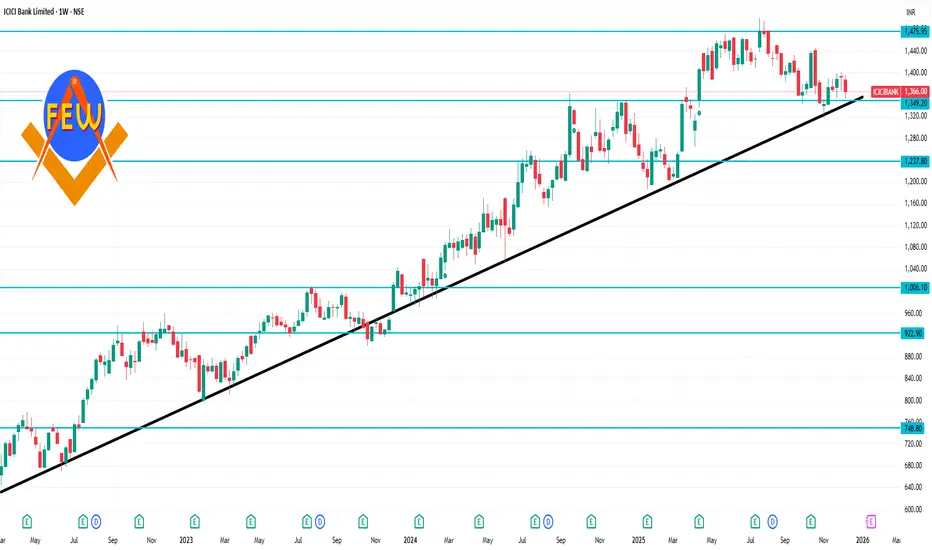
ICICIBANK 1 Week Time Frame 📌 Current Price Snapshot
ICICIBANK ~ ₹1,366 – ₹1,390 (approx) on NSE (recent trading range).
📈 Weekly Pivot Levels (Key Levels for the Week)
(These are calculated using the previous week’s high, low, and close)
Level Type Value
Weekly Pivot (CP) ₹1,337
Weekly Resistance 1 (R1) ₹1,357
Weekly Resistance 2 (R2) ₹1,371
Weekly Resistance 3 (R3) ₹1,391
Weekly Support 1 (S1) ₹1,323
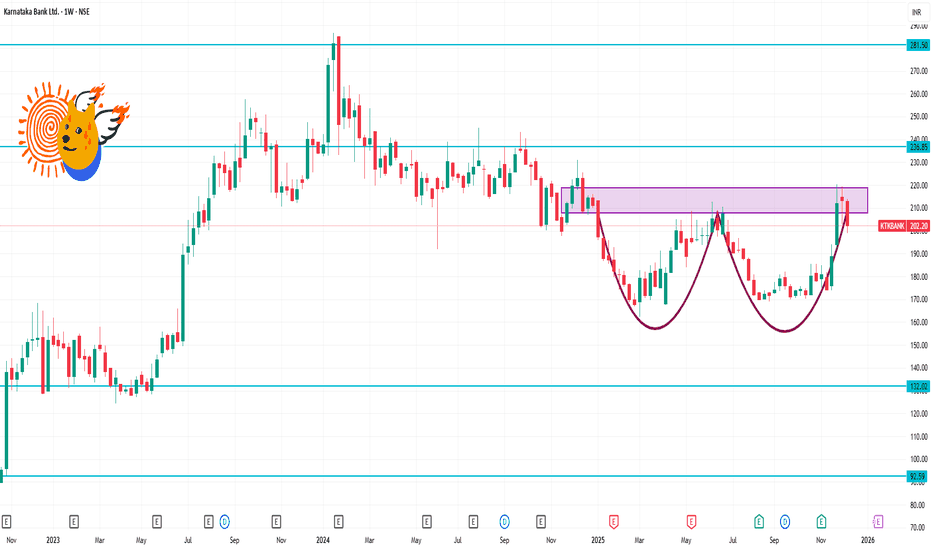
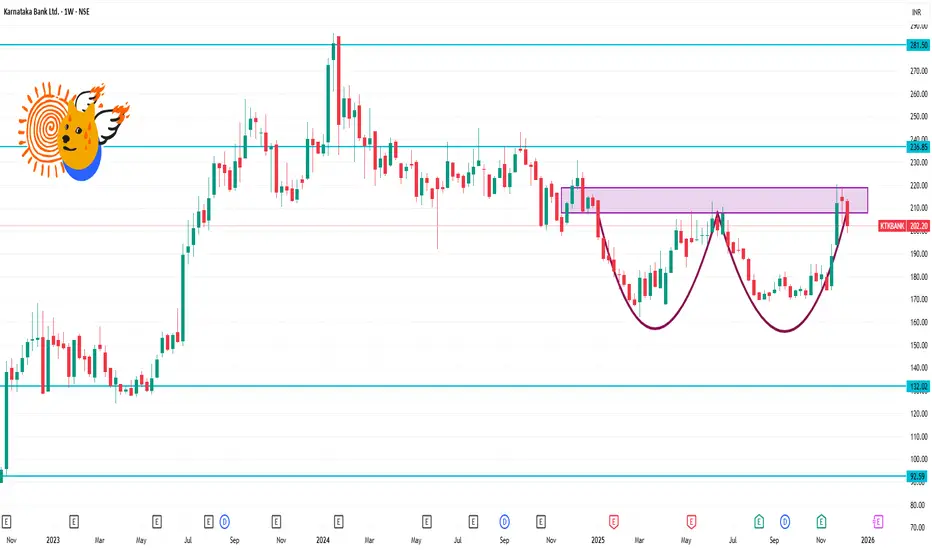
KTKBANK 1 Week Time Frame 📊 Weekly Time-Frame Levels (Support & Resistance)
🔁 Current Context (Price ~ ₹200-₹205 area)
Latest share price is around ₹202-₹206 on NSE.
🛑 Resistance Zones
₹205–₹208 – Near weekly pivot resistance/short-term supply zone
₹210–₹214 – Major horizontal resistance from recent price action
₹220–₹225+ – Next higher resistance cluster / previous swing area
(Break above ₹214/₹220 could signal further strength)
🟩 Support Zones
₹196–₹200 – Immediate weekly support zone
₹188–₹192 – Stronger weekl
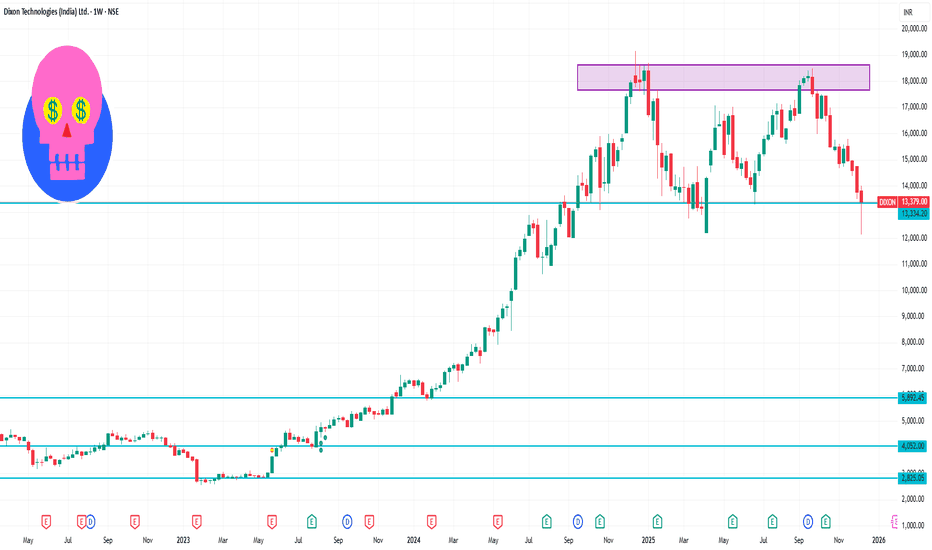
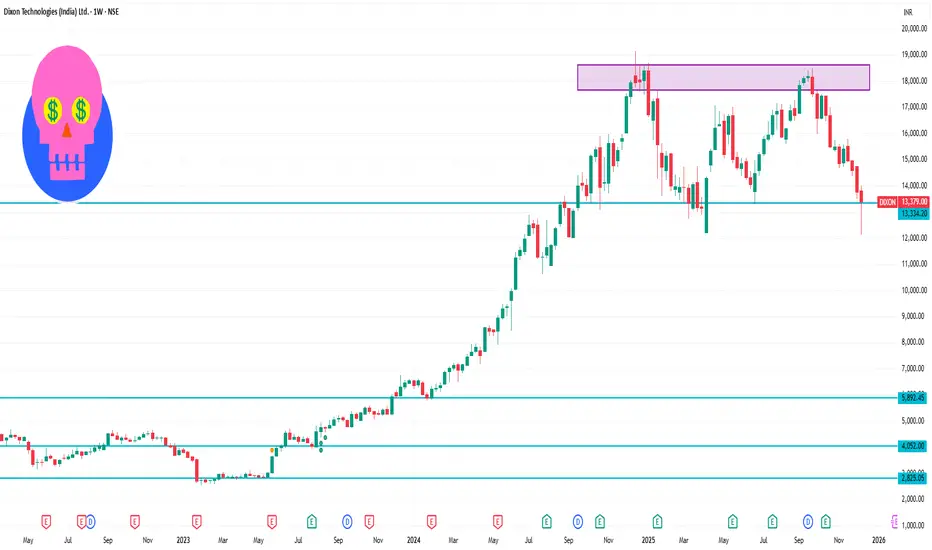
DIXON 1 Week Time Frame 📌 Live Price Snapshot (Approx)
Current price: ~₹13,300–₹13,400 (today range ~₹13,005–₹13,422) — confirms the recent trading zone.
📊 1-Week Pivot / Key Levels
From pivot analysis based on weekly range (TSR pivot data):
Weekly Pivot Levels: (Standard pivot)
Weekly Pivot: ~~₹14,526**
Resistance:
R1: ~₹14,850
R2: ~₹15,388
R3: ~₹15,712
Support:
S1: ~₹13,987
S2: ~₹13,664
S3: ~₹13,125**
These levels are for the entire trading week and act as reference points.
Important intr
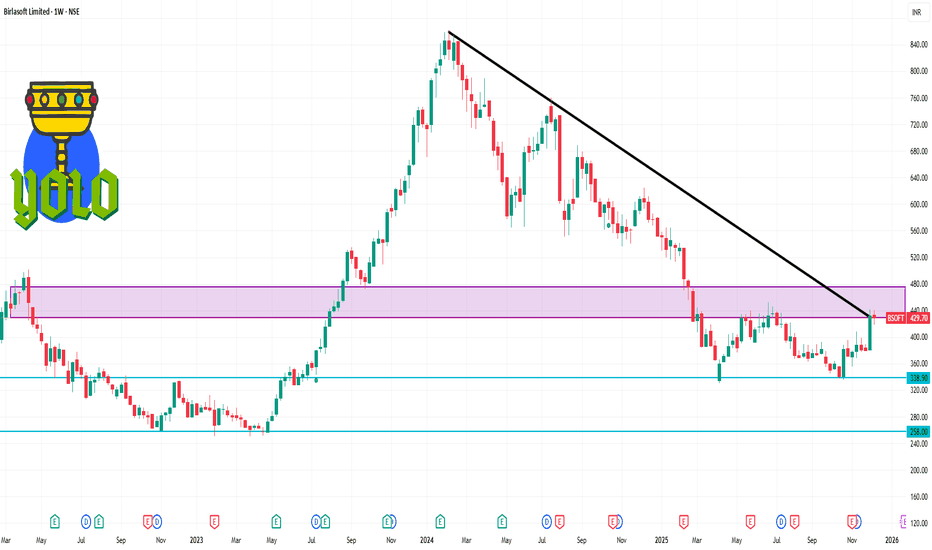
BSOFT 1 Week Time Frame 📌 Current Price Context
• Birlasoft is trading around ₹428–₹430 on NSE (Dec 12 2025).
• On a 1-week basis recently the price moved slightly down (~-0.7%).
📊 Short-Term Levels (1 Week / Swing Trading)
⚡ Immediate Support Levels
These are price zones where buyers may step in if the stock pulls back:
₹425–₹420 — first support zone (near current price cushion).
₹408–₹402 — deeper support zone if weakness extends.
~₹395 — third support level for risk-off moves.
If the price closes below ₹420 we
Part 2 Support and ResistanceImportant Option Trading Terms
a. In-The-Money (ITM)
Options with intrinsic value.
b. At-The-Money (ATM)
Strike price near the current market price.
c. Out-of-The-Money (OTM)
Options with no intrinsic value—cheaper but riskier.
d. Expiry
Last trading day of the option contract.
India has:
Weekly expiry (Index)
Monthly expiry (Stocks & Index)
e. Lot Size
You trade options in a fixed quantity called lot size.
Part 11 Trading Master Class Types of Options
There are two basic types:
a) Call Option (CE)
A Call Option gives the right to buy the underlying at a fixed strike price.
Traders buy calls when they expect the price to go up.
Example: Nifty trading at 22,000 → You buy 22,200 CE expecting upside.
b) Put Option (PE)
A Put Option gives the right to sell at a fixed strike price.
Traders buy puts when they expect the price to fall.
Example: Nifty trading at 22,000 → You buy 21,800 PE expecting downside.
Introduction: Understanding Crypto Assets1. Blockchain Fundamentals: The Hidden Architecture
At the heart of crypto assets is blockchain technology—a distributed ledger system. The “secret” here is its simplicity combined with complexity:
Decentralization: Unlike traditional finance, no single entity controls the ledger. Control is distributed across a network of nodes, enhancing security.
Immutability: Once a transaction is recorded, it cannot be altered. This provides transparency and reduces fraud.
Consensus Mechanisms: Proof of
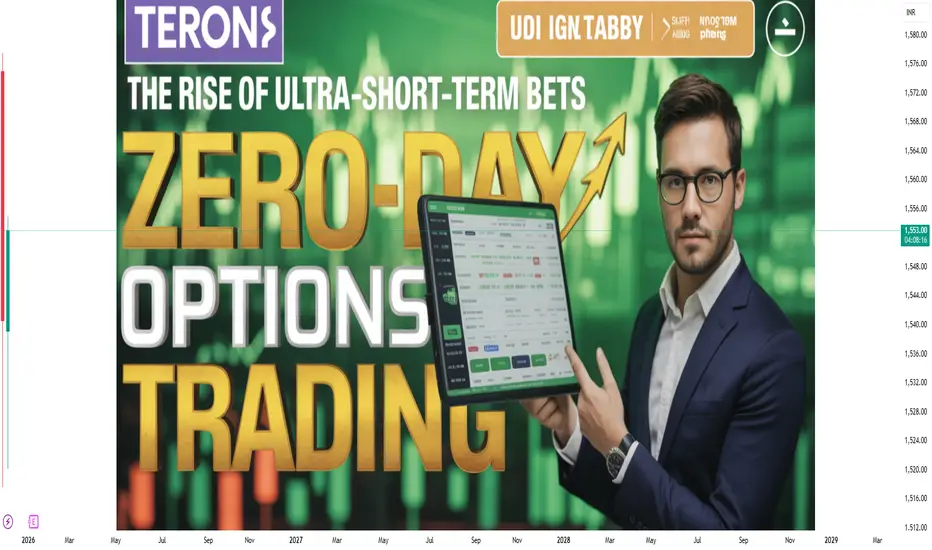
Zero-Day Option Trading: A Comprehensive Overview1. Introduction to Zero-Day Options
Zero-Day Option Trading refers to the practice of trading options contracts that expire on the very same day. In standard options trading, contracts may expire weeks or months in the future. However, zero-day options have a life span of only a few hours, typically expiring at the end of the trading day. This makes them extremely sensitive to price movements in the underlying asset, offering both tremendous profit potential and significant risk.
Zero-day optio
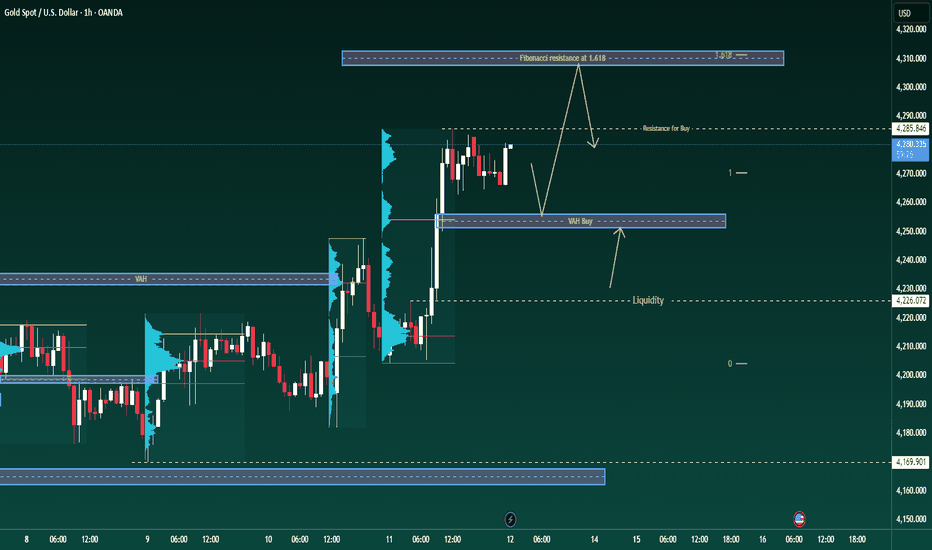
XAUUSD H1 Volume Profile and Key Price AreasXAUUSD H1 – Volume Profile and Key Price Areas
Gold remains in a strong uptrend, with the primary strategy focused on buying pullbacks
PRIORITY SCENARIO – MAIN STRATEGY
Buy-the-dip approach aligned with the dominant trend using Volume Profile levels
Expected buy zone: around 4253 based on VAH
Short-term range to monitor: 4263 – 4285
Price expectation: rebound from VAH toward the upper range before further expansion
Position management:
If price holds above the 4263 area and shows clear bu
Part 10 Trade Like Institutions What Are Options?
Options are derivative instruments—their value is derived from an underlying asset such as Nifty, Bank Nifty, stock, commodity, or currency.
An option is a contract that gives the trader:
Right, but not the obligation,
To buy or sell an underlying asset,
At a fixed price (Strike Price),
On or before a specific date (Expiry Date).
Because you have a choice, these instruments are called “Options.”
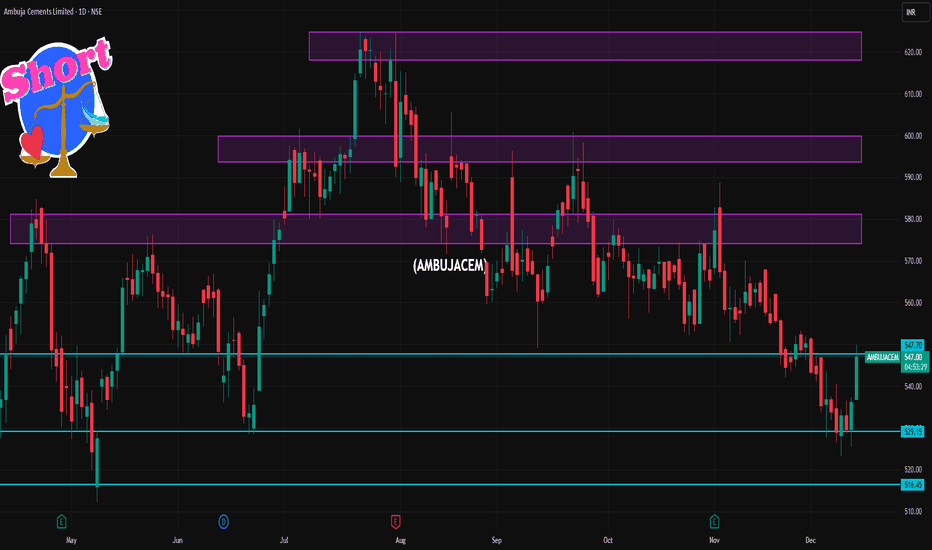
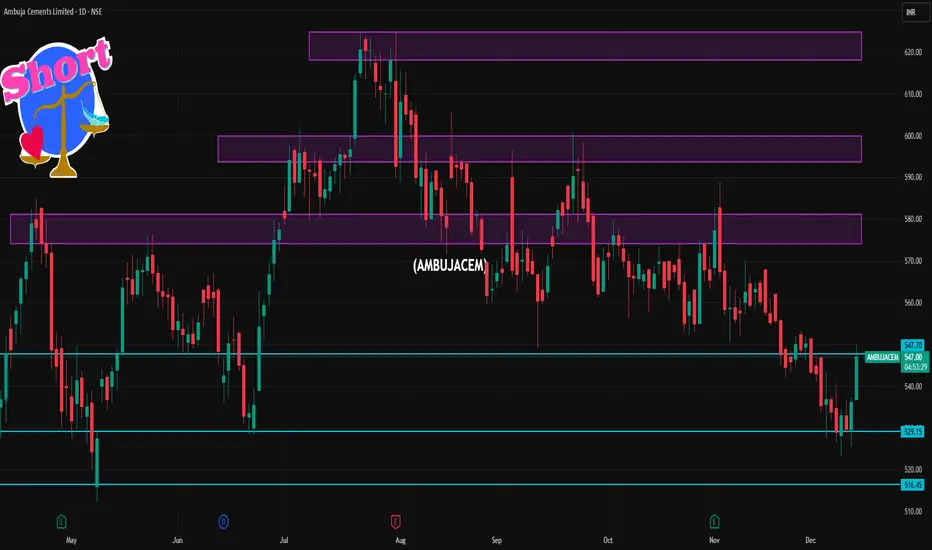
AMBUJACEM 1 Day Time Frame 📌 Current Price (approx)
• Trading around ₹536–₹547 as of today’s session.
📊 Daily Support & Resistance Levels
🔹 Pivot / Key Levels (from technical pivot calculations)
Daily Pivot Zone: ~₹534–₹549
Daily Support Levels:
S1: ~₹531–₹532
S2: ~₹525–₹528
S3: ~₹516–₹521
Daily Resistance Levels:
R1: ~₹540–₹544
R2: ~₹545–₹552
R3: ~₹552–₹559
🔹 Trading Range Today (Observed)
Day Low: ~₹525–₹526
Day High: ~₹537–₹549 range so far.
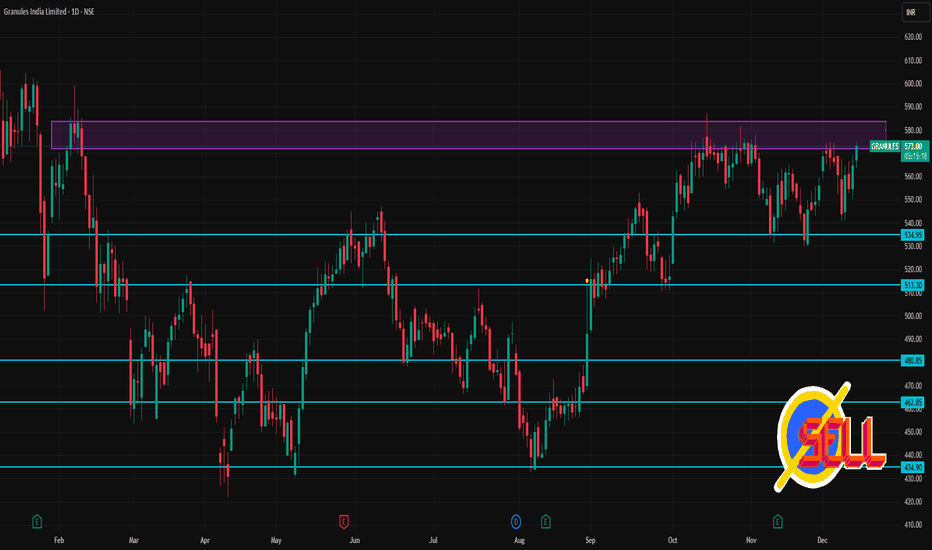
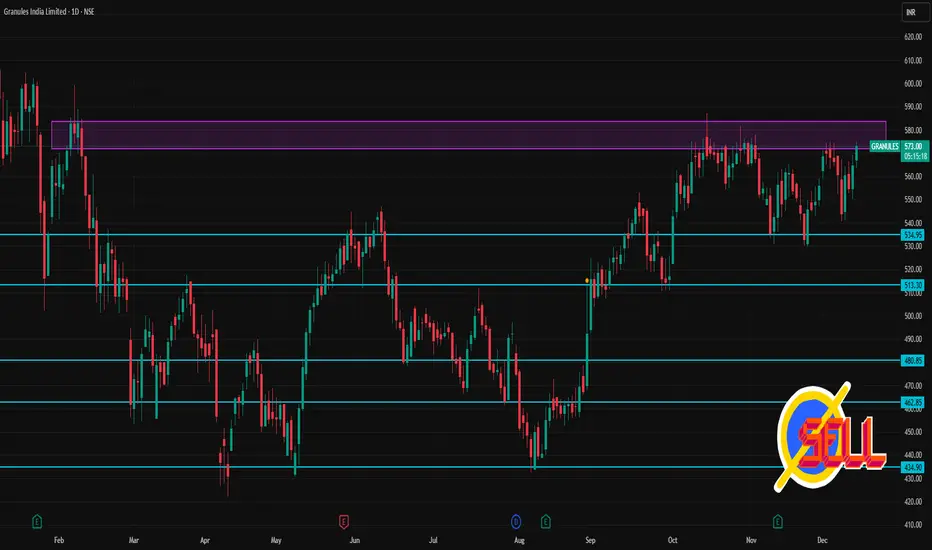
GRANULES 1 Day Time Frame📌 Current Price (approx): ~₹570 – ₹571 (intraday price as of market hours)
🔥 Today’s Key Levels (1-Day Timeframe)
📍 Pivot Levels (Daily)
Based on pivot calculations (classic & Fibonacci based on current price action):
Level Price (Approx)
R3 ~₹577–₹578
R2 ~₹571–₹574
R1 ~₹568–₹572
Pivot (PP) ~₹568
S1 ~₹565
S2 ~₹562
S3 ~₹559
📌 Interpretation:
Above Pivot (~₹568): bullish bias
Bel
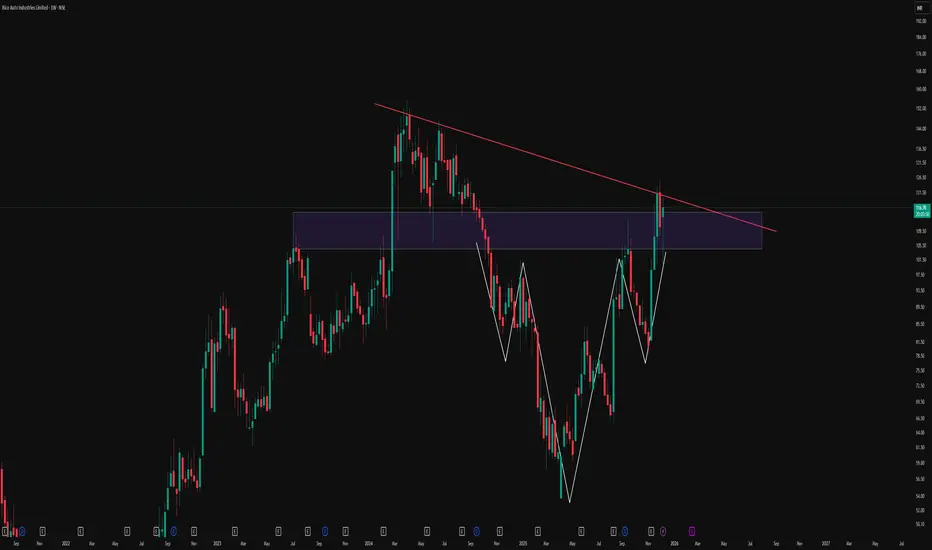
Reclaiming The Breakdown: Descending Triangle To Inverse HnSThis weekly chart of Rico Auto illustrates how structure can evolve over time and why rigid bias around a single pattern can be misleading. Price initially respected a clear descending trendline, forming a classic descending triangle and eventually breaking down below the support zone. Instead of continuing in a straight-line downtrend, the market absorbed that move and began to build a broader basing structure.
Over the following swings, price developed an inverted head and shoulders formation