XAUUSD – Bearish Pressure Holds Below Ichimoku And TrendlineMASON XAUUSD – Bearish Pressure Holds Below Ichimoku And Trendline
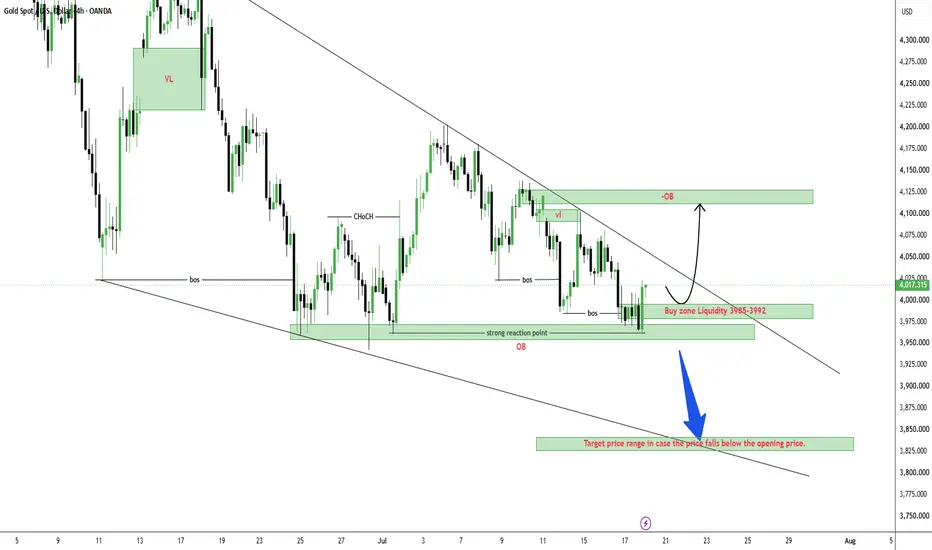
XAUUSD is trading around 3,980 after failing to recover strongly from the recent support area. Price remains below the Ichimoku structure and under the descending trendline, so the main bias is still bearish.
The priority view is to look for sell confirmation on pullbacks, especially if gold retests the sell order zone.
Technical View
Gold is still moving under bearish pressure. The recent recovery attempt failed to break the descending trendline, showing that buyers have not taken control of the structure yet.
Price is also trading below the Ichimoku resistance area. This supports the bearish view because the cloud and Ichimoku lines are still acting as dynamic resistance above price. As long as gold stays below this structure, every rebound should be treated as a correction.
The trendline is important because it continues to cap the upside. If price pulls back into the 3,998–4,018 sell order zone and rejects, this may confirm another lower high inside the bearish trend.
The 3,943 support is the first downside area to watch. If gold breaks below this level, selling pressure may continue toward the Fibonacci 1.618 area near 3,910.
The deeper bearish target is the Fibonacci extension zone around 3,810–3,825. This area becomes more realistic if gold breaks support cleanly and fails to recover above the sell zone.
Key Zones
Current price: 3,980
Sell order zone: 3,998–4,018
Short-term resistance: 4,018
Upper liquidity area: 4,037–4,064
Nearest support: 3,943
Fibonacci 1.618 target: 3,910
Fibonacci extension target: 3,810–3,825
Invalidation: above 4,064
Trading Plan
Sell Priority: 3,998–4,018
Condition: wait for bearish rejection, failed breakout above 4,018, or lower high formation below the descending trendline.
SL: above 4,064
TP1: 3,943
TP2: 3,910
TP3: 3,810–3,825
Alternative Scenario
If gold breaks below 3,943 directly, wait for a retest of this level as resistance before looking for sell continuation toward 3,910 and the Fibonacci extension target.
Buy View
Buy is not the priority while price stays below the Ichimoku structure and descending trendline. A buy setup only becomes safer if gold breaks above 4,064 and holds above the liquidity area.
Final View
Overall, gold remains in a bearish structure. The cleaner plan is to wait for price to retest the sell order zone, then watch for rejection. As long as 4,018–4,064 holds as resistance, the downside path toward 3,943, 3,910, and 3,810–3,825 remains in focus.
Will gold reject from the sell order zone first, or break support directly toward the Fibonacci extension target?
Trend Line Break
Gabriel India cmp 1239.30 Daily ChartGabriel India cmp 1239.30 Daily Chart
- Support Zone 1070 to 1200 Price Band
- Resistance Zone 1285 to ATH 1388 Price Band
- Breakout sustained above Falling Resistance Trendline
- Volumes are spiking by good sync of avg traded quantity
- Rounding Bottoms + Head & Shoulder around Support Zone
- Price rejection needs breakout from Resistance Zone to take uptrend
Manorama Inds cmp 1655.30 Daily ChartManorama Inds cmp 1655.30 Daily Chart
- Support Zone 1465 to 1585 Price Band
- Resistance Zone 1670 to ATH 1760 Price Band
- Breakout is attempted from Resistance Trendline
- Repeat Bullish Rounding Bottoms around Support Zone
- Volumes are spiking by good sync of avg traded quantity
XAU- Medium-Term Bearish Structure Still Targets Lower LiquidityMASON XAUUSD – Medium-Term Bearish Structure Still Targets Lower Liquidity
XAUUSD is trading around 4,088 after recovering from the recent support area. Although gold is showing a short-term rebound, the medium-term structure remains bearish.
The main trend is still down, and any recovery toward resistance should be treated as a corrective wave unless price breaks back above the major supply structure.
Technical View
Gold is still moving inside a broad bearish structure. The chart shows a clear sequence of lower highs and lower lows from the previous top area, which means sellers are still controlling the medium-term direction.
The latest rebound from the 3,960 support zone is only a technical reaction for now. Price has not broken the main bearish structure, and the recovery is moving back into a previous supply area.
The zone around 4,080–4,130 is important because it sits near the marked DOW secondary wave area. If price fails here and forms bearish rejection, this zone may become the next lower high before another downside continuation.
The 3,960 level is the nearest key support. If gold breaks below this area again, the next downside target is the weekly target around 3,752. A deeper bearish continuation can open the way toward the major target near 3,362.
Fibonacci also supports the bearish roadmap. The 2.618 extension area near 3,752 is marked as the weekly target, while the 3.618 extension near 3,362 is the deeper medium-term target.
Key Zones
Current price: 4,088
Short-term resistance: 4,080–4,130
DOW secondary wave zone: 4,100–4,130
Key support: 3,960
Weekly bearish target: 3,752
Major medium-term target: 3,362
Invalidation for bearish continuation: above 4,350
Trading Plan
Sell Priority: 4,080–4,130
Condition: wait for bearish rejection, failed breakout, or lower high formation around the resistance zone.
SL: above 4,350
TP1: 3,960
TP2: 3,752
TP3: 3,362
Alternative Scenario
If gold breaks above 4,130 and holds, price may continue a deeper corrective rebound toward 4,300–4,350. However, this would still be a correction unless the market breaks the full bearish structure.
Buy View
Buy is not the priority in the medium-term view. A short-term buy reaction may appear above 3,960, but it should be managed as a corrective move, not a confirmed trend reversal.
Final View
Overall, gold remains in a medium-term bearish structure. The current rebound can continue slightly higher, but the cleaner view is to watch for rejection around 4,080–4,130. If 3,960 fails, the next downside focus will be 3,752, followed by the deeper target around 3,362.
Will gold reject from the secondary wave zone, or extend the correction before the next bearish move?
MASON XAUUSD – Important Rebound Zone AheadMASON XAUUSD – Gold May Rebound Toward Fibonacci Before Next Decision
XAUUSD is trading around 3,997 after a strong bearish move inside the descending channel. Price remains below the Ichimoku cloud, so the main structure is still bearish.
However, gold is reacting near the strong liquidity zone and buy area around 3,960–3,990, so a short corrective rebound may appear before the next trend confirmation.
Technical View
Gold is still moving inside a clear bearish channel. The market has been creating lower highs and lower lows, showing that sellers are still controlling the main structure.
Price is also below the Ichimoku cloud. This means the broader trend has not shifted bullish yet. Any recovery from the current zone should be treated as a correction unless price can break above the cloud and hold.
The current area around 3,960–3,990 is important because it combines the marked buy zone and strong liquidity support. Price reacting here shows that sellers may slow down in the short term.
If buyers defend this zone, gold may recover toward 4,040–4,050 first, then the Fibonacci and liquidity area around 4,118. This is the key rebound target to watch.
The stronger resistance remains near 4,216. If price reaches this zone and rejects, the bearish trend may continue again.
Key Zones
Current price: 3,997
Buy reaction zone: 3,960–3,990
Short-term confirmation: 4,040–4,050
Fibonacci & liquidity zone: 4,118
Strong resistance: 4,216
Invalidation for recovery: below 3,960
Trading Plan
Buy Recovery Priority: 3,960–3,990
Condition: wait for bullish rejection, higher low, or price holding above the strong liquidity zone.
SL: below 3,960
TP1: 4,040–4,050
TP2: 4,118
TP3: 4,216
Alternative Scenario
If gold breaks and holds above 4,050, wait for a retest before looking for continuation toward the Fibonacci liquidity zone at 4,118.
Sell View
Sell remains the main trend view while price stays below the Ichimoku cloud and inside the descending channel. A cleaner sell setup may appear if gold rejects from 4,118 or 4,216.
Final View
Overall, gold is still in a bearish structure, but the current liquidity zone may create a short corrective rebound. The key area to watch is 4,118, where Fibonacci and liquidity may decide the next move.
Will gold rebound toward the Fibonacci zone first, or break below the strong liquidity area directly?
XAUUSD — EMA Downtrend, Waiting for a Value Pullback
Fundamental Analysis
Gold remains under bearish pressure as price continues to trade below the main EMA structure. Traders are still watching USD momentum, Treasury yields, and upcoming U.S. macro data.
For now, any short-term recovery should be treated as a technical pullback unless price can reclaim the EMA resistance zone with strong confirmation.
Technical Analysis
On the 2H chart, XAUUSD is still trading below EMA 34, EMA 89, and EMA 200. This confirms that the main trend remains bearish, with the EMA structure acting as dynamic resistance above price.
Price is currently around 4,003 after rejecting from the previous recovery area. The chart shows that gold may create a small corrective bounce toward the EMA value zone before continuing lower.
The first sell reaction area is around 4,045 - 4,060. A deeper pullback may reach the stronger sell swing zone around 4,078 - 4,088. If price rejects from these areas, sellers may continue to control the structure.
The main downside target is the psychological liquidity zone around 3,936 - 3,935.
Important Key Levels
Current price area: 4,003
EMA value zone: 4,045 - 4,060
Sell scalping zone: 4,059 - 4,078
Sell swing zone: 4,078 - 4,088
EMA resistance area: 4,044 - 4,126
Invalidation area: above 4,116 - 4,126
Main downside target: 3,936 - 3,935
Trading Scenario
Main Sell Scenario
Entry: 4,059 - 4,088
Stop Loss: 4,126
Take Profit 1: 4,003
Take Profit 2: 3,960
Take Profit 3: 3,936 - 3,935
Sell Condition
The preferred setup is to wait for gold to correct higher into the 4,059 - 4,088 value zone. This area aligns with the EMA reaction zone, Fibonacci structure, and previous sell pressure.
A sell setup becomes more valid if price forms bearish rejection from this zone, such as a long upper wick, bearish engulfing candle, failed breakout, or lower high below the EMA structure.
If price rejects from the sell zone and breaks back below 4,003, the bearish continuation view becomes stronger. The next downside focus would be 3,960, followed by the psychological liquidity target around 3,936 - 3,935.
Entry Conditions
Wait for price to pull back into 4,059 - 4,088.
Look for bearish rejection before entering sell.
Do not sell aggressively at the low without a pullback.
A break below 4,003 confirms stronger downside pressure.
If price breaks and holds above 4,126, the sell setup is invalid.
Overall, the main view remains bearish while XAUUSD trades below EMA 34, EMA 89, and EMA 200. Gold may create a light corrective bounce first, but the preferred plan is to wait for a reaction from the EMA value zone before looking for continuation toward 3,936 - 3,935.
Do you share the same bearish view on gold, or are you waiting for a cleaner pullback into the EMA value zone first?
EURUSD — EMA Bearish Trend, Sell From Value Zone
Fundamental Analysis
EURUSD remains under bearish pressure as price continues to trade below the main EMA structure. Traders are still watching USD momentum, Fed expectations, and upcoming macro data.
For now, the technical structure still favours sellers while recovery attempts remain limited below EMA resistance.
Technical Analysis
On the 2H chart, EURUSD is trading below EMA 34, EMA 89, and EMA 200. This shows that the short-term trend remains bearish, with the EMA structure acting as dynamic resistance above price.
Price is currently around 1.1352 after a strong bearish move. The market is now consolidating below the previous breakdown area, but this reaction has not confirmed a bullish reversal.
The key sell value zone is around 1.1384 - 1.1405. This area aligns with the Fibonacci retracement zone, high liquidity area, and previous short-term structure. If price pulls back into this zone and rejects, sellers may continue to defend the downtrend.
The key support level is around 1.1325. If price breaks below this area with strong bearish momentum, the next downside target is the lower liquidity zone around 1.1229.
Important Key Levels
Current price area: 1.1352
Sell value zone: 1.1384 - 1.1405
Fibonacci + High Liquidity zone: 1.1384 - 1.1405
EMA resistance area: 1.1445 - 1.1533
Key support: 1.1325
Main downside target: 1.1229
Invalidation area: above 1.1405
Trading Scenario
Main Sell Scenario
Entry: 1.1384 - 1.1405
Stop Loss: 1.1533
Take Profit 1: 1.1325
Take Profit 2: 1.1280
Take Profit 3: 1.1229
Sell Condition
The preferred setup is to wait for EURUSD to pull back into the 1.1384 - 1.1405 sell value zone. This area combines Fibonacci retracement, high liquidity, and previous structure.
A sell setup becomes more valid if price forms bearish rejection from this zone, such as a long upper wick, bearish engulfing candle, failed breakout, or lower high below the EMA structure.
If price rejects from the sell zone and breaks below 1.1325, the bearish continuation view becomes stronger. The next downside focus would be 1.1280, followed by the main target around 1.1229.
Entry Conditions
Wait for price to retest 1.1384 - 1.1405.
Look for bearish rejection before entering sell.
A break below 1.1325 confirms stronger downside pressure.
If price breaks and holds above 1.1405, the short-term sell setup becomes weaker.
Overall, the main view remains bearish while EURUSD trades below EMA 34, EMA 89, and EMA 200. The preferred plan is to wait for a pullback into the Fibonacci and high-liquidity value zone, then look for sell confirmation toward 1.1325 and 1.1229.
Do you share the same bearish view on EURUSD, or are you waiting for a cleaner rejection from the value zone first?
XAUUSD — Bearish Structure Holds, Sell Bias Below 4018
Gold is trading around $3,982 after forming a light accumulation phase near the lower range. Price has slowed down after the recent sell-off, but the main structure is still bearish as long as gold remains below the descending trendline and below the $4,018 invalidation area.
From an SMC perspective, gold has already created multiple MSS confirmations to the downside. The current sideways movement looks more like liquidity accumulation than a clear bullish reversal. This means sellers may still defend the $4,000–$4,018 area if price retests it and fails to break structure.
The key level for today is $4,018. As long as price stays below this level, the sell bias remains valid. A clean break above $4,018 and especially above the descending trendline would be the first signal that gold may shift into a short-term bullish reversal structure.
Sell setup 1
Condition:
Gold retests the liquidity accumulation zone around $4,000–$4,018 and shows bearish rejection with lower timeframe MSS / CHOCH.
Entry: $4,000–$4,018
SL: above $4,035
TP1: $3,950
TP2: $3,925
TP3: $3,886
Sell setup 2
Condition:
If gold breaks below $3,950 and retests this area as resistance, bearish continuation remains valid.
Entry: below $3,950 after retest
SL: above $3,985
TP1: $3,925
TP2: $3,900
TP3: $3,886
Buy setup
Condition:
Buying is not the priority. A buy setup is only valid if gold breaks above $4,018, closes above the descending trendline, and confirms bullish MSS / CHOCH.
Entry: above $4,018 after breakout retest
SL: below $3,980
TP1: $4,050
TP2: $4,085
TP3: $4,120
Key levels
Current price area: $3,982
Liquidity accumulation zone: $3,960–$4,018
Main sell reaction area: $4,000–$4,018
Sell-side liquidity H4: $3,925–$3,935
Key support zone: $3,886
Bearish continuation confirmation: clean break below $3,950
Bullish reversal confirmation: clean break above $4,018 and above the trendline
Bearish invalidation: clean 2H close above $4,018
My current view is that gold is still in a bearish structure while price trades below $4,018. The current accumulation may create short-term noise, but unless price breaks the trendline and confirms a bullish shift, the priority remains selling from resistance toward the lower liquidity zones.
No confirmation, no trade.
XAUUSD: Main Trend Still BearishXAUUSD: Main Trend Still Bearish, Waiting for Confirmation Around 4,008
Market Context
Gold remains under strong bearish pressure after continuing to trade inside a clear downward structure. The latest price action shows that sellers are still controlling the market, while buyers are only trying to build a corrective rebound from the lower liquidity area.
At the moment, the key question is not whether gold has reversed, but whether price can hold above the 4,008 trendline area long enough to create a valid recovery. Without confirmation, any bounce should still be treated as corrective.
Technical Structure
Gold is currently trading around 3,989 after reacting from the strong liquidity zone near 3,964. The main trend remains deeply bearish, supported by the descending trendline and multiple BOS signals on the chart.
The 3,964 area is the major downside level to watch. If price breaks below this zone with strength, bearish continuation may open toward lower liquidity levels.
However, if gold holds above the 4,008 trendline area and forms bullish confirmation, a corrective rebound can happen first. The nearest upside reaction zone is 4,036, followed by the next target around 4,083.
The key sell area above remains the OB zone around 4,180 - 4,200. If price recovers into this zone and rejects, sellers may return again for the next bearish leg.
Key Levels
Current Price: 3,989
Strong Liquidity Support: 3,964
Trendline Confirmation Area: 4,008
Buy-side Liquidity / Sell Order Zone: 4,036
Corrective Rebound Target: 4,083
Major Sell Swing OB Zone: 4,180 - 4,200
Bearish Continuation Level: Below 3,964
Trading Plan
Buy Scenario: Corrective Rebound
Entry: Above 4,008 after bullish confirmation
Stop Loss: Below 3,964
Take Profit 1: 4,036
Take Profit 2: 4,083
Take Profit 3: 4,120
Conditions: Price must hold above the 4,008 trendline area. Bullish rejection or CHOCH appears on the lower timeframe. Price reclaims 4,018 with strength. Buyers defend the 3,964 liquidity zone. Avoid buying if price breaks below 3,964.
Sell Scenario: Trend Continuation
Entry: Below 3,964 after confirmed breakdown and retest
Stop Loss: Above 4,008
Take Profit 1: 3,940
Take Profit 2: 3,920
Take Profit 3: 3,900
Conditions: Price breaks below the 3,964 strong liquidity zone. Retest of the broken level fails. Bearish momentum continues after breakdown. Price remains below the descending trendline. Sellers continue to create lower highs.
Alternative Sell Scenario: Sell From OB Zone
Entry: 4,180 - 4,200 after bearish confirmation
Stop Loss: Above 4,220
Take Profit 1: 4,083
Take Profit 2: 4,036
Take Profit 3: 3,964
Conditions: Price recovers into the OB sell zone. Strong bearish rejection appears. Price fails to hold above the OB zone. Market structure remains bearish.
Overall Bias
The main trend is still bearish. Gold is only attempting a corrective rebound from the lower liquidity area, but the recovery needs confirmation above the 4,008 trendline.
If price holds above 4,008, a short-term rebound toward 4,036 and 4,083 may appear. If price breaks below 3,964, bearish continuation becomes the priority again.
For now, the best approach is to wait for confirmation around 4,008 and 3,964 instead of chasing price in the middle.
What do you think — will gold hold above 4,008 for a corrective rebound, or break below 3,964 and continue the main bearish trend?
XAUUSD – Bearish Structure Remains Strong Below IchimokuMASON XAUUSD – Bearish Structure Remains Strong Below Ichimoku
XAUUSD is trading around 3,971 after a strong bearish continuation. Price remains inside the descending channel and below the Ichimoku cloud, so the main structure is still bearish.
The priority view remains sell setups, especially if price retests the short-term sell zone.
Technical View
Gold is still moving in a clear downtrend channel. The market continues to create lower highs and lower lows, showing that sellers are controlling the short-term structure.
Price has broken below the important support area around 4,030–4,052. This broken support can now act as resistance if gold tries to recover.
Ichimoku also supports the bearish view. Price is trading below the cloud, and the cloud above price is acting as dynamic resistance. As long as gold stays below the cloud, recovery attempts should be treated as pullbacks.
The sell order zone around 3,982–3,992 is the nearest area to watch. If price pulls back into this zone and shows bearish rejection, the downside move may continue toward the Fibonacci target area near 3,904.
The 4,018 level is important for short-term recovery confirmation. If gold breaks and holds above this level, sellers may need to wait for a deeper retest before entering again.
Key Zones
Current price: 3,971
Sell order zone: 3,982–3,992
Recovery confirmation: 4,018
Broken support / resistance: 4,030–4,052
Fibonacci target area: 3,904
Invalidation: above 4,052
Trading Plan
Sell Priority: 3,982–3,992
Condition: wait for bearish rejection, lower high, or failed recovery above 4,018.
SL: above 4,018
TP1: 3,940
TP2: 3,904
TP3: lower channel area
Alternative Scenario
If gold breaks above 4,018 and holds, wait for a deeper retest around 4,030–4,052 before looking for the next sell confirmation.
Buy View
Buy is not the priority while price stays below the Ichimoku cloud and inside the descending channel. A short-term buy reaction may appear near 3,904, but it needs clear bullish confirmation first.
Final View
Overall, gold remains under strong bearish pressure. As long as price stays below 4,018–4,052, sell continuation remains the cleaner setup, with the Fibonacci target around 3,904 as the next key area.
Will gold retest the sell zone first, or continue directly toward the Fibonacci target?
MASON XAUUSD – Downtrend Still Dominates, Rebound Is Secondary
XAUUSD is trading around 4,062 after another strong bearish move. Price remains below the Ichimoku cloud and below the broken trendline, so the main structure is still bearish.
The primary view is sell continuation, while the secondary scenario is a short technical rebound before the next confirmation.
Technical View
Gold is still moving under clear bearish pressure after breaking the previous trendline support. The latest reaction around 4,054 shows that price is testing a strong liquidity area, but buyers have not confirmed a real reversal yet.
Price Action is still forming lower highs and lower lows. This means any recovery should be treated as a pullback unless gold can break back above the confirmation level at 4,145.
Ichimoku also supports the bearish structure. Price is below the cloud, and the cloud above price is acting as resistance. As long as gold stays below the cloud, sellers still have better control.
The 4,106–4,111 area is the first sell zone. If price rebounds into this zone and rejects, the downside move may continue toward 4,054 and 4,024.
The second sell area is around 4,175–4,195. This zone is stronger but needs clear bearish rejection before any sell setup.
Key Zones
Current price: 4,062
Strong liquidity: 4,054
Medium-term downtrend confirmation: 4,024
Sell zone 1: 4,106–4,111
Buy recovery confirmation: 4,145
Sell zone 2: 4,175–4,195
Resistance: 4,221
Psychological target: 3,960–3,975
Invalidation: above 4,221
Trading Plan
Sell Priority: 4,106–4,111
Condition: wait for bearish rejection, lower high, or failed recovery above the broken trendline.
SL: above 4,145
TP1: 4,054
TP2: 4,024
TP3: 3,960–3,975
Second Sell Setup
Sell Zone: 4,175–4,195
Condition: only consider this zone if gold rebounds deeper and rejects below the Ichimoku cloud.
SL: above 4,221
TP1: 4,106
TP2: 4,054
TP3: 4,024
Alternative Scenario
If gold breaks and holds above 4,145, a short recovery wave may appear toward 4,175–4,195. However, this is still only a rebound unless price breaks above 4,221.
Buy View
Buy is not the priority while price stays below the Ichimoku cloud. A buy setup only becomes safer if gold holds above 4,145 and confirms strength back into the cloud.
Final View
Overall, gold is still in a bearish structure. The cleaner plan is to wait for a rebound into resistance, then look for sell confirmation. If 4,054 and 4,024 fail, the psychological target around 3,960–3,975 may become the next focus.
Will gold rebound into the sell zone first, or continue straight toward the psychological target?
XAUUSD — Bearish Structure Holds Below EMA Resistance
Fundamental Analysis
Gold remains under short-term bearish pressure as price continues to trade below the main EMA structure. Traders are still watching USD momentum, Treasury yields, and upcoming U.S. macro data.
For now, the recovery attempts remain weak while price fails to reclaim the value range above.
Technical Analysis
On the 2H chart, XAUUSD is still trading below EMA 34, EMA 89, and EMA 200. This shows that the bearish structure remains active, with the EMA zone acting as dynamic resistance.
Price recently failed around the value range near 4,200 - 4,220 and then dropped back below short-term support. This rejection confirms that buyers are still not strong enough to reverse the trend.
The key sell reaction zone is around 4,150 - 4,169. This area aligns with the broken short-term structure, Fibonacci reaction level, and the current bearish continuation zone shown on the chart.
If price retests this zone and fails to reclaim it, sellers may continue pushing gold toward the lower Fibonacci and liquidity areas. The next important support is around 4,100, followed by the deeper convergence zone near 4,064 - 4,034.
Important Key Levels
Current price area: 4,139
Sell reaction zone: 4,150 - 4,169
Value range resistance: 4,200 - 4,220
EMA resistance area: 4,201 - 4,241
Short-term support: 4,100 - 4,105
Fibonacci liquidity zone: 4,064 - 4,067
Main bearish target: 4,034
Invalidation area: above 4,201
Trading Scenario
Main Sell Scenario
Entry: 4,150 - 4,169
Stop Loss: 4,201
Take Profit 1: 4,100
Take Profit 2: 4,064
Take Profit 3: 4,034
Sell Condition
The preferred setup is to wait for gold to retest the 4,150 - 4,169 sell reaction zone. This area is important because it aligns with the broken structure and Fibonacci reaction level.
A sell setup becomes more valid if price forms bearish rejection from this zone, such as a long upper wick, bearish engulfing candle, failed breakout, or lower high below the EMA structure.
If price rejects from the sell zone and breaks below 4,100, the bearish continuation view becomes stronger. The next downside focus would be 4,064 - 4,067, followed by the main target around 4,034.
Entry Conditions
Wait for price to retest 4,150 - 4,169.
Look for bearish rejection before entering sell.
A break below 4,100 confirms stronger downside pressure.
If price breaks and holds above 4,201, the sell setup is invalid.
Overall, the main view remains bearish while XAUUSD trades below EMA 34, EMA 89, EMA 200, and the previous value range. The preferred plan is to wait for a retest of 4,150 - 4,169, then look for sell confirmation toward 4,100, 4,064, and 4,034.
Do you share the same bearish view on gold, or are you waiting for a cleaner rejection from the sell reaction zone?
MASON XAUUSD – Gold Breaks Trendline, Sell Continuation In Focus
XAUUSD is trading around 4,140 after a strong bearish move. Price has broken below the short-term rising trendline and remains below the Ichimoku cloud, showing that sellers are still controlling the structure.
The main view is sell continuation, especially if price retests the broken trendline or previous support zones.
Technical View
Gold has broken the rising trendline that previously supported the recovery wave. This is an important signal because the market is no longer respecting the short-term bullish structure.
Price Action is showing lower highs after the rejection from the 4,200 area. The latest breakdown below the trendline confirms that buying momentum is weak, while sellers are pressing price toward deeper liquidity.
Ichimoku also supports the bearish view. Price is trading below the cloud, and the cloud above price is now acting as dynamic resistance. As long as gold stays below the cloud, recovery attempts should be treated as pullbacks, not a confirmed reversal.
The Fibonacci zones are important now. Price is reacting near the 1.618 extension area, but if this level cannot hold, gold may continue lower toward the 2.618 liquidity zone and the 3.618 crucial support area.
Key Zones
Current price: 4,140
Sell entry 1: 4,145–4,160
Sell entry 2: 4,170–4,185
Short-term resistance: 4,200–4,220
Fibonacci 1.618 area: 4,125–4,135
Liquidity level: 4,070–4,080
Crucial support: 4,020–4,030
Invalidation: above 4,200
Trading Plan
Sell Priority: 4,145–4,160
Condition: wait for bearish rejection, failed recovery above the broken trendline, or price staying below the Ichimoku cloud.
SL: above 4,200
TP1: 4,125–4,135
TP2: 4,070–4,080
TP3: 4,020–4,030
Second Sell Setup
Sell Zone: 4,170–4,185
Condition: only consider this zone if gold pulls back deeper and rejects from the previous support area.
SL: above 4,220
TP1: 4,125–4,135
TP2: 4,070–4,080
TP3: 4,020–4,030
Alternative Scenario
If gold breaks directly below 4,125, wait for a retest of this zone as resistance before looking for continuation toward 4,070 and 4,020.
Buy View
Buy is not the priority while price remains below the broken trendline and Ichimoku cloud. A short-term bounce may appear near Fibonacci support, but it needs clear bullish confirmation before considering any recovery setup.
Final View
Overall, gold is under bearish pressure after breaking the trendline. As long as price stays below 4,170–4,185 and the Ichimoku cloud, sell continuation remains the cleaner view.
Will gold retest the sell zone first, or drop directly toward the Fibonacci liquidity levels?
XAUUSD – Hold 4,121 or Break Down to 4,054? XAUUSD – Hold 4,121 or Break Down to 4,054?
Gold is sitting at one of the clearest decision zones on the H1 chart right now.
After failing to build above the recent intraday recovery area, price has dropped back into the 4,121 support zone. This is the kind of level that usually does not stay quiet for long. Buyers either defend it and force a rebound, or a clean breakdown opens the path toward the next strong liquidity area near 4,054.
FUNDAMENTAL ANALYSIS
Gold is still balancing between safe-haven demand and the strength of the U.S. dollar. That keeps the broader tone cautious.
For now, the bigger driver is still technical structure. Price is at a clear decision point, so reaction matters more than prediction. If the support holds, gold can bounce. If it fails, sellers may quickly press lower.
TECHNICAL ANALYSIS – SMC + MARKET STRUCTURE
From a market structure perspective, gold is no longer showing a clean bullish recovery. The recent rally failed to sustain, and price has already started respecting lower highs.
The chart also shows that upside attempts were rejected near liquidity, while the intraday recovery area around 4,171 – 4,179 is now acting as a sell zone. That makes the current support around 4,121 the most important level on the chart.
This is why the setup feels strong and simple.
There are only two key reactions to watch:
* If 4,121 holds, price may bounce back into 4,171 – 4,179 and possibly extend toward the SMA 200 area.
* If 4,121 breaks, the structure becomes much weaker and the next downside draw may open toward 4,054.
That is the story here. One level. Two outcomes. Clear reaction needed.
KEY PRICE ZONES TO WATCH
Current price area: 4,121
Major decision zone / strong support: 4,121
Sell order zone: 4,171 – 4,179
Nearest recovery resistance: 4,179
SMA 200 resistance: 4,230
Liquidity rejection zone: 4,277
Strong liquidity target below: 4,054
Invalidation area for bearish breakdown: Back above 4,179
TRADING SCENARIOS
Buy Scenario – Only If 4,121 Holds
If gold defends 4,121 and prints a clear bullish reaction, I will watch for a rebound setup.
Buy Zone: Around 4,121
Entry Condition: Bullish rejection, liquidity sweep below support, or lower-timeframe bullish CHoCH.
Stop Loss: Below the recent sweep low or below the support invalidation.
Take Profit:
TP1: 4,171 – 4,179
TP2: 4,230
Sell Scenario – Priority If Breakdown Confirms
If gold breaks below 4,121 and confirms weakness, I will watch for bearish continuation toward the lower liquidity area.
Sell Zone: Below 4,121 after confirmation
Entry Condition: Clean breakdown, bearish retest, or strong bearish displacement below support.
Stop Loss: Above the broken level or above the nearest swing high.
Take Profit:
TP1: 4,054
TP2: Lower extension only if bearish momentum expands.
Alternative Sell Scenario
If gold bounces first into 4,171 – 4,179 and shows rejection, that area may offer a cleaner sell reaction.
Sell Condition: Bearish rejection, failed reclaim, or lower-timeframe bearish CHoCH from the sell zone.
Target: 4,121 then 4,054
MY VIEW ON GOLD
This is a high-attention chart because the market is sitting right on a major decision zone.
I do not want the middle of the move here. I only want the reaction.
As long as gold stays pressed against 4,121, this level remains the key. If buyers defend it, a rebound into 4,171 – 4,179 is possible. But if support gives way, the chart becomes much heavier and 4,054 starts to look like the next real draw.
For me, this is not a chart to overcomplicate. It is a chart to watch closely.
Do you think 4,121 will hold and trigger a rebound, or is 4,054 the next stop for gold?
XAUUSD — Medium-Term Buy Zone, Waiting For Liquidity Sweep
Gold is trading around $4,118 after rejecting from the short-term OB sell entry zone near $4,185–$4,198. Price has pulled back sharply, but the bigger focus is now shifting to the lower liquidity area.
From an SMC perspective, gold is moving toward a major demand zone where sell-side liquidity and the OB buy zone are sitting together. This area around $4,052–$4,085 is important because it was the origin of the previous bullish reaction and also sits above the strong low near $4,022.
The main plan is not to chase the current move. I prefer to wait for gold to sweep liquidity below $4,052, tap the OB buy zone, then look for bullish confirmation. If buyers defend this zone, gold can build a medium-term recovery back toward $4,198, $4,222, and higher FVG liquidity.
Buy setup 1
Condition:
Gold sweeps sell-side liquidity near $4,052 and reacts from the OB buy zone with bullish MSS / CHOCH confirmation.
Entry: $4,052–$4,085
SL: below $4,020
TP1: $4,118
TP2: $4,198
TP3: $4,222
Buy setup 2
Condition:
If gold holds the OB buy zone and breaks back above $4,198, wait for a retest before looking for continuation.
Entry: $4,185–$4,198 after breakout retest
SL: below $4,150
TP1: $4,222
TP2: $4,260
TP3: $4,285–$4,300
Sell setup
Condition:
Selling is not the priority. A sell setup is only valid if gold rejects again from $4,185–$4,198 and fails to reclaim the buy-side liquidity area.
Entry: $4,185–$4,198 after rejection
SL: above $4,222
TP1: $4,118
TP2: $4,085
TP3: $4,052
Key levels
Current price area: $4,118
OB buy zone: $4,052–$4,085
Strong low: $4,022
OB sell entry: $4,185–$4,198
Week high: $4,222
Upper FVG target: $4,260–$4,300
Bullish invalidation: clean 2H close below $4,020
My current view is that gold may create a stronger medium-term buy opportunity if price returns into the major OB and liquidity zone. The best Prime Gold plan is to wait for liquidity to be taken first, then enter only after bullish structure confirms.
No confirmation, no trade.
XAUUSD — Bearish Structure Continues, Liquidity Zones Remain Key
Gold is trading around $4,183 after failing to reclaim the day high near $4,221. Even with geopolitical tension still supporting volatility, the short-term structure remains bearish while price stays below the $4,194–$4,200 sell zone.
From an SMC perspective, gold has already rejected from the upper FVG area and continued to create lower structure. Price is now moving around a contested liquidity zone, where both buyers and sellers are active. This is why I do not want to chase price in the middle of the range.
The main sell reaction area is $4,194–$4,200. If gold retests this zone and shows rejection, sellers may continue to target sell-side liquidity around $4,137, then the deeper OB buy zone around $4,074–$4,078.
Sell setup 1
Condition:
Gold retests the $4,194–$4,200 sell zone and shows bearish rejection with lower-timeframe MSS / CHOCH.
Entry: $4,194–$4,200
SL: above $4,222
TP1: $4,160
TP2: $4,137
TP3: $4,078
Sell setup 2
Condition:
If gold breaks below $4,137 and retests it as resistance, bearish continuation remains valid.
Entry: below $4,137 after retest
SL: above $4,165
TP1: $4,100
TP2: $4,078
TP3: $4,052
Buy setup
Condition:
A buy setup is only considered if gold sweeps the $4,074–$4,078 OB buy zone and prints strong bullish rejection with lower-timeframe MSS / CHOCH. This is only a reaction setup, not the main trend.
Entry: $4,074–$4,078 after liquidity sweep
SL: below $4,052
TP1: $4,137
TP2: $4,160
TP3: $4,194
Key levels
Current price area: $4,183
Sell zone: $4,194–$4,200
Day high: $4,221
Sell-side liquidity: $4,137
OB buy zone: $4,074–$4,078
Bearish confirmation: clean break below $4,137
Bearish invalidation: clean 2H close above $4,222
My current view remains bearish while gold trades below $4,194–$4,200. Geopolitical tension can create sharp reactions, but the Prime Gold plan is still the same: wait for price to reach major contested liquidity zones, confirm structure, then execute with defined risk.
No confirmation, no trade.
XAUUSD — EMA Downtrend Holds, Sell Position Remains Active
Fundamental Analysis
Gold remains under pressure as price continues to trade below the main EMA structure. Traders are still watching USD strength, Treasury yields, and upcoming U.S. macro data.
For now, the technical structure still favours sellers while recovery attempts are rejected from the value sell zone.
Technical Analysis
On the 1H chart, XAUUSD is trading below EMA 34, EMA 89, and EMA 200. The EMA structure is still pointing lower, showing that the short-term trend remains bearish.
Price recently tested the value range around 4,210 - 4,225 but failed to break higher. This rejection shows that buyers are still weak, while sellers continue to defend the EMA downtrend.
The order sell zone around 4,185 - 4,204 has also reacted well. After touching this area, price rejected and moved lower again, confirming that the sell zone is still valid.
As long as gold stays below 4,204 - 4,225, the bearish continuation setup remains active. The main downside target is the Fibonacci and liquidity convergence zone around 4,066.
Important Key Levels
Current price area: 4,177
Order sell zone: 4,185 - 4,204
Value range resistance: 4,210 - 4,225
EMA resistance area: 4,234 - 4,270
Short-term support: 4,140 - 4,120
Fibonacci liquidity target: 4,066 - 4,064
Invalidation area: above 4,225
Trading Scenario
Main Sell Scenario
Entry: 4,185 - 4,204
Stop Loss: 4,225
Take Profit 1: 4,140
Take Profit 2: 4,100
Take Profit 3: 4,066 - 4,064
Sell Condition
The preferred setup is to continue focusing on sell positions while price stays below the value range and EMA resistance.
The sell zone has already reacted well, showing rejection from 4,185 - 4,204. If price retests this area and forms another bearish rejection, the sell continuation setup remains valid.
A break below 4,140 would strengthen bearish momentum and open the way toward 4,100, then the Fibonacci liquidity target around 4,066 - 4,064.
Entry Conditions
Wait for price to stay below 4,204.
Look for bearish rejection on any retest.
A break below 4,140 confirms stronger downside pressure.
If price breaks and holds above 4,225, the sell setup is invalid.
Overall, the main view remains bearish while XAUUSD trades below EMA 34, EMA 89, EMA 200, and the value range resistance. The sell zone has already rejected price, so the preferred plan is to continue focusing on bearish continuation toward 4,140, 4,100, and 4,066.
Do you share the same bearish view on gold, or are you waiting for another retest of the order sell zone?
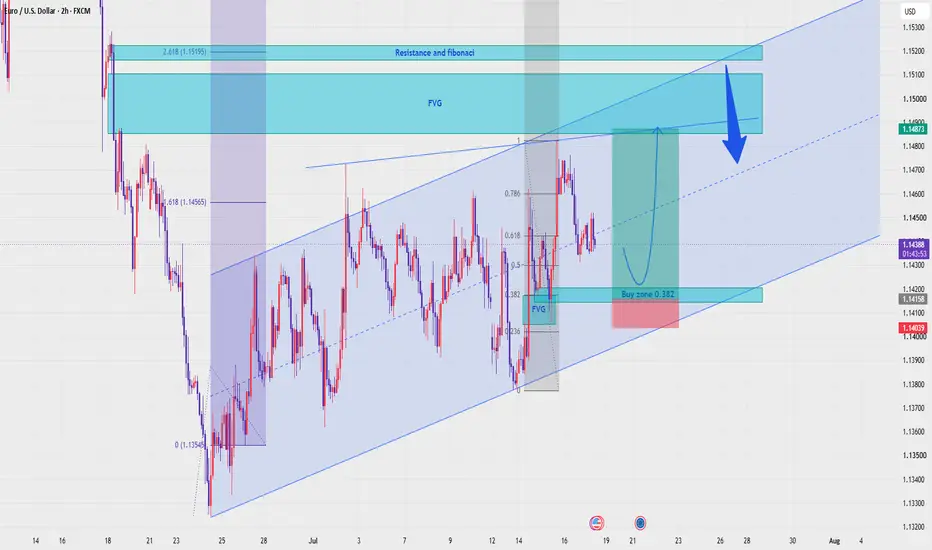
EURUSD — Corrective Bounce Before Deeper Bearish Continuation
Fundamental Analysis
EURUSD remains under pressure as price continues to trade below the main EMA structure. Traders are still watching USD momentum, Fed expectations, and upcoming macro data.
For now, the recovery looks corrective, not a confirmed bullish reversal. If price fails at the value sell zone, sellers may continue to control the next move.
Technical Analysis
On the 1H chart, EURUSD is still trading below EMA 34, EMA 89, and EMA 200. The EMA structure is above price, showing that the short-term trend remains bearish.
Price is currently around 1.1445 after reacting from the lower buy zone near 1.1436 - 1.1445. This area may support one more corrective bounce before the next bearish leg.
The key sell zone is around 1.1491 - 1.1509. This zone aligns with the Fibonacci 0.618 retracement, previous structure, and value range resistance. If EURUSD reaches this area and rejects, the bearish continuation setup becomes cleaner.
Below current price, the main downside target is around 1.1383 - 1.1384. This is the target zone marked on the chart and may become the next liquidity objective if sellers regain control.
Important Key Levels
Current price area: 1.1445
Buy reaction zone: 1.1436 - 1.1445
Sell value range: 1.1491 - 1.1509
Fibonacci 0.618 sell zone: 1.1491 - 1.1509
EMA resistance area: 1.1498 - 1.1533
Short-term invalidation: above 1.1533
Main downside target: 1.1383 - 1.1384
Trading Scenario
Main Sell Scenario
Entry: 1.1491 - 1.1509
Stop Loss: 1.1533
Take Profit 1: 1.1445
Take Profit 2: 1.1416
Take Profit 3: 1.1383 - 1.1384
Sell Condition
The preferred setup is to wait for EURUSD to create one more corrective bounce into the 1.1491 - 1.1509 value range. This area is the main Fibonacci and resistance zone on the chart.
A sell setup becomes more valid if price forms bearish rejection from this zone, such as a long upper wick, bearish engulfing candle, failed breakout, or lower high below the EMA structure.
If price rejects from the sell zone and breaks back below 1.1436, the bearish continuation view becomes stronger. The next downside target would be 1.1416, followed by the main target around 1.1383 - 1.1384.
Alternative Buy Scenario
Entry: 1.1436 - 1.1445
Stop Loss: 1.1416
Take Profit 1: 1.1481
Take Profit 2: 1.1491
Take Profit 3: 1.1509
Buy Condition
This is only a short-term corrective bounce setup, not the main trend view. A buy setup is valid only if EURUSD holds the 1.1436 - 1.1445 buy zone and forms clear bullish rejection.
If price fails to hold this zone, the bounce scenario is invalid and sellers may push directly toward 1.1383 - 1.1384.
Entry Conditions
Wait for price to reach the value sell zone.
Look for bearish rejection around 1.1491 - 1.1509.
A break below 1.1436 confirms stronger downside pressure.
If price breaks and holds above 1.1533, the sell setup is invalid.
Overall, the main view remains bearish while EURUSD stays below EMA 34, EMA 89, and EMA 200. Price may create one more corrective bounce first, but the preferred plan is to look for sell confirmation from 1.1491 - 1.1509 toward 1.1416 and 1.1383 - 1.1384.
Do you share the same view that EURUSD may bounce first before a deeper drop, or are you waiting for a cleaner rejection from the value sell zone?
XAUUSD H4 — EMA Bearish TrendXAUUSD — EMA Bearish Trend, Two Sell Zones Toward Fibonacci Liquidity Target
Fundamental Analysis
Gold remains under bearish pressure as price continues to trade below the main EMA structure. The market is still watching USD strength, Treasury yields, and upcoming U.S. data, which may create volatility around key Fibonacci and liquidity zones.
For next week, the main view remains bearish while recovery attempts stay below the EMA resistance area.
Technical Analysis
On the 4H chart, XAUUSD is still trading below EMA 34, EMA 89, and EMA 200. This confirms that the broader short-term trend remains bearish, with the EMA structure acting as dynamic resistance above price.
Price is currently around 4,155 after a strong bearish move from the upper structure. The chart shows that gold is now reacting near a short-term reaction zone, but the recovery has not yet confirmed a bullish reversal.
The first sell area is around 4,222 - 4,243. This zone aligns with Fibonacci retracement, previous support turned resistance, and short-term liquidity. If price pulls back into this area and rejects, sellers may continue to defend the trend.
The second sell area is higher, around 4,320 - 4,341. This zone is stronger because it aligns with Fibonacci resistance, EMA pressure, and a larger support/resistance liquidity area. If gold retraces deeper into this zone, it may offer another sell opportunity with a wider structure.
The main downside target remains the Fibonacci 1.618 liquidity convergence zone around 4,066 - 4,065.
Important Key Levels
Current price area: 4,155
Reaction zone: 4,170 - 4,180
Sell zone 1: 4,222 - 4,243
Sell zone 2: 4,320 - 4,341
EMA resistance area: 4,254 - 4,320
Liquidity convergence target: 4,066 - 4,065
Invalidation for sell zone 1: above 4,254
Invalidation for sell zone 2: above 4,341
Trading Scenario
Sell Scenario 1 — Fibonacci Support Retest
Entry: 4,222 - 4,243
Stop Loss: 4,254
Take Profit 1: 4,170
Take Profit 2: 4,120
Take Profit 3: 4,066 - 4,065
Sell Condition
The first sell setup is to wait for gold to pull back into 4,222 - 4,243. This area is the nearest Fibonacci and support/resistance retest zone.
A sell setup becomes more valid if price forms bearish rejection from this zone, such as a long upper wick, bearish engulfing candle, failed breakout, or lower high below the EMA structure.
Sell Scenario 2 — Higher Liquidity Sell Zone
Entry: 4,320 - 4,341
Stop Loss: 4,365
Take Profit 1: 4,243
Take Profit 2: 4,170
Take Profit 3: 4,066 - 4,065
Sell Condition
The second sell setup is only considered if gold retraces deeper into 4,320 - 4,341. This is the stronger liquidity and Fibonacci resistance zone on the chart.
A rejection from this area would show that buyers failed to reclaim the EMA resistance zone. If sellers defend this level, the next bearish leg may target 4,243 first, then 4,170 and the Fibonacci 1.618 target around 4,066 - 4,065.
Entry Conditions
Wait for price to retest one of the sell zones.
Look for bearish rejection before entering sell.
Do not sell directly at the low without a pullback.
A break below 4,120 would strengthen the move toward 4,066.
If price breaks and holds above 4,341 - 4,365, the bearish setup should be reassessed.
Overall, the main view remains bearish while XAUUSD trades below EMA 34, EMA 89, and EMA 200. For next week, the preferred plan is to wait for a pullback into 4,222 - 4,243 or 4,320 - 4,341, then look for sell confirmation toward the Fibonacci liquidity convergence target around 4,066 - 4,065.
Do you share the same bearish view on gold for next week, or are you waiting for a cleaner pullback into the higher sell zone first?
MASON XAUUSD – Gold Tests Uptrend Buy Zone
XAUUSD is trading around 4,191 at the start of the week. Price is reacting from the marked buy zone and still respecting the rising trendline, showing that buyers are trying to rebuild the short-term uptrend.
The main view is bullish recovery, but confirmation above 4,220–4,240 is still needed.
Technical View
Gold reacted accurately from the 4,160–4,180 buy zone, which is also close to the rising trendline support. This area is important because it shows where buyers are defending the current uptrend wave.
Price Action is forming a recovery attempt after the previous drop. As long as price holds above the buy zone, the market may continue to build higher lows and move toward the next resistance areas.
The first confirmation zone is 4,220–4,240. If gold breaks and holds above this area, buyers may gain stronger control and push price toward the liquidity zones above.
Ichimoku still shows that gold needs to recover into the cloud area before confirming a stronger bullish structure. A clean move back above the cloud would support the continuation view.
If price fails to hold the buy zone and breaks below the trendline, the recovery setup will weaken.
Key Zones
Current price: 4,191
Buy zone: 4,160–4,180
Trendline support: 4,160–4,180
Support: 4,220
Short-term confirmation: 4,240
Liquidity sell scalping zone: 4,265–4,275
Strong liquidity: 4,310–4,320
Invalidation: below 4,150
Trading Plan
Buy Priority: 4,160–4,180
Condition: wait for bullish rejection, higher low, or price holding above the rising trendline.
SL: below 4,150
TP1: 4,220
TP2: 4,240
TP3: 4,265–4,275
Final target: 4,310–4,320
Alternative Scenario
If gold breaks and holds above 4,240, wait for a retest before looking for continuation toward 4,265–4,275 and 4,310–4,320.
Sell View
Sell is not the priority while price holds above the buy zone and trendline. A short-term sell reaction may appear around 4,265–4,275, but it should only be considered if bearish rejection is clear.
Final View
Overall, gold is showing a bullish recovery setup at the start of the week. As long as 4,160–4,180 holds, buyers still have a chance to push price back toward 4,240 and higher liquidity zones.
Will gold confirm above 4,240, or retest the buy zone one more time?
XAUUSD May Recover Into The Cloud Before A New Trend DecisionMASON XAUUSD – Gold May Recover Into The Cloud Before A New Trend Decision
XAUUSD is trading around 4,155 after reacting strongly from the lower liquidity area. Price is still inside the descending channel and remains below the Ichimoku cloud, so the larger structure is not bullish yet.
However, after filling the liquidity gap and reacting from the psychological buy zone, gold may form a technical recovery before choosing the next direction.
Technical View
Gold is still moving inside a clear descending price channel. The main trendline resistance above price continues to guide the broader bearish structure.
Price is also below the Ichimoku cloud, which means sellers still have control from the trend perspective. A real trend shift needs price to recover back into the cloud first, then hold above it with strong price action.
The important point is the reaction from the lower channel area near 4,030–4,060. This zone acted as a psychological buy area, and the reaction shows that sellers may be slowing down after the previous strong drop.
Price Action is now showing an early recovery attempt. If gold holds above 4,120–4,150, it may continue toward 4,220–4,240 and move back into the cloud zone.
But if price fails to hold above the current recovery area, the bearish channel remains dominant and gold may retest the lower liquidity zone again.
Key Zones
Current price: 4,155
Psychological buy zone: 4,030–4,060
Short-term support: 4,120–4,150
Cloud recovery zone: 4,220–4,250
Resistance: 4,350–4,380
Key price range: 4,500–4,530
Invalidation for recovery: below 4,030
Trading Plan
Buy Recovery Priority: 4,120–4,150
Condition: wait for bullish rejection, higher low, or price holding above the lower channel reaction zone.
SL: below 4,030
TP1: 4,220–4,250
TP2: 4,350–4,380
TP3: 4,500–4,530
Alternative Scenario
If gold breaks above 4,250 and holds inside the Ichimoku cloud, wait for a retest before looking for continuation toward 4,350–4,380.
Sell View
Sell is not ideal after price already reacted from the lower liquidity area. A better sell setup may appear only if gold rejects strongly from the cloud zone or the upper trendline resistance.
Final View
Overall, gold is still in a bearish channel and below Ichimoku, but the strong reaction from the lower liquidity zone suggests a recovery phase may come first. The key is whether price can enter the cloud and hold above 4,220–4,250.
Will gold recover into the Ichimoku cloud first, or reject early and return to the lower channel?
#SOBHA CUP and HANDLE formed in monthly timeframe🔵 TECHNICAL SETUP
An CUP and HANDLE chart pattern has been formed in the monthly timeframe in SOBHA ltd. It had broken out of its all time high of 1200 around Jan 2024 and has been consolidating since at lower volume which validates the bullish setup. The trendines suggest that the consolidation phase might be soon over and the stock may turn bullish in the upcoming months. RSI also suggest that the stock is currently neutral. This setup makes it a attractive buy around 1600-1700 if the breakout of the trendline occurs with a target range around 3000 with a stoploss of around 1000.
⚠Disclaimer: This is for demonstration and educational purpose only. This is not buying or selling recommendations. I am not SEBI registered. Please consult your financial advisor before taking any trade.
GBPUSD — Bearish Continuation From EMA & Fibonacci Value Zone
Fundamental Analysis
GBPUSD remains under pressure as price continues to trade below the main EMA structure. For next week, traders should keep watching USD momentum, U.K. data, and broader risk sentiment.
For now, the technical structure still favours sellers while recovery attempts remain capped below EMA resistance.
Technical Analysis
On the 4H chart, GBPUSD is still moving inside a bearish structure, with EMA 34, EMA 89, and EMA 200 positioned above price. This confirms that the broader trend remains bearish.
Price recently broke below the strong support zone around 1.3305 - 1.3324 and continued lower toward 1.3170 - 1.3180. The current move looks like a short-term recovery after a strong bearish displacement, not a confirmed bullish reversal.
The key sell zone is around 1.3305 - 1.3324. This area is important because it combines the previous strong support, Fibonacci 0.5 retracement, EMA resistance, and the support-turned-resistance structure.
The second reaction area is around 1.3275 - 1.3285, near the Fibonacci 0.618 zone. This may offer a short-term sell scalping reaction if price fails to reclaim higher structure.
The main downside target for next week is around 1.3090 - 1.3089, which aligns with the lower bearish projection and liquidity target on the chart.
Important Key Levels
Current price area: 1.3228
Sell scalping zone: 1.3275 - 1.3285
Main sell zone: 1.3305 - 1.3324
EMA resistance area: 1.3305 - 1.3370
Strong support turned resistance: 1.3305 - 1.3324
Short-term downside level: 1.3180
Main weekly target: 1.3090 - 1.3089
Invalidation area: above 1.3370
Trading Scenario
Main Sell Scenario
Entry: 1.3305 - 1.3324
Stop Loss: 1.3370
Take Profit 1: 1.3180
Take Profit 2: 1.3140
Take Profit 3: 1.3090 - 1.3089
Sell Condition
The preferred setup is to wait for GBPUSD to pull back into the 1.3305 - 1.3324 sell zone. This area aligns with Fibonacci retracement, EMA resistance, and the previous support zone that has now turned into resistance.
A sell setup becomes more valid if price forms bearish rejection from this zone, such as a long upper wick, bearish engulfing candle, failed breakout, or lower high below the EMA structure.
If price rejects from the sell zone and breaks back below 1.3180, the bearish continuation view becomes stronger. The next downside focus would be 1.3140, followed by the weekly target around 1.3090 - 1.3089.
Alternative Sell Scalping Zone
Entry: 1.3275 - 1.3285
Stop Loss: 1.3325
Take Profit 1: 1.3228
Take Profit 2: 1.3180
Take Profit 3: 1.3140
Sell Condition
This is the earlier sell reaction zone. It is only valid if price reaches 1.3275 - 1.3285 and shows clear bearish rejection below the main EMA resistance.
If price breaks strongly above this zone, the better setup is to wait for the main sell zone around 1.3305 - 1.3324.
Entry Conditions
Wait for price to retest the Fibonacci sell zone.
Look for bearish rejection before entering sell.
A break below 1.3180 confirms stronger downside pressure.
If price breaks and holds above 1.3370, the sell setup is invalid.
Overall, the main view for next week remains bearish while GBPUSD stays below EMA 34, EMA 89, EMA 200, and the broken support structure. The preferred plan is to wait for a pullback into the Fibonacci and EMA value zone around 1.3305 - 1.3324, then look for sell confirmation toward 1.3180 and 1.3090 - 1.3089.
Do you share the same bearish view on GBPUSD for next week, or are you waiting for a cleaner rejection from the EMA and Fibonacci value zone?