Part 8 Trading Master Class With Experts Understanding Options: A Quick Foundation
An option is a contract giving the buyer the right, but not the obligation, to buy or sell an underlying asset at a fixed price (strike price) on or before expiration.
Call Option → Right to buy
Put Option → Right to sell
Option buyers pay a premium and have limited risk but unlimited or significant upside.
Option sellers (writers) receive the premium but hold potentially large risk.
Strategies combine long/short calls and puts to shape unique payof
Trend Line Break
Part 7 Trading Master Class With Experts Option Expiry and Settlement
Options have fixed expiry cycles:
Weekly expiry: For most index options (NIFTY, BANKNIFTY, FINNIFTY).
Monthly expiry: For stock options.
Last Thursday of each month for monthly contracts.
At expiry:
ATM options lose all time value.
ITM options settle for intrinsic value.
OTM options expire worthless.
Time decay accelerates dramatically in the last week.
Part 6 Learn Institutional Trading Buyers vs. Sellers
Option Buyers
Pay premium.
Limited risk (premium only).
Unlimited reward potential.
Low probability of profit (because time decay erodes premium).
Option Sellers (Writers)
Receive premium.
Limited profit (premium only).
Can face huge losses.
High probability of profit (because time decay works in their favor).
Professional traders often prefer selling options, but with strict risk management.
UEducation
Candle Pattern Practical Tips for Using Candlestick Patterns
Combine with Trend Analysis:
Always consider the prevailing trend. A reversal pattern is more meaningful if it aligns with trend exhaustion signals.
Confirm with Volume:
Higher volume strengthens the validity of candlestick signals.
Use with Technical Indicators:
Combine patterns with moving averages, RSI, MACD, or Fibonacci levels for more reliable entries and exits.
Time Frame Matters:
Patterns are more reliable on higher time frames (daily, we
Premium Chart Patterns Practical Application of Chart Patterns
Chart patterns are not foolproof but are valuable tools when combined with other technical indicators. Traders often use volume analysis to confirm pattern breakouts, as significant volume adds credibility to the pattern. Risk management is essential, with stop-loss orders placed strategically around pattern levels. Additionally, price targets can be estimated using pattern height or measured moves, enhancing trade planning.
Limitations of Chart Patterns
Market Bubbles & Crashes in IndiaHistorical Context of Market Bubbles in India
India's financial markets have evolved over the last century, but the modern stock market history largely starts post-independence. The Bombay Stock Exchange (BSE), established in 1875, has been the central hub for trading activity, now supplemented by the National Stock Exchange (NSE), founded in 1992. Throughout this history, India has experienced multiple market bubbles and crashes, some unique to its economic environment and others reflective of
Event-Based Trading: A Comprehensive OverviewTypes of Events in Event-Based Trading
Event-based trading revolves around various types of events that can materially impact the value of securities. These events are generally categorized into corporate, economic, political, and market-wide events:
Corporate Events
These include events directly related to individual companies. Key examples include:
Earnings Announcements: Quarterly or annual earnings reports often trigger sharp price movements, especially if results deviate significantly fr
Revenge Trading & Emotional ControlWhat Is Revenge Trading?
Revenge trading is the emotional attempt to immediately recover losses by placing impulsive, oversized, or irrational trades. It typically occurs after a trader:
Takes a big loss
Misses a trading opportunity
Feels unfairly “punished” by the market
Believes the market “owes” them a win
Experiences frustration or anger over previous trades
Instead of following their trading plan, the trader reacts emotionally, trying to “win it back” as quickly as possible. This beh
Part 2 Ride The Big Moves What Are Options?
An option is a financial contract that gives the buyer the right, but not the obligation, to buy or sell an underlying asset at a pre-decided price within a specific time.
There are two types of options:
Call Option – Gives the right to buy the asset at a fixed price.
Put Option – Gives the right to sell the asset at a fixed price.
The fixed price is known as the strike price, and the deadline to exercise the option is called the expiry date.
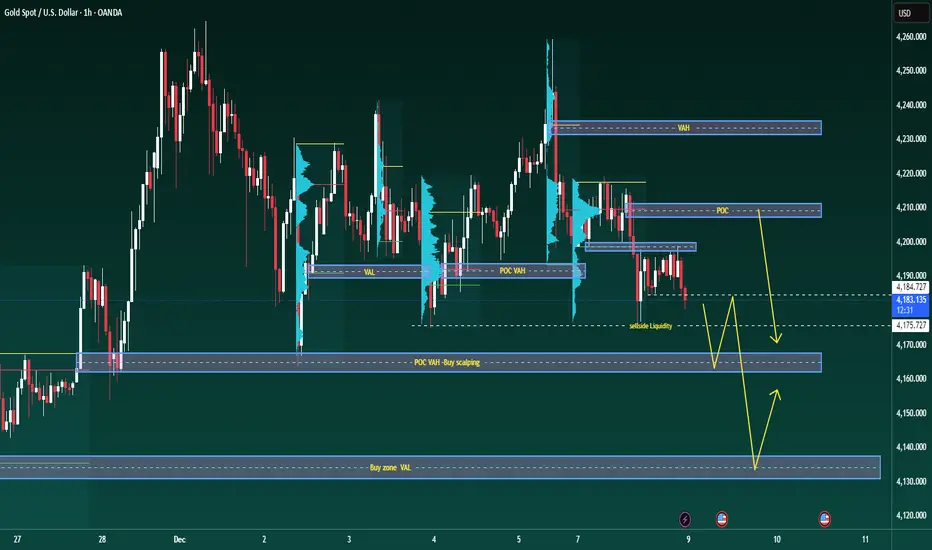
XAUUSD – Brian | After the rate cutXAUUSD – Brian | After the rate cut, Volume Profile still favours further downside
1. Market snapshot
After the rate cut, gold saw a bounce but failed to sustain the upside and is still hovering below last week’s highs.
In the Asian session, price only ticked up slightly before being sold off again – a sign that buying pressure is not particularly strong at these levels.
Risk-on sentiment has returned and the USD is seeing a modest recovery, which is weighing on XAU/USD.
That said, expectat
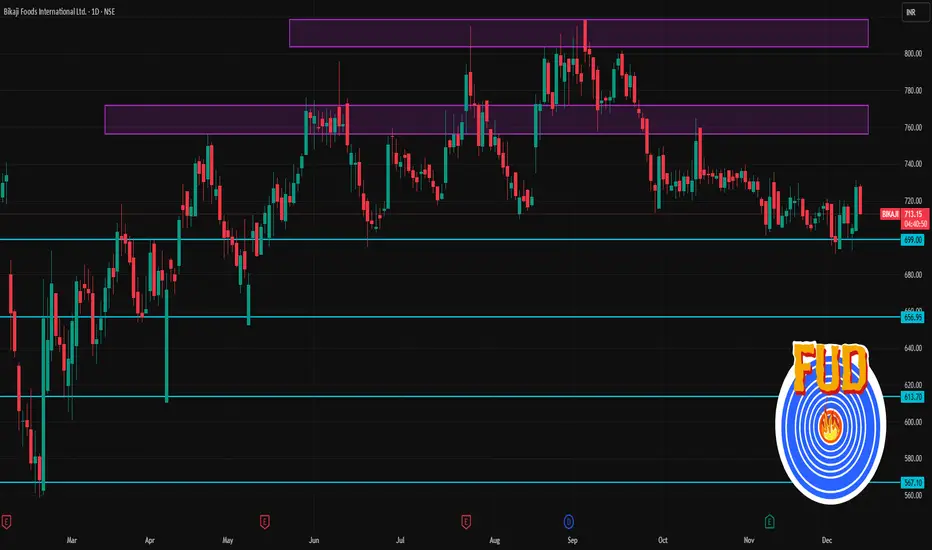
BIKAJI 1 Day Time Frame 📈 Recent Price & Basic Info
Latest price (NSE / BSE) ~ ₹725.60 (close on 10-Dec-2025)
Day’s range: ~ ₹703.90 to ₹731.15.
52-week range: ₹558.80 (low) to ~ ₹864.00 (high)
🧭 Support / Resistance / Pivot-based Levels (Daily)
From pivot-analysis (classic / Fibonacci / others) :
Pivot / Level Price (₹) / Range
Pivot (daily) ~ ₹724.95
Support 1 (S1)
ANGELONE 1 Week Time Frame 📈 Current Price & Technical Context
Recent quote: around ₹2,525–₹2,535.
According to a recent technical report, the stock’s 50-day and 200-day SMAs are near ₹2,526–₹2,561.
One recent analysis notes formation of a “Golden Cross” (50-DMA crossing above 200-DMA), which is bullish — but also points out that the stock is still trading slightly below 50-DMA, so a strong up-move depends on reclaiming that level.
The weekly technical outlook from a charting site flags a “neutral” trend this week.
BUY TODAY SELL TOMORROW for 5%DON’T HAVE TIME TO MANAGE YOUR TRADES?
- Take BTST trades at 3:25 pm every day
- Try to exit by taking 4-7% profit of each trade
- SL can also be maintained as closing below the low of the breakout candle
Now, why do I prefer BTST over swing trades? The primary reason is that I have observed that 90% of the stocks give most of the movement in just 1-2 days and the rest of the time they either consolidate or fall
Trendline Breakout in DOLATALGO
BUY TODAY SELL TOMORROW for 5%
Part 1 Ride The Big Moves Strategy Selection Using Market Conditions
Choosing the correct strategy depends on:
a. Trend Direction
Uptrend: Long calls, bull spreads.
Downtrend: Long puts, bear spreads.
Sideways: Iron condor, calendar spreads.
b. Volatility Expectation
High expected volatility: Straddle, strangle.
Low expected volatility: Credit spreads, condors.
c. Time to Expiry
Short expiry favors sellers due to fast time decay.
Long expiry favors buyers due to slower decay.
d. Liquidity
High open interest
Part 2 Intraday Trading Master Class Risk-Management Tips
Even the best strategy fails without discipline. Here’s the real game:
Avoid unlimited risk strategies early in your journey.
Never sell naked options without proper hedging.
Always size positions correctly—use only what you can afford to lose.
Monitor volatility (VIX, IV) before entering.
Know your exit even before you enter a trade.
Option Trading Strategies How Option Premium Is Determined
The premium of an option depends on multiple factors. These include:
1. Underlying Price (Spot Price)
Directly impacts option value.
Call premiums rise when price goes up
Put premiums rise when price goes down
2. Time to Expiry (Time Value)
Options lose value as expiry approaches. This is called time decay or theta decay.
3. Volatility (IV – Implied Volatility)
Higher volatility increases premiums because uncertainty is higher.
4. Interest Rates & Deman
Part 1 Candle Stick Patterns What Is an Option?
An option is a contract between a buyer and a seller.
The buyer pays a premium to purchase the right.
The seller receives the premium and takes on the obligation.
Every option contract has:
Strike Price – the predetermined price for buying or selling the asset
Expiry Date – the date on which the option contract ends
Premium – the cost of the option
Lot Size – fixed quantity of the underlying asset
Understanding these fundamentals is crucial before diving into live tra
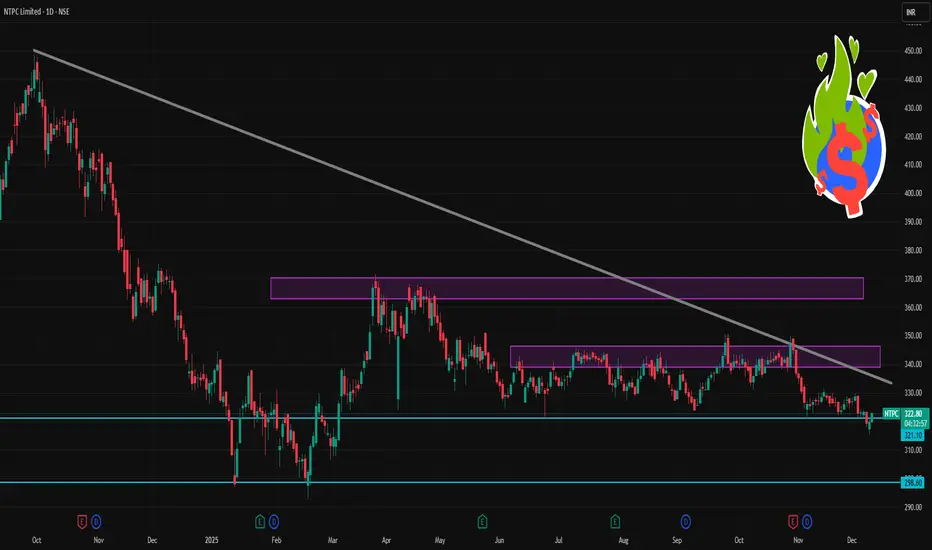
NTPC 1 Day Time Frame 📊 Current Price (Approx)
Trading around ₹319–₹320 on NSE (latest intraday range) — this is the most recent live price you’ll see on charts right now (delayed ~20 sec) and confirmed by TradingView data.
🎯 1-Day Pivot & Support-Resistance Levels
✅ Pivot Point
Central Pivot: ~₹318.9 – ₹319.4 (daily pivot based on recent range)
📈 Resistance Levels
R1: ~₹321–₹322 (first immediate hurdle)
R2: ~₹324–₹325 (stronger resistance)
R3: ~₹327–₹328+ higher barrier if momentum picks up
📉 Support Levels
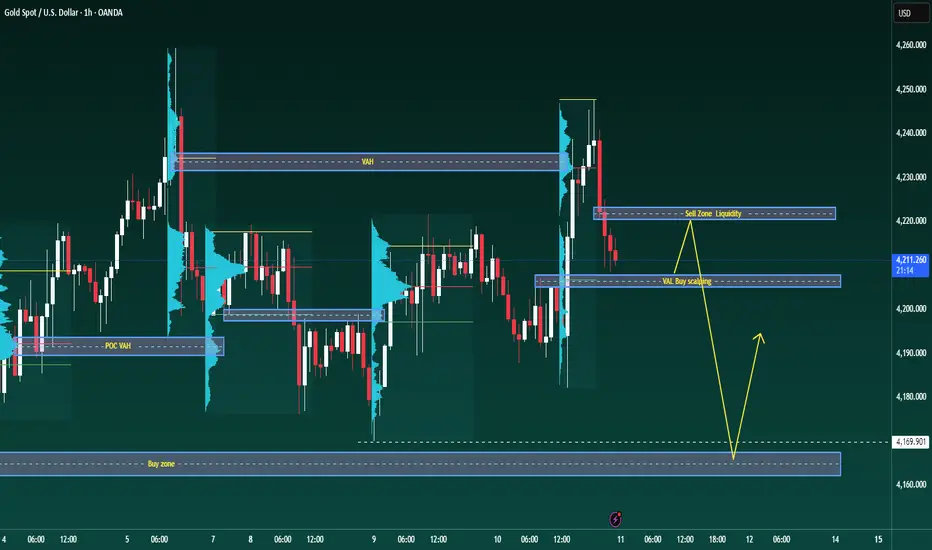
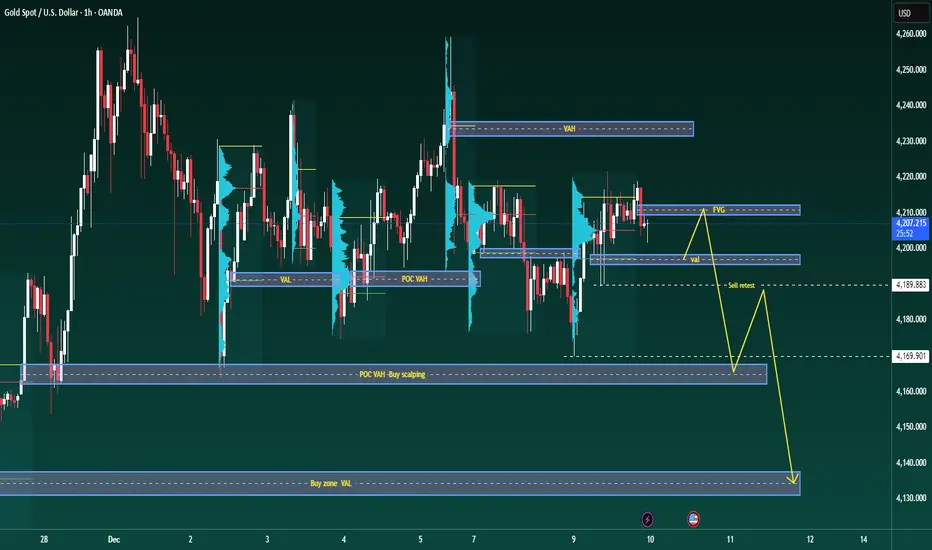
XAUUSD – Brian | Volume Profile before FedXAUUSD – Brian | Volume Profile before Fed: watch for a rebound to sell down
Market snapshot
Ahead of the Fed's interest rate announcement, gold is moving sideways within a fairly wide range, not yet choosing a clear direction.
In the H1 timeframe, the price fluctuates around the value area, making it very suitable for short-term trading according to the Volume Profile instead of trying to predict the meeting outcome.
Volume Profile – Key price areas
Nearest VAL: around 4.197 – the bottom o
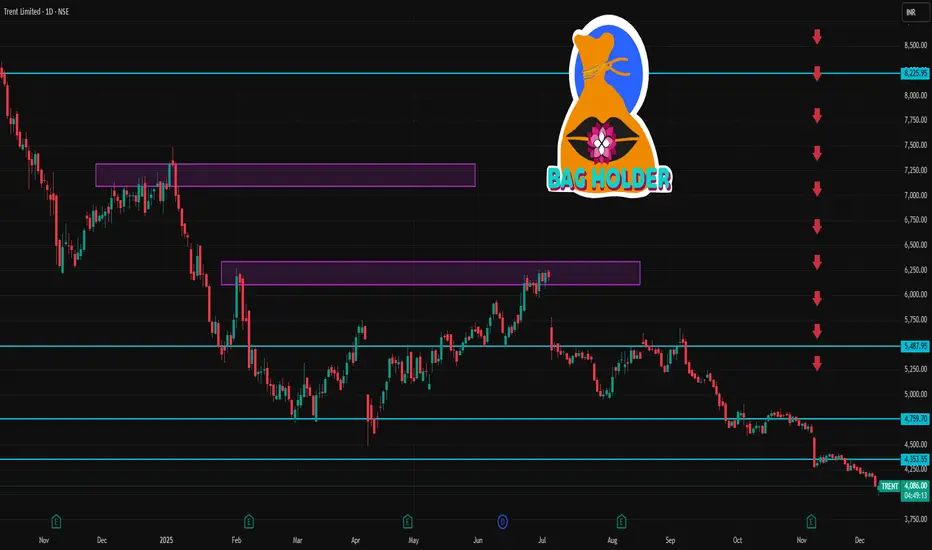
TRENT 1 Day Time Frame 📊 Current Price (approx): ~₹4,085 – ₹4,090 on NSE intraday.
✅ Intraday 1-Day Levels (Support & Resistance)
These levels are useful for short-term setups (day trades, scalps):
Resistance
R1: ~₹4,114 – ₹4,138 (today’s high area)
R2: ~₹4,190 – ₹4,214 (near recent intra-day retracement band)
R3: ~₹4,270 + (higher resistance from Fibonacci levels)
Pivot
Pivot / CPR area: ~₹4,060 – ₹4,080 (central pivot range)
Support
S1: ~₹4,009 – ₹4,030 (immediate support lower band)
S2: ~₹3,980 – ₹3,988
XAUUSD – Brian | H1 Volume ProfileXAUUSD – Brian | H1 Volume Profile: risk of deep decline as market awaits PCE data
Market snapshot
On H1, gold is declining in a rather "clean" structure, continuously creating lower highs and lower lows.
The 4.175 area is currently the nearest support – if breached, the decline could extend another 50–60 points to lower areas.
Price remains below 4.250 USD, as the market awaits PCE data (Fed's preferred inflation measure) to find a clearer direction.
Technical map – Volume Profile & price
BUY TODAY SELL TOMORROW for 5%DON’T HAVE TIME TO MANAGE YOUR TRADES?
- Take BTST trades at 3:25 pm every day
- Try to exit by taking 4-7% profit of each trade
- SL can also be maintained as closing below the low of the breakout candle
Now, why do I prefer BTST over swing trades? The primary reason is that I have observed that 90% of the stocks give most of the movement in just 1-2 days and the rest of the time they either consolidate or fall
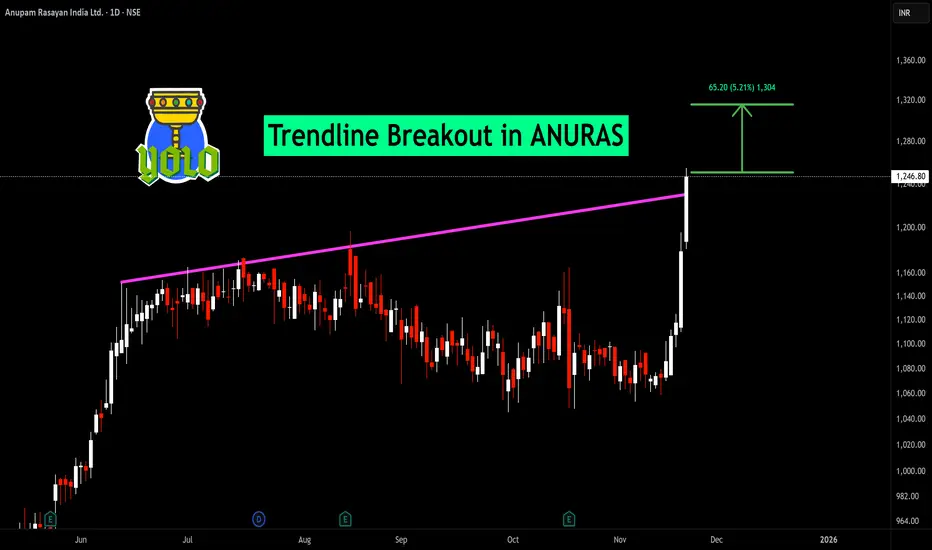
Trendline Breakout in Anuras
BUY TODAY SELL TOMORROW for 5%
BUY TODAY SELL TOMORROW for 5%DON’T HAVE TIME TO MANAGE YOUR TRADES?
- Take BTST trades at 3:25 pm every day
- Try to exit by taking 4-7% profit of each trade
- SL can also be maintained as closing below the low of the breakout candle
Now, why do I prefer BTST over swing trades? The primary reason is that I have observed that 90% of the stocks give most of the movement in just 1-2 days and the rest of the time they either consolidate or fall
Trendline Breakout in JPOLYINVST
BUY TODAY SELL TOMORROW for 5%