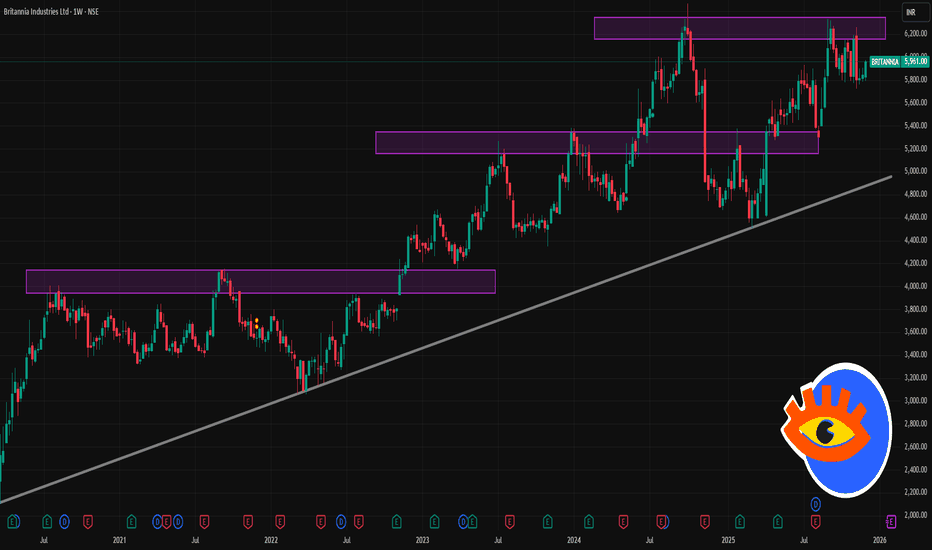
BRITANNIA 1 Week Time Feame 📊 Recent context & fundamentals
The stock is currently around ₹ 5,961.
52-week high / low: ~₹ 6,336 / ~₹ 4,506.
The company recently reported strong Q2 FY26 results — ~23% YoY rise in consolidated net profit, margin expansion, and stable commodity costs.
Overall valuation remains high (P/E ~ 62, high P/B), reflecting premium investor expectations.
✅ What looks favorable in next week
Given recent margin uptick, Q2 earnings beat, and technical strength, there is a moderate chance of continua
Trend Line Break
PCR Trading Strategies Basics of Options
Options come in two primary types:
Call Options: A call option gives the holder the right to buy the underlying asset at a specific price (known as the strike price) before or on the expiration date. Traders purchase calls if they anticipate the asset's price will rise.
Put Options: A put option gives the holder the right to sell the underlying asset at the strike price before or on expiration. Traders buy puts when they expect the asset's price to fall.
Key terms every opt
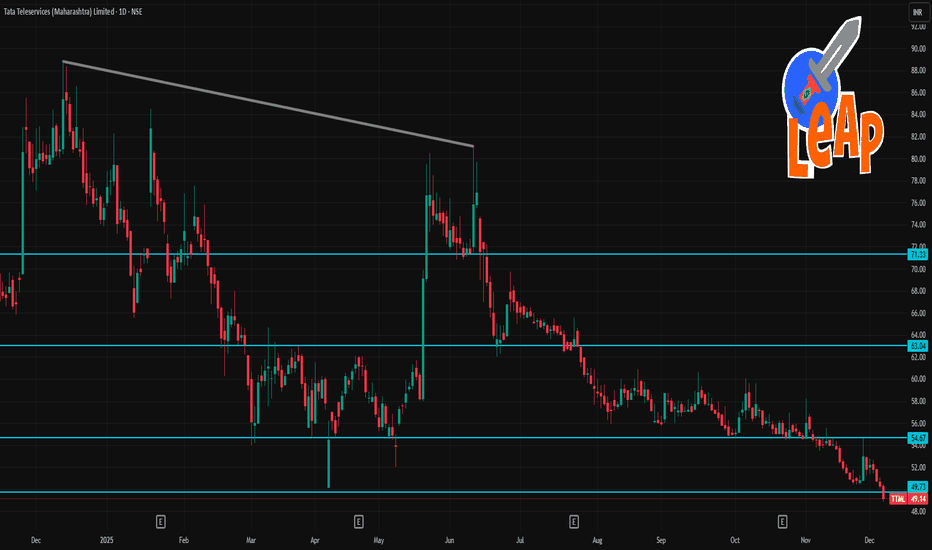
TTML 1 Day Time Frame 📈 Key data (as of 5 Dec 2025)
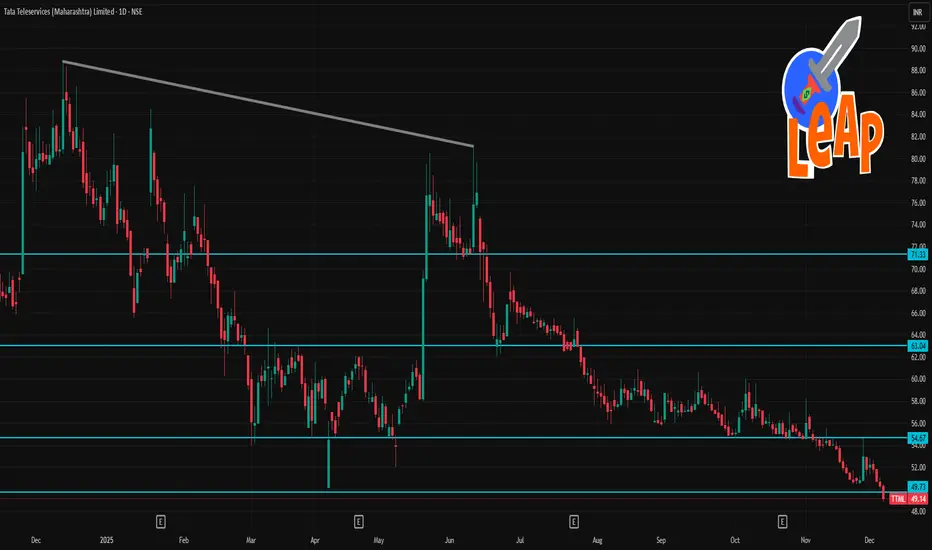
TTML closed around ₹ 49.14 – ₹ 49.16.
Day’s trading range: ≈ ₹48.83 – ₹50.46.
52-week range: ~ ₹48.83 (low) to ~ ₹88.90 (high).
🔎 Technical/Indicator Status (Short-Term)
According to a technical-analysis site: Most standard moving averages (5-day, 10-day, 20-day, 50-day, 100-day, 200-day) are signaling “Sell” on the 1-day chart.
Momentum indicators: 14-day RSI is ~ 27.6 (suggesting oversold).
Other indicators (MACD, Stochastic, CCI, etc.) also lean toward “S
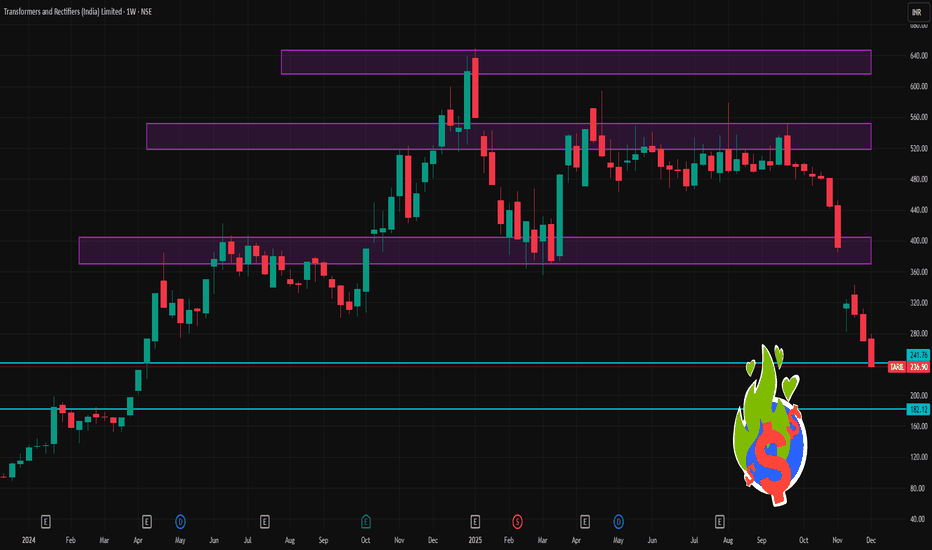
TARIL 1 Week Time Frame 📊 Where TARIL stands now
As of 5 Dec 2025, TARIL shares are trading around ₹236.90 — close to a 52-week low.
Over the past week, the stock has dropped ~12.6%.
The 52-week high remains near ₹650 — so the stock is trading ~63–65% below its peak — implying a major drop over the last year.
📰 Recent Developments (that impact next week)
✅ Positive / Potentially Supportive
The company recently secured a new order worth ₹53.33 crore from Power Grid Corporation of India for HVDC converter transfo
SME IPO BUZZ FOR HUGE PROFITS1. What Are SME IPOs — And Why the Buzz?
SME IPOs are public issues floated by Small and Medium Enterprises that list on specialized platforms like:
NSE SME (Emerge)
BSE SME
These platforms provide small companies a chance to raise capital and investors an opportunity to participate in early-stage growth stories.
Why SME IPOs Have Become a Hot Trend
Massive oversubscriptions
Many SME issues are oversubscribed 100x to even 800x, reflecting huge liquidity and demand.
High listing gains
Many
Trading Psychology – The Mental Edge of Successful Traders1. Why Trading Psychology Matters More Than Strategy
A trading strategy is important, but even the best strategy can fail if the trader cannot execute it with discipline.
For example:
A trader may exit too early due to fear.
A trader may hold losing positions due to hope.
A trader may overtrade due to greed or excitement.
A trader may avoid taking trades due to hesitation after losses.
These behaviors have nothing to do with strategy—they are psychological errors. Markets reward logic, not
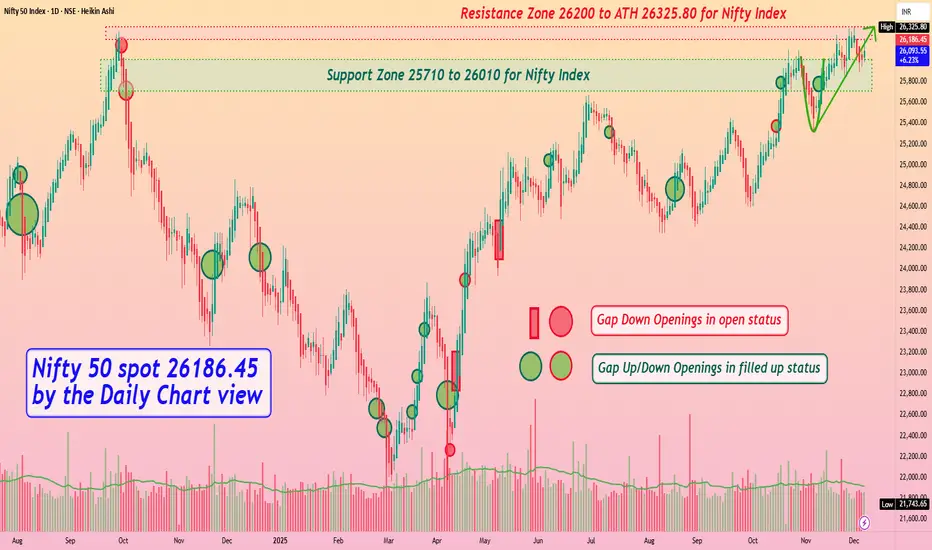
Nifty 50 spot 26186.45 by Daily Chart view - Weekly updateNifty 50 spot 26186.45 by Daily Chart view - Weekly update
- Support Zone 25710 to 26010 for Nifty Index
- Resistance Zone 26235 to ATH 26310.45 for Nifty Index
- Anticipate the subdued Bullish momentum to continue for Nifty 50
- Moreso Geo-Political tariff tricklers with certain Domestic factors creating weakness
Part 8 Trading Master Class With ExpertsStrike Price
The strike price is the pre-decided level at which a call or put buyer can buy or sell the asset.
Example: If Nifty is trading at 22,000, you may choose from strikes like 21900, 22000, 22100, etc.
Expiry
Every option has a validity period. After that, it expires.
In India:
Index options (Nifty, Bank Nifty) have weekly expiries.
Stock options have monthly expiries.
Part 7 Trading Master Class With Experts What Are Options?
Options are derivative instruments whose value is derived from an underlying asset such as Nifty, Bank Nifty, stocks, commodities, or currencies.
An option is a contract between a buyer and seller regarding the future price of an asset within a specific time.
There are two types of options:
Call Option (CE) – Gives the buyer the RIGHT (but not the obligation) to BUY the asset at a fixed price (strike price).
Put Option (PE) – Gives the buyer the RIGHT (but not the obligatio
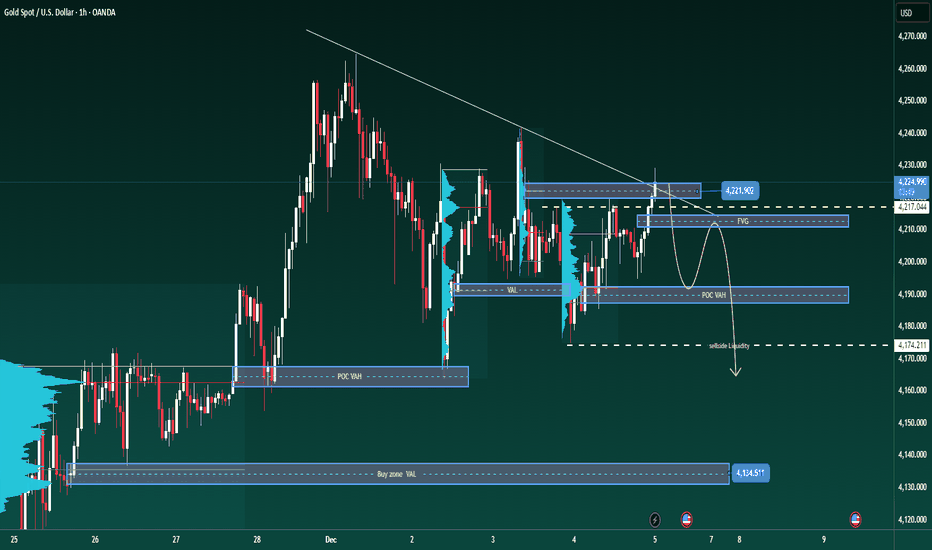
XAUUSD – Brian | Volume Profile & TrendlineXAUUSD – Brian | Volume Profile & Trendline: prioritize Sell, wait for a “good deal” in the liquidity zone
1. Market snapshot
On H1, gold is touching the trendline just as yesterday's scenario – this is an area where strong price reactions may occur.
The current structure shows that the price is gradually distributing below the trendline, with no clear signal that buyers have regained control.
In the short term, Brian prioritizes the Sell scenario, utilizing the POC – VAH – FVG areas of the V
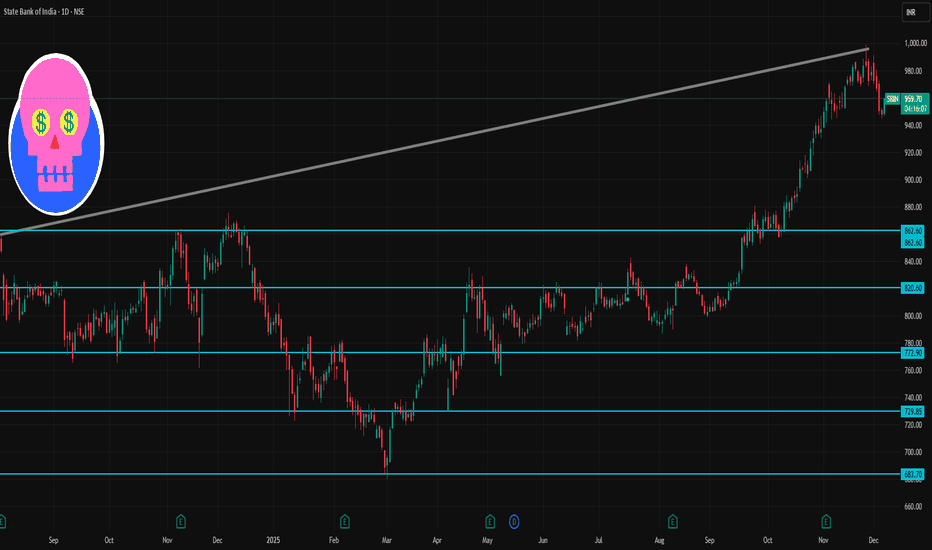
SBI 1 Day Time Frame 📌 Current Price Context
According to recent sources, SBI is trading around ₹949–₹957 (NSE/BSE) depending on the feed.
Its 52‑week trading range remains roughly ₹680 (low) to ₹999 (high).
🎯 What to Watch: Possible Scenarios
Bullish bias: If price holds above pivot (~₹988) and breaks above R1 (~₹994.5), watch for a move toward ~₹1005–₹1010+.
Neutral / Range‑bound: If price oscillates between support (~₹977–₹971) and pivot/resistance zone (~₹988–₹994), expect sideways movement.
Bearish bias:
Unlocking Market Rotations1. What Are Market Rotations?
Market rotations occur when institutional investors—mutual funds, hedge funds, pension funds, sovereign wealth funds—shift large pools of capital from one sector or asset class to another. These shifts often occur in anticipation of economic changes, earnings trends, or policy actions.
For example:
When interest rates fall, money flows into high-growth tech stocks.
When inflation rises, capital rotates toward commodities and energy.
During recessions, investors
Coforge (D): Strongly Bullish, Triple Top BreakoutTimeframe: Daily | Scale: Linear
The stock has confirmed a major breakout from a 6-month consolidation structure. By closing above the triple-test resistance zone, the "bearish" triple top pattern has been invalidated and converted into a bullish breakout .
📈 1. The Long-Term Structure (The Reversal)
> The Cycle:
- Peak: ATH of ~2,005 in Dec 2024.
- Correction: A downward spiral until April 2025 .
- Turnaround: Since April, the stock has shifted structure to Higher
Part 3 Learn Institutional Trading Expiry & Settlement Terms
a) Index Options (Nifty, Bank Nifty)
They are settled in cash, not in shares.
b) Stock Options
They are settled through physical delivery of shares if the contract expires in-the-money.
c) European Style Options (India)
Indian markets allow exercise only on expiry day, unlike American options (any time).
d) Premium Settlement
Premium is paid upfront while taking the position.
e) Final Settlement Price (FSP)
Exchanges calculate it based on the closing price of t
Part 2 Ride The Big MovesMargin Requirements: Critical Conditions
Margins are financial requirements that protect the market from defaults.
a) Initial Margin
This is required when the position is opened. It includes:
SPAN margin
Exposure margin
b) Maintenance Margin
Traders must maintain a minimum balance to keep positions open.
c) Additional Margin
If volatility increases, brokers may collect extra margins.
d) Physical Delivery Margin
Mandatory if stock options are taken near expiry.
e) Penalties
Failure t
Part 1 Ride The Big Moves Obligations of Option Sellers
Option sellers carry more responsibility:
a) Seller Must Follow Buyer’s Decision
If the buyer decides to exercise, the seller must honor the contract.
b) Unlimited Risk for Naked Sellers
Losses can be unlimited if markets move strongly against the seller.
c) Mandatory Margin Requirement
Sellers need to maintain margin balance to cover potential losses.
d) Mark-to-Market Loss Adjustments
Brokers deduct daily losses from the seller’s trading account.
e) Phy
Part 2 Intraday Master ClassRights of Option Buyers
Option buyers have certain rights defined by the exchange:
a) Right to Buy (Call Buyer)
The buyer can buy the asset at the strike price even if market price is higher.
b) Right to Sell (Put Buyer)
The buyer can sell at the strike price even if market price is lower.
c) No Obligation to Exercise
If the market is not favorable, traders can let the contract expire without exercising.
d) Limited Risk
The maximum loss for option buyers is the premium paid.
e) Unlimit
Candle Patterns Knowledge How to Use Candle Patterns in Trading
Candle patterns work best when combined with trend direction, volume, support/resistance, and market structure. Here’s how traders practically use them:
1. Always check the trend
Candlestick patterns give reliable signals only when aligned with the trend.
In uptrends, look for bullish continuation or reversal patterns.
In downtrends, look for bearish confirmation.
2. Use with support and resistance
Candle patterns at key levels are extremely powerful.
Premium Chart Patterns Knowledge How to Trade Chart Patterns
To trade chart patterns effectively:
A. Identify the Trend First
Reversal patterns work best after strong trends.
Continuation patterns form within established trends.
Trend context increases accuracy.
B. Wait for Confirmation
Never act only on shape.
Confirmation includes:
Breakout from neckline or trendline
Increase in volume
Candle close beyond levels
C. Set Entry Points
Examples:
Breakout above resistance (for bullish patterns)
Breakdown below suppo
MAS Financial cmp 313 by Daily Chart viewMAS Financial cmp 313 by Daily Chart view
- Support Zone 275 - 295 Price Band
- Resistance Zone 325 to 345 Price Band
- Falling Resistance Trendline Breakout seems been sustained
- Repeat Bullish Rounding Bottoms done with last in making process
- Volumes are seen to be in decent sync with the average traded quantity
- Good accumulation since August 2025 within Support and Resistance Zone
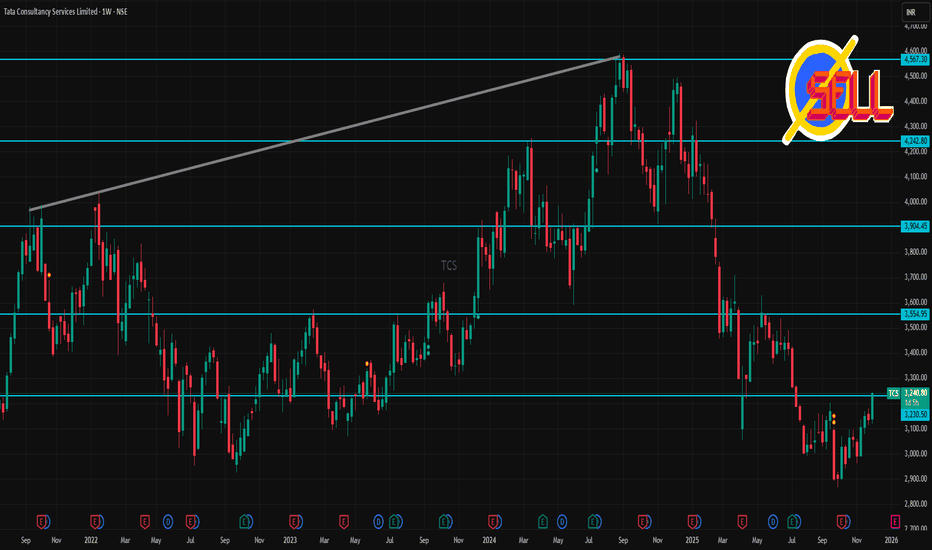
TCS 1 Week Time Frame 🔎 Recent snapshot
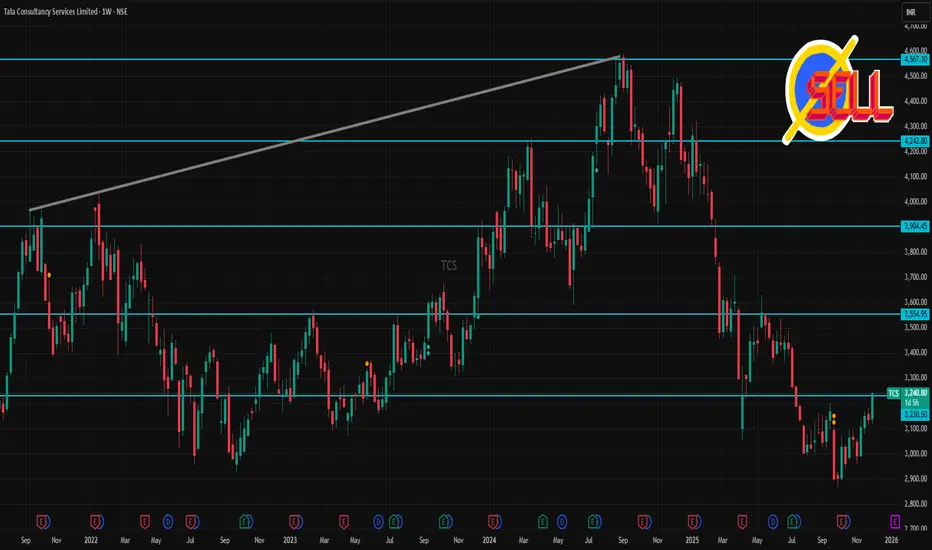
According to a recent technical‑analysis update, TCS has support near ₹2,970–₹2,870 and resistance near ₹3,170, ₹3,207, ₹3,270 on the shorter‑term charts.
On a weekly / medium‑term view, some oversold‑indicator signals have been flagged, suggesting the stock could attempt a rebound if support holds.
Analysts’ longer‑term target (12‑month) sits around ₹3,505–₹3,470, implying moderate upside from current levels.
⚠️ What could derail upside
If the stock falls below the lower
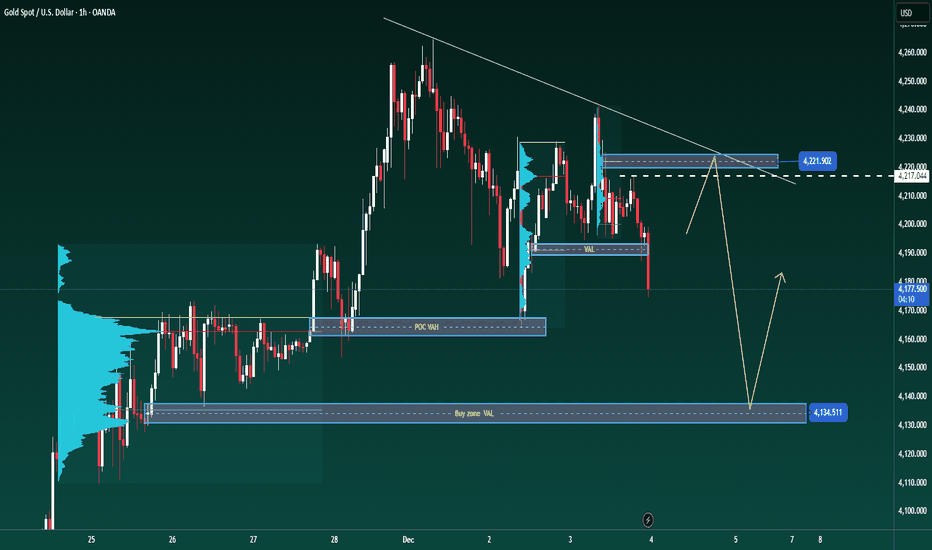
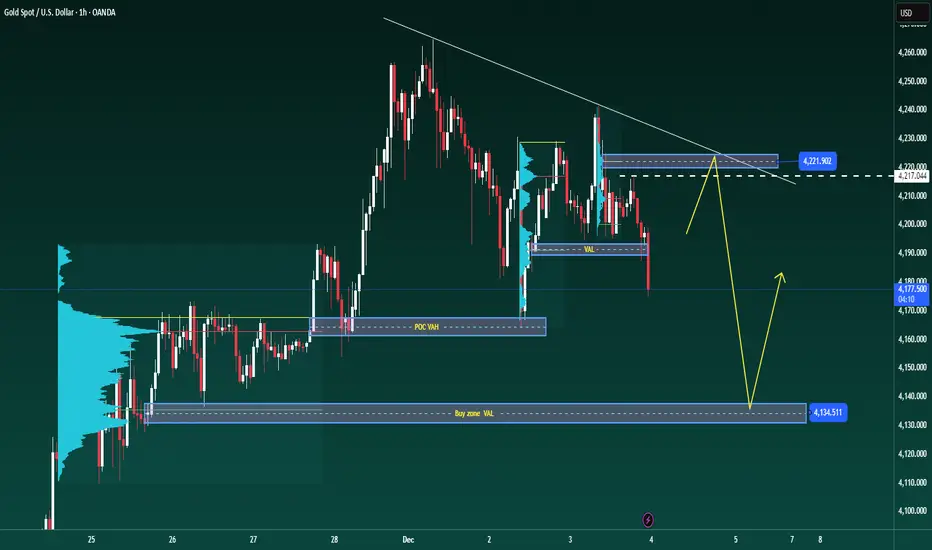
XAUUSD –| watch reaction at POC – VAL – VAH according to VolumeXAUUSD – Brian | watch reaction at POC – VAL – VAH according to Volume Profile
1. Market snapshot
Gold is entering a redistribution phase in the high price range, with fluctuations mainly revolving around large volume clusters on the Volume Profile. In this context, Brian's current priority scenario is to watch for a Sell when the price approaches the POC / VAL / VAH areas – where the market previously traded heavily.
2. Volume Profile – Notable price areas
POC – VAH area 4.217 is the price a