Premium Chart PatternsPremium chart patterns are advanced market structures that go beyond basic triangles, flags, and double tops. These patterns are used by experienced traders, institutional desks, and serious technical analysts to catch moves before the majority notices. What makes them “premium” is their reliability, deeper logic, and ability to identify institutional activity, liquidity traps, and major swing reversals.
While basic chart patterns rely on simple visual structures, premium patterns focus on pric
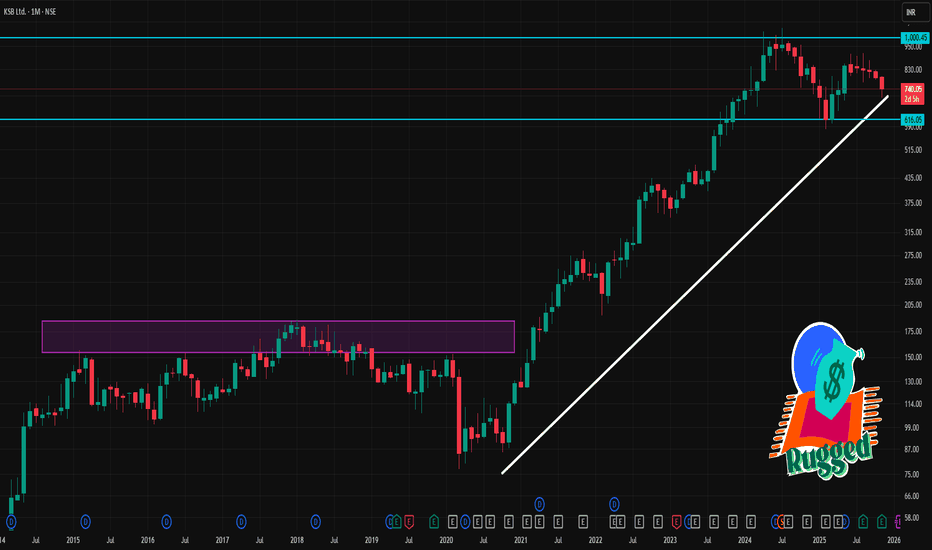
Trend Line Break
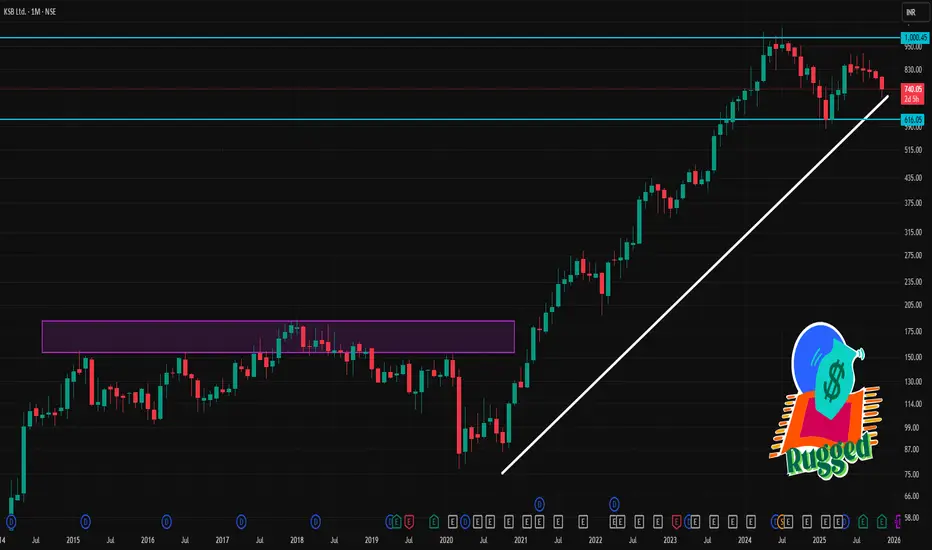
KSB 1 Month Time Frame 📊 Recent Price & Context
1. As of this week, KSB share price is trading around ₹ 740–748.
2. Over the past 1 month, the stock has seen a decline: some data suggest ~–10% to –12% monthly movement.
3. 52-week trading range: ~₹ 582 (low) to ~₹ 912 (high).
⭐ What this implies (1-Month Outlook)
Base case (neutral / consolidation): Price may hover between ₹ 702–750, possibly swinging around support-resistance zones if broader markets remain stable.
Bullish near-term bounce: If sentiment or funda
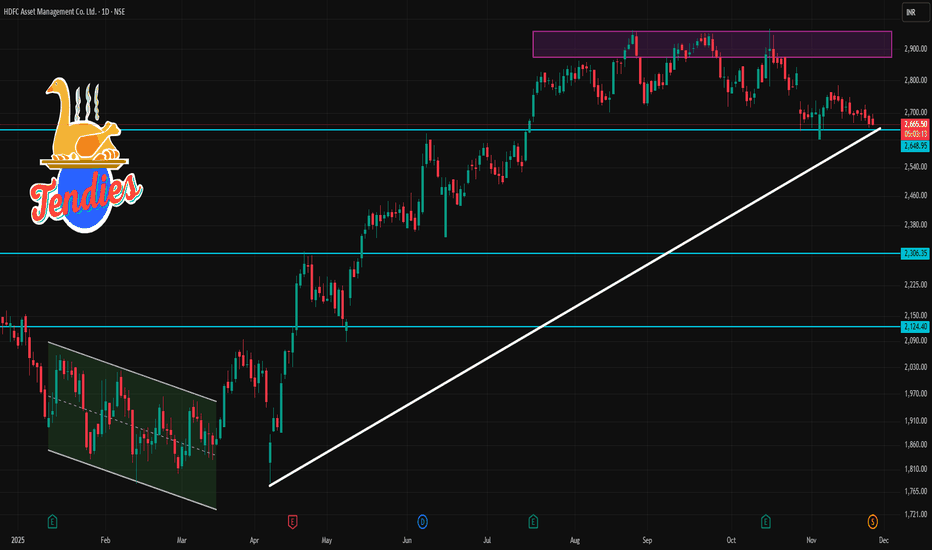
HDFCAMC 1 Day Time Frame 📊 Current Price & Context
1. Recent quoted price on several platforms is ~ ₹ 2,667 / ₹ 2,670 (on an adjusted basis, after its 1:1 bonus share issue) for HDFCAMC.
2. Historically (pre-bonus) the “old” nominal price was ~ ₹ 5,336–₹ 5,340.
3. The share is currently trading with valuation metrics: high P/E, high P/B (as per screener data) indicating it remains a premium/ high-valuation stock.
🎯 What This Means for Intraday / Short-Term Moves
If the price stays above the pivot (≈ ₹ 2,689), that
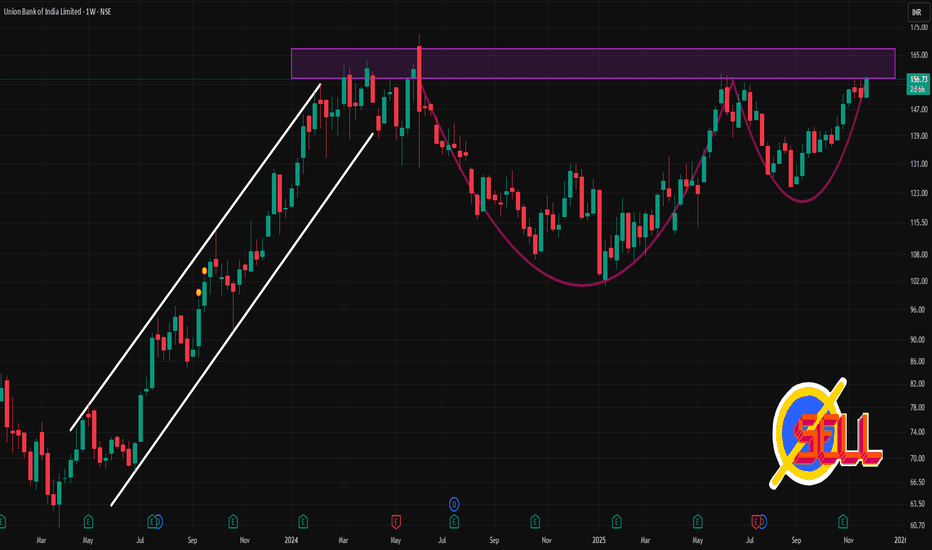
UNIONBANK 1 Week Time Frame 🔎 Current snapshot
Share price recently around ₹152.85–₹156.94.
52-week trading range: ~₹100.81 (low) to ~₹158.65 (high).
Fundamentals wise: low P/E vs peers, reasonable book value / dividend yield.
📈 Short-term (1-week) “Levels to watch”
Based on technical-forecast projections from providers:
Level type Price
Support (down-side) ~ ₹149.7
Alternate lower support
Introduction to DivergenceShould You Trade Options?
Options are powerful tools, but they require:
Understanding of market structure
Technical or quantitative edge
Patience and discipline
Clear strategy
Risk management
If you want leverage and flexibility, options are excellent.
If you want consistency and low risk, focus on credit spreads or hedged selling.
Introduction to Put-Call Ratio (PCR)Psychology in Option Trading
Option trading is not just technical—it's emotional.
Traders face:
Fear of missing out (FOMO)
Overtrading during high volatility
Holding losers too long
Expecting miracles from OTM options
Disciplined psychological control is essential.
Part 2 Intraday Trading Master ClassMargin and Risk Management
Option buying requires no margin except the premium.
Option selling requires high margin because:
Risk is unlimited.
Exchanges demand safety.
Risk Management Rules
Never sell naked options without stop-loss.
Avoid selling during high volatility events.
Use spreads to reduce risk.
Position size properly—do not over-leverage.
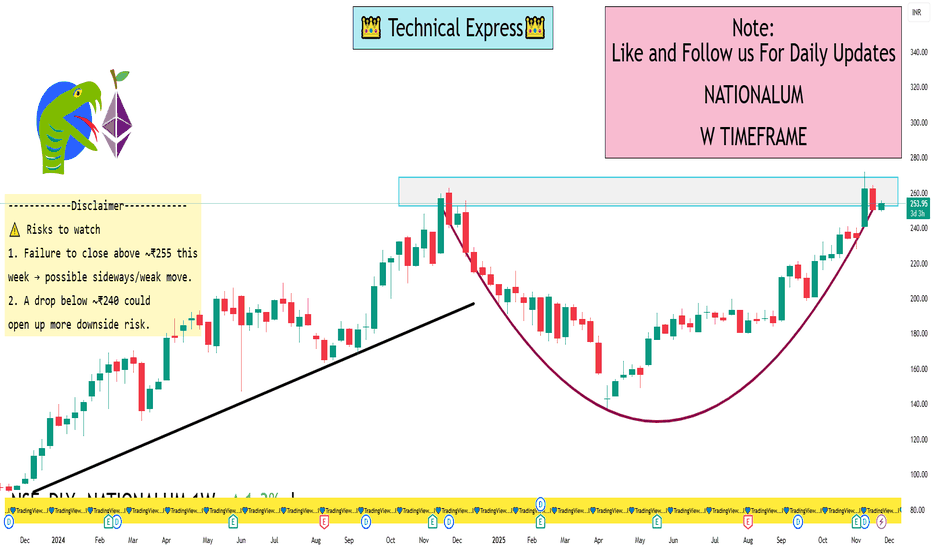
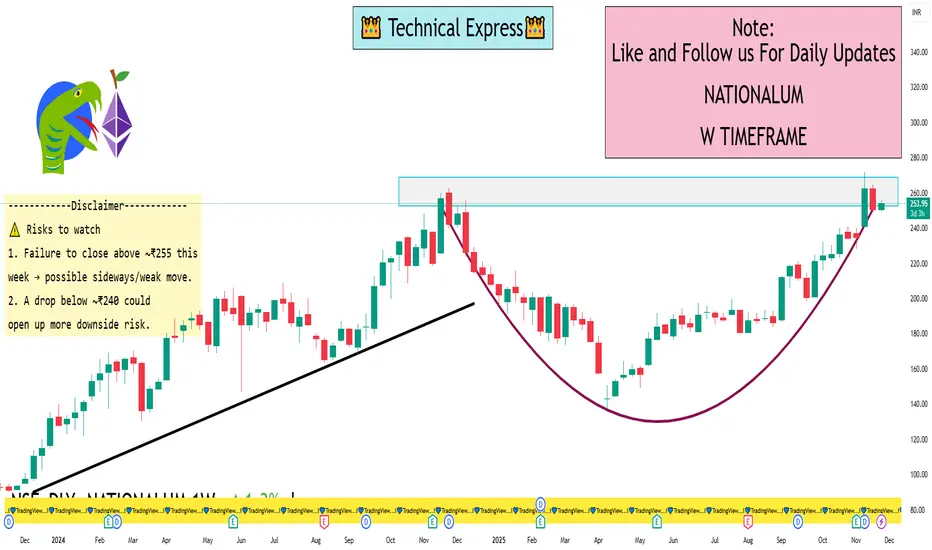
NATIONALUM 1 Week View 📊 Snapshot
Current price: ~ ₹253–254.
Weekly pivot (classic) on weekly timeframe: ≈ ₹254.92.
Weekly support levels: ≈ ₹245.54 (S1), ₹240.40 (S2)
Weekly resistance levels: ≈ ₹260.06 (R1), ₹269.44 (R2)
✅ Key levels to monitor this week
Near term resistance: ~ ₹255–256
Primary target if bullish: ~ ₹260
Extended upside: ~ ₹269 (if strong breakout)
Primary support: ~ ₹245.5
Secondary support: ~ ₹240
⚠️ Risks to watch
Failure to close above ~₹255 this week → possible sideways/weak move.
A
Option Greeks and Advanced Hedging Strategies1. Understanding the Core Option Greeks
1. Delta – Sensitivity to Price Movement
Delta measures how much an option’s price changes for a ₹1 change in the underlying asset.
Call options: Delta ranges from 0 to +1.
Put options: Delta ranges from 0 to –1.
High-delta options behave almost like the underlying, while low-delta options react slowly.
Use: Directional trades, risk measurement, delta-neutral hedging.
2. Gamma – Rate of Change of Delta
Gamma shows how fast delta changes. It is highes
Microstructure Trading Edge1. What Is Microstructure Trading?
Microstructure trading focuses on:
Order flow (who is buying/selling and with what urgency)
Liquidity (where big orders sit in the book)
Bid–ask dynamics
Market maker behavior
Execution algorithms
Slippage and transaction cost analysis
Short-term price impact
Instead of predicting future prices using patterns, a microstructure trader reads the real intentions of market participants through order book changes, volume imbalances, and execution footprints
Swing Trading Secrets1. The Secret of Trend Recognition
The biggest secret of profitable swing trading is identifying the dominant trend of the market. Most novices try to pick tops and bottoms, but professionals follow the path of least resistance. Trend recognition means:
Uptrend: Higher highs (HH) + higher lows (HL)
Downtrend: Lower highs (LH) + lower lows (LL)
Range: Price oscillates between support and resistance
Swing traders do not predict; they react. They align trades with the existing trend.
For examp
Traders’ Psychology in Indian Markets1. The Foundation of Trading Psychology
Trading psychology refers to the mindset and emotional framework that shapes how traders think, behave, and make decisions in the market. It includes:
Emotions like fear, greed, hope, and regret
Behavioural biases such as overconfidence or loss aversion
Mental discipline in following strategies
Risk-taking ability and rational thinking
The ability to stay calm under pressure
In India’s fast-moving markets—especially in derivatives where leverage is
Trading with Automated Systems in the Indian Market1. What Is Automated Trading?
Automated trading is a method of executing trades using pre-defined rules, strategies, and algorithms without requiring manual intervention. Instead of manually clicking buy or sell, traders write logic such as:
Buy Nifty futures when RSI < 30
Exit the trade when profit reaches ₹3,000
Place stop loss at 1%
Square off all positions by 3:20 PM
Once the rules are defined, the system executes trades automatically through the broker’s API.
In India, automated trad
Part 1 Support and Resistance What Are Options?
Options are derivative contracts, which means their value is derived from an underlying asset such as stocks, indices, commodities, or currencies. In India, the most traded options revolve around:
Nifty 50
Bank Nifty
FinNifty
Stocks in the F&O list
An option contract gives a trader a right but not an obligation. This is what separates option buyers from option sellers.
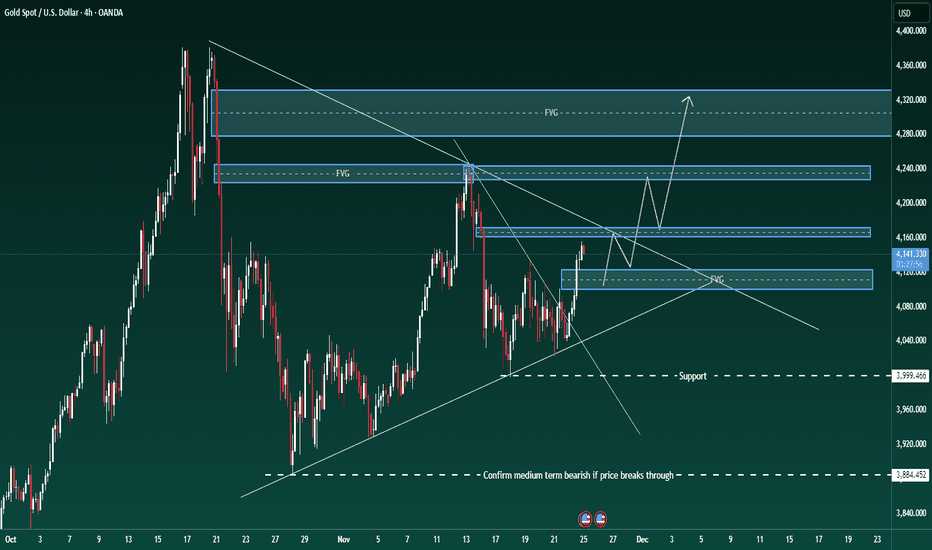
Brian – Gold game plan for the US sessionBrian – Gold game plan for the US session
Gold’s rally yesterday shook a lot of traders out of position – the move was slow, steady and unforgiving, making it hard both to get in and to get out. For now, the short-term trend is clearer on H1, while H4 is still in transition.
Fundamental view – the Fed is confusing everyone
Fed expectations for December have been on a roller-coaster:
The market went from pricing a 25 bp cut in December at over 90%,
Then collapsed those odds to below 30%,
And h
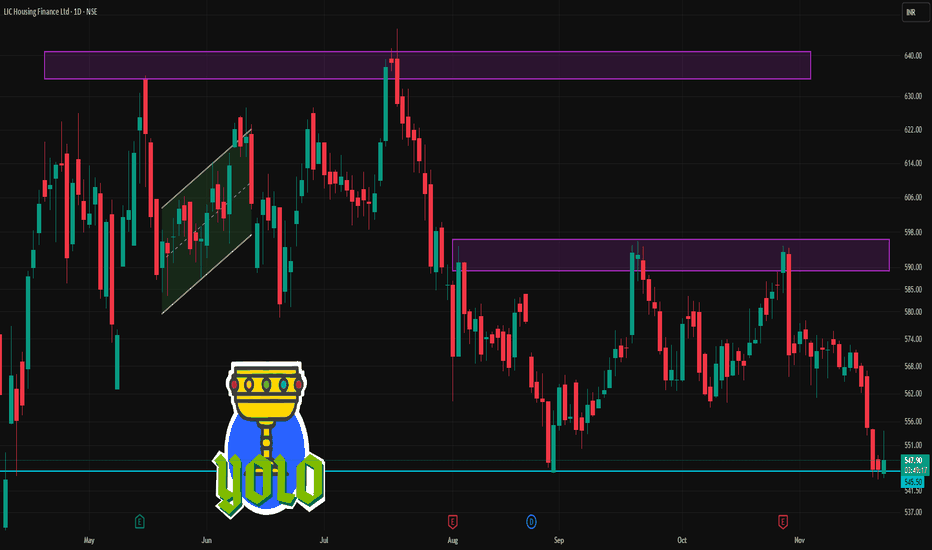
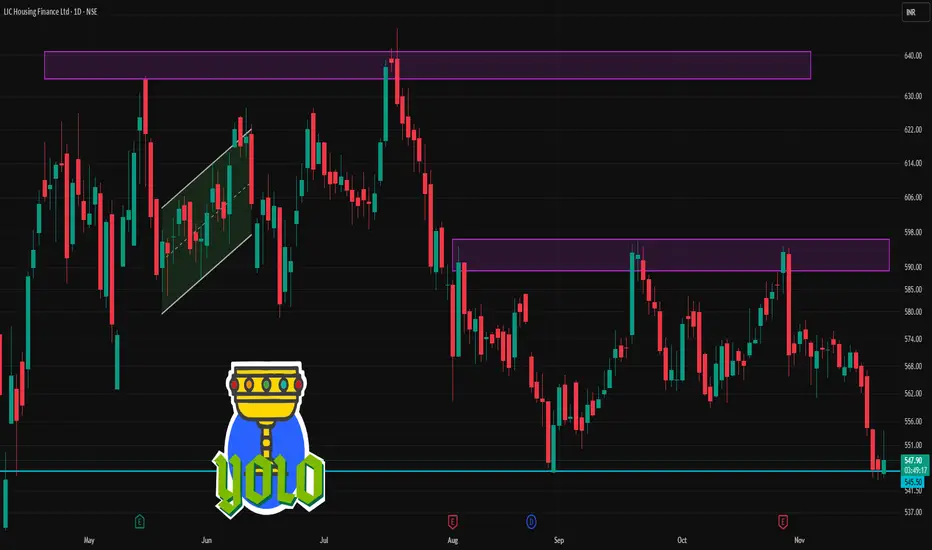
LICHSGFIN 1 Day Time Frame 📍 Key Current Levels
The stock is trading around ₹ 550 (recent quotes ~₹ 548-550) on the NSE.
Pivot & major levels (from one source) on the daily:
Classic pivot: ~₹ 550.32
Support levels: ≈ ₹ 547.39 (S1), ≈ ₹ 542.02 (S2)
Resistance levels: ≈ ₹ 555.69 (R1), ≈ ₹ 558.62 (R2)
Longer-term moving averages: 50-day MA ≈ ₹ 559.47; 200-day MA ≈ ₹ 570.32 — both above current price, indicating downward pressure.
RSI and oscillator reading: RSI around ~41 (neutral/leaning oversold) per one data point.
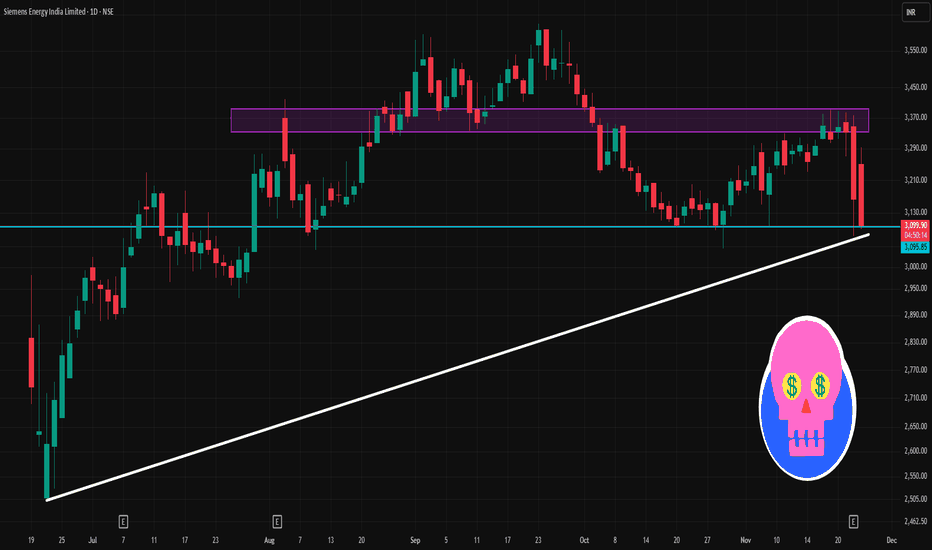
ENRIN 1 Day Time Frame 🔍 Key Price Info
Last traded ~ ₹3,090 (as of ~10:44 AM IST) on 25 Nov 2025.
Day’s high-low range: ~ ₹3,090 – ₹3,303 (intraday high reported ~₹3,303).
52-week range: ~ ₹2,508.80 – ₹3,625.00.
🎯 Support & Resistance Levels (Short Term)
Support Levels:
~ ₹3,050 – ₹3,070: close to current price, would be first level of support.
~ ₹3,000 – ₹3,030: if the stock breaks below the above, this zone becomes important.
~ ₹2,950 – ₹2,990: deeper support and closer to lower end of recent consolidation.
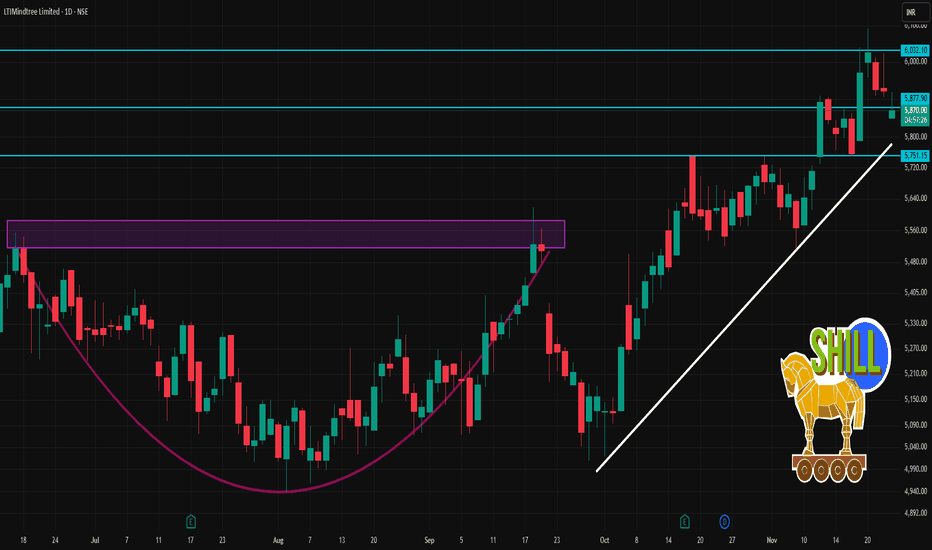
LTIM 1 Day Time Frame 🧮 Key Data Snapshot
Previous close: ~ ₹ 5,922.
Today’s intraday low: ~ ₹ 5,850.
Today’s intraday high: ~ ₹ 5,918.
52-week range: Low ~ ₹ 3,802, High ~ ₹ 6,767.95.
📌 1-Day Technical Levels to Watch
Support levels:
~ ₹ 5,850 — today’s intraday low; if price dips below this it may signal intraday weakness.
~ ₹ 5,760-5,770 — a slightly lower zone (recent intraday “floor” area) that could act as secondary support.
If those break, next meaningful structural support might be closer to ~ ₹ 5,50
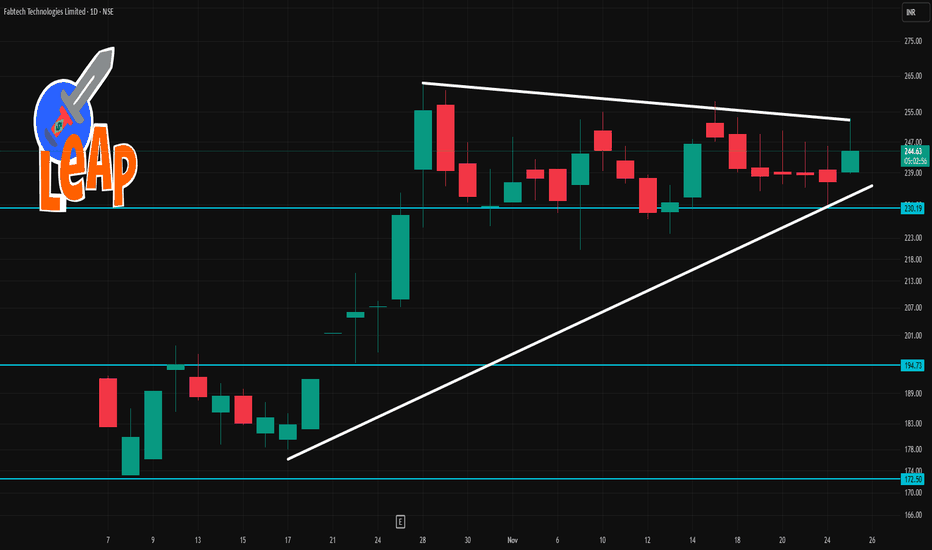
Fabtech 1 Day Time Frame 🔍 Technical Context
Moving averages (20-day, 50-day) are showing price above them, which suggests bullish bias.
Oscillators: RSI ~ 59-60 meaning moderate strength.
A recent source says the daily summary is “Neutral” on investing.com, indicating caution.
1-day pivot levels (classic) from Investing.com:
Pivot ~ ₹ 237.73
Resistance R1 ~ ₹ 240.46, R2 ~ ₹ 244.72, R3 ~ ₹ 247.45
Support S1 ~ ₹ 233.47, S2 ~ ₹ 230.74, S3 ~ ₹ 226.48
📊 Key Levels to Watch Today
Support Zone: ~ ₹ 233-2
BUY TODAY SELL TOMORROW for 5%DON’T HAVE TIME TO MANAGE YOUR TRADES?
- Take BTST trades at 3:25 pm every day
- Try to exit by taking 4-7% profit of each trade
- SL can also be maintained as closing below the low of the breakout candle
Now, why do I prefer BTST over swing trades? The primary reason is that I have observed that 90% of the stocks give most of the movement in just 1-2 days and the rest of the time they either consolidate or fall
Trendline Breakout in ASAHIINDIA
BUY TODAY SELL TOMORROW for 5%
Part 2 Introduction to Candlestick PatternsImportant Trading Principles in Options
1. Don’t Buy Far OTM Options
They look cheap but rarely become profitable.
Most expire worthless due to Theta decay.
2. Focus on ATM and Slightly ITM Options
They respond better to price movement.
3. If You Are a Beginner, Avoid Selling Options
Sellers need:
high capital
strict hedging
risk management
psychological control
4. Never Trade Without a View
Options need direction OR volatility.
5. Avoid Holding to Expiry Unless Experienced
Expiry m