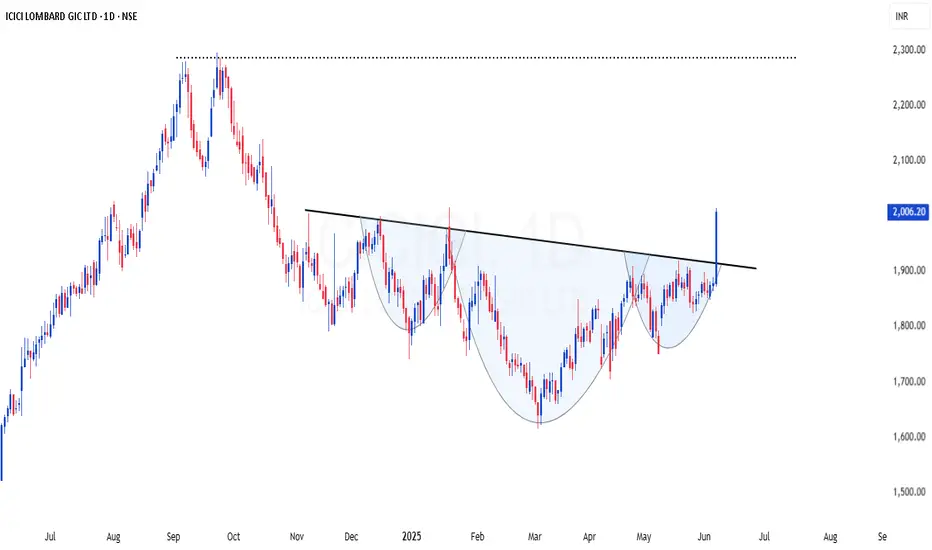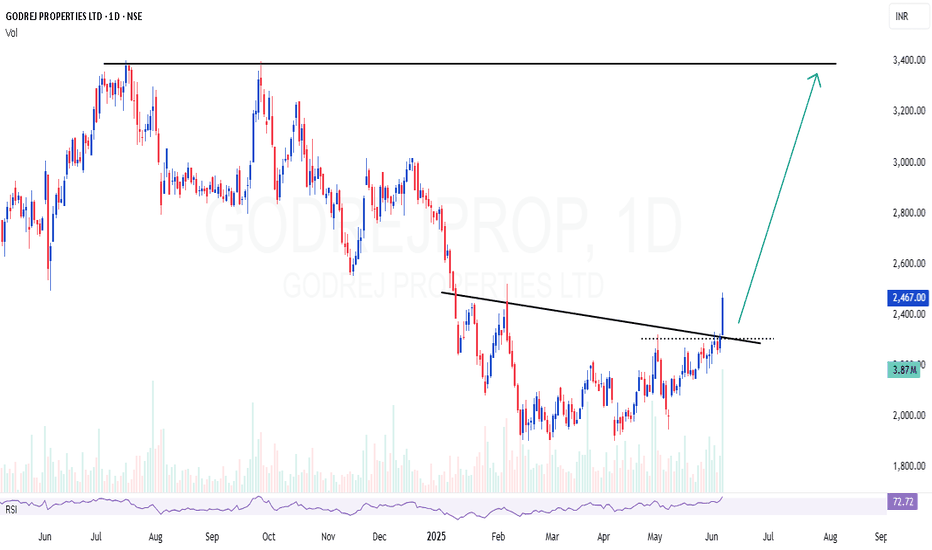
ICICIGI | High probable INHS setup - Looks good for 20-40%ICICIGI | High probable INHS setup - Looks good for 20-40%
CMP : 2006 (Dip : 1930)
SL : 1800
The stock has confirmed a classic inverted Head & Shoulders pattern on the daily chart, signaling a strong trend reversal.
✅ Breakout above neckline with decent volume, adding conviction to the move.
🎯 Immediate Target: 2300
🎯 Second Target (as per Fibonacci extension): 2700
📉 Pattern: Inverted H&S
📈 Volume: Supporting the breakout
📊 Bias: Bullish
This could be an excellent area of value for swing t
Trend Line Break
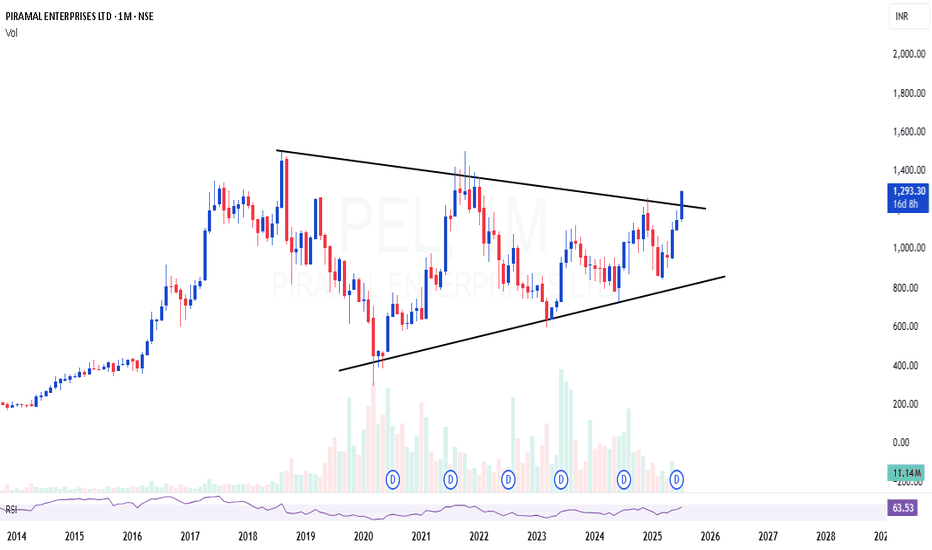
PEL | Triangle breakout after 7 years consolidationPEL | Triangle breakout after 7 years consolidation
CMP : 1293 (Dip : 1150)
SL : 1000
P
Rate Hikes & Inflation: Understanding the Impact1. Why Central Banks Hike Rates
Inflation occurs when prices of goods and services rise over time. While moderate inflation is considered normal for a growing economy, high inflation reduces purchasing power, distorts financial planning, and hurts savings.
Central banks monitor inflation targets—usually around 2% for developed economies and 4%±2% for developing economies like India.
When inflation rises above these targets, central banks raise rates to:
Reduce excess money supply
Cool off c
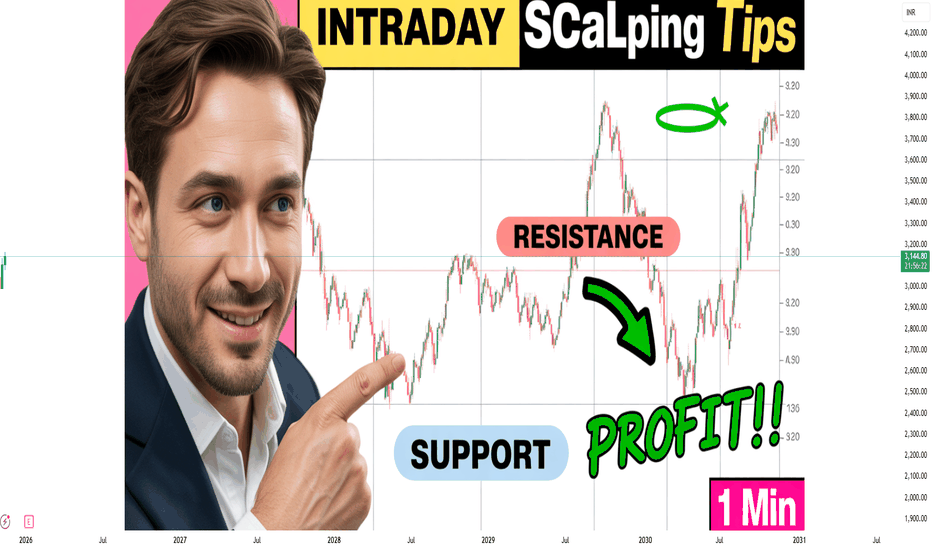
Intraday Scalping Tips1. Trade Only High-Volume Stocks, Indices, or Currency Pairs
Liquidity is the lifeline of scalping. You need instruments with tight spreads, fast order execution, and consistent movement.
Why High Volume Matters
Ensures quick entry and exit.
Reduces slippage during volatile periods.
Offers clear price patterns and clean breakouts.
Allows placing large position sizes without affecting price.
Popular choices include:
Indices: Nifty 50, Bank Nifty, S&P 500
Stocks: Reliance, TCS, HDFC Bank,
ESG and Carbon Credit Trading1. Introduction to ESG
ESG refers to a set of standards used to evaluate a company’s sustainability performance and ethical impact. It goes beyond traditional financial metrics and evaluates how responsibly a company operates.
Components of ESG
1. Environmental
Focuses on how a company impacts the planet.
Key indicators include:
Carbon emissions
Energy efficiency
Renewable energy usage
Waste and pollution management
Water conservation
Biodiversity protection
2. Social
Analyzes how a c
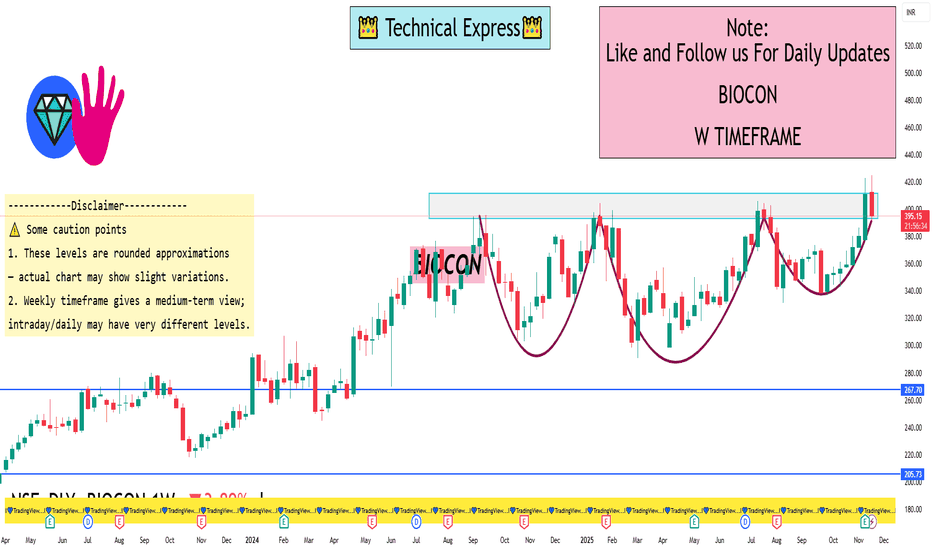
BIOCON 1 Week View📊 Recent context
Current price is around ₹390-₹395 (approx) on NSE.
The 52-week range is approx ₹291 (low) to ₹424.95 (high).
On the weekly chart one sees swings in the ~₹330-₹420 region over past months.
✅ What to monitor
A clear weekly close above ~₹425 would suggest the resistance is broken and next leg up may be possible.
A weekly close below support around ~₹350-₹365 might open the path toward the ~₹300-₹320 zone.
Volume and weekly momentum (RSI/MACD) would help gauge strength of b
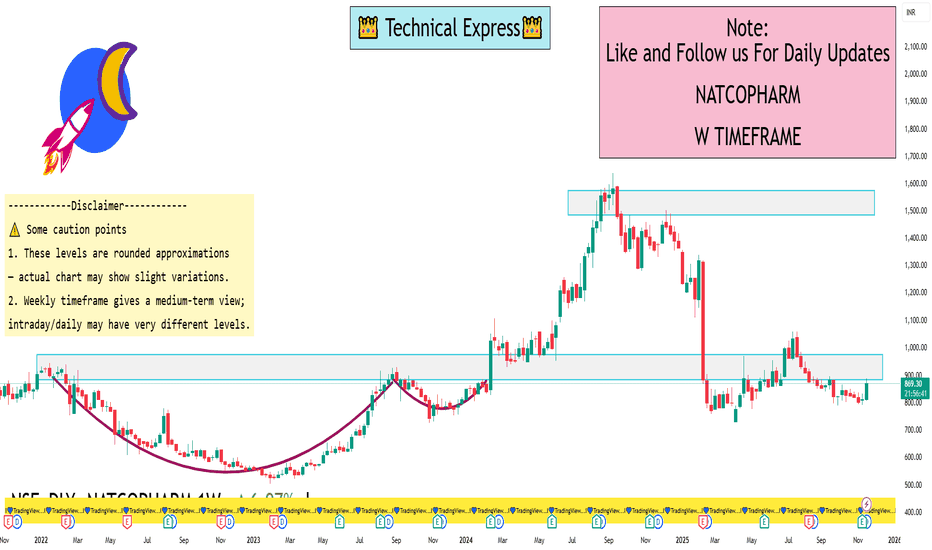
NATCOPHARM 1 Week View📌 Key figures:
Latest price around ₹870–₹875 (approx) per share.
52-week range: Low ~ ₹726.80, High ~ ₹1,505.00.
Weekly pivot point (standard) ~ ₹832.38, weekly support ~ ₹812.22, weekly resistance ~ ₹852.12.
📊 Important weekly levels to watch:
Support around ~ ₹812–₹832 (this is the pivot zone and near current price)
Stronger support if breakdown: ~ ₹792–₹772 region.
Resistance near ~ ₹852–₹872 zone.
If momentum picks up: moving beyond ~ ₹900+ could become the next resistance area (tho
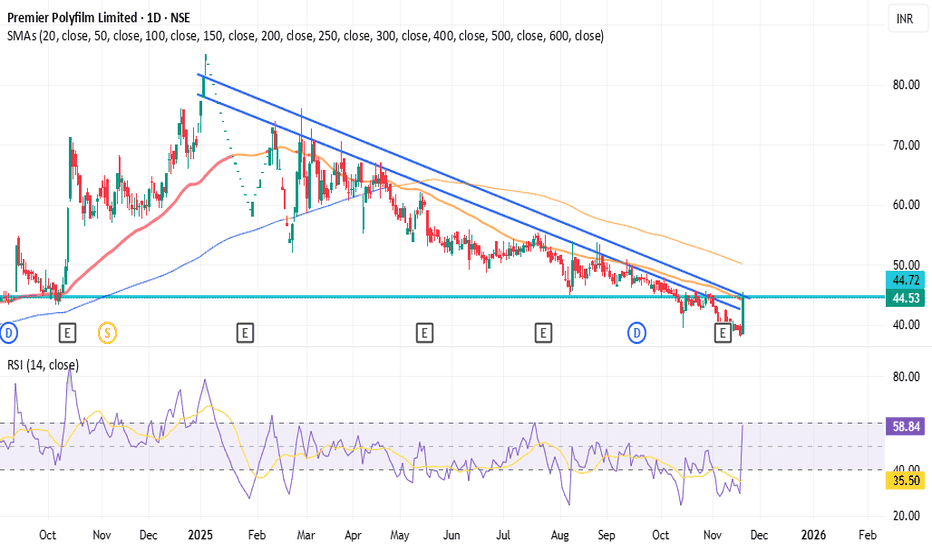
Strong candle premierpol stcok to go longThis is the high probability that stock will bounce back from the current level. A very strong bullish engulfing candle has been seen . On breakout confirmation of the resistance area as well as the marked trend line take the long entry @ 46 with SL of 37 and Target price of Rs 70. A very good risk to reward ratio. This is for your educational purpose only.
Part 2 Master Candle Stick PatternsWhat Drives Option Prices Intraday?
Several factors affect option prices every minute:
1. Underlying price movement (Delta)
2. IV changes (Vega)
3. Time decay (Theta)
4. Liquidity
5. Market sentiment
6. Hedge adjustments by institutions
Understanding these micro-dynamics helps you avoid false breakouts.
Part 1 Master Candle Stick Patterns Why Option Buyers Lose More Frequently
Option buyers lose mainly due to:
Time decay
Wrong direction
Lack of momentum
Low probability bets
Emotional trading
Most buyers attempt lottery-like trades in weekly expiries.
This is why professional traders prefer selling strategies.
Divergence Secrets Option Greeks – The Heart of Option Pricing
Option Greeks mathematically measure how an option should behave.
1. Delta
Measures direction sensitivity.
Call delta: 0 to 1
Put delta: –1 to 0
2. Gamma
Measures change in delta.
High near expiry.
3. Theta
Time decay rate.
4. Vega
Sensitivity to volatility.
5. Rho
Interest rate impact (lowest impact).
These Greeks help traders build stable and predictable strategies.
BUY TODAY SELL TOMORROW for 5%DON’T HAVE TIME TO MANAGE YOUR TRADES?
- Take BTST trades at 3:25 pm every day
- Try to exit by taking 4-7% profit of each trade
- SL can also be maintained as closing below the low of the breakout candle
Now, why do I prefer BTST over swing trades? The primary reason is that I have observed that 90% of the stocks give most of the movement in just 1-2 days and the rest of the time they either consolidate or fall
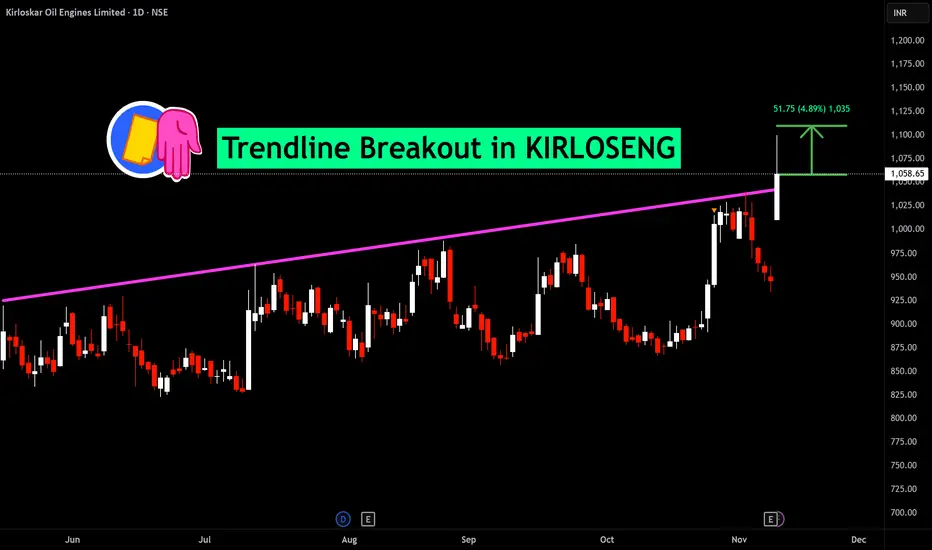
Trendline Breakout in KIRLOSENG
BUY TODAY SELL TOMORROW for 5%
Part 2 Support and ResistanceOption Premium Breakdown – Intrinsic vs Extrinsic
1. Intrinsic Value
Actual value if exercised TODAY.
For Call: Spot – Strike (if positive)
For Put: Strike – Spot (if positive)
2. Extrinsic (Time + Volatility)
Value due to time left + expectations.
This is where traders either make or lose money.
Part 1 Support and ResistanceBuyer vs Seller (Writer): The Battle
Every option trade has two sides:
Option Buyer Option Seller
Pays premium Receives premium
Limited loss Limited profit
Unlimited profit Unlimited risk (if naked)
Needs movement Makes money without movement
Option buyers need direction + momentum.
Option sellers need time + stability.
About 70–80% of options expire worthless, which is why many traders prefer selling over buying.
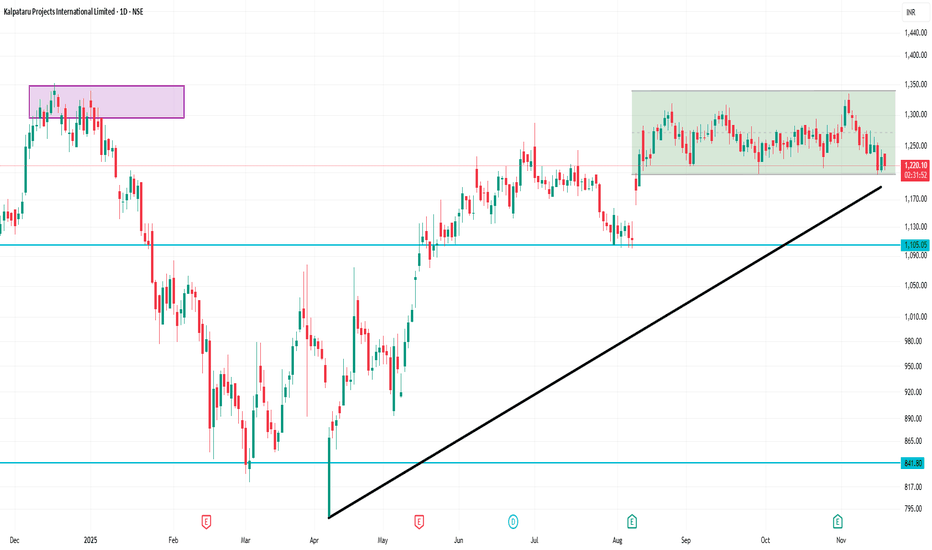
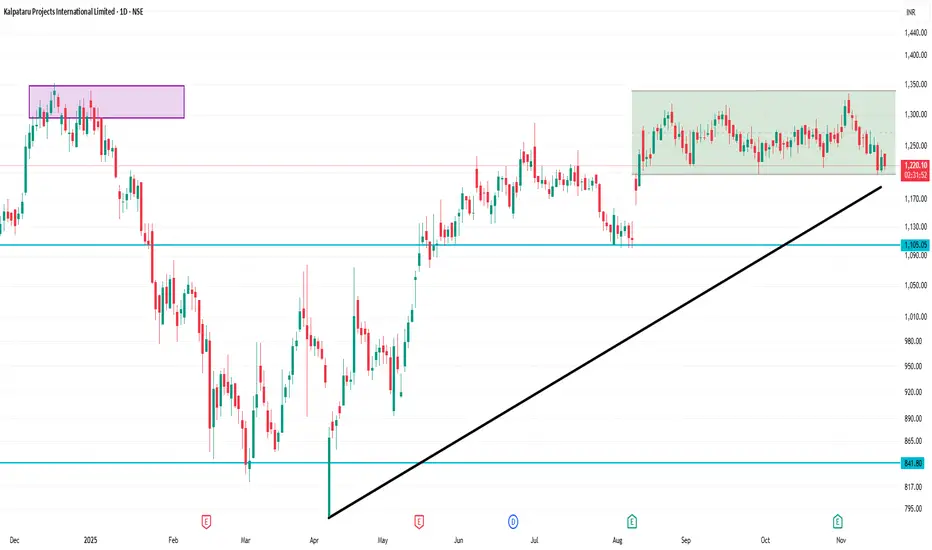
KPIL 1 Day Time Frame 📊 Current Price
Last traded around ₹1,226.90 (as of about 11:58 AM IST on 20 Nov 2025) on NSE.
Day’s low ≈ ₹1,213.10, day’s high ≈ ₹1,239.30.
52-week range: Low ~ ₹786.30, High ~ ₹1,352.85.
✅ Interpretation & Notes
The stock is hovering near the ~₹1,225 level — which is near the 100-day MA, so it’s at a kind of technical crossroads.
With the price range for the day being relatively narrow (~₹1,213 to ~₹1,239), it suggests limited intraday volatility so far.
The gap between recent price an
Part 12 Trading Master Class With ExpertsMoneyness of Options
Options are classified as:
In the Money (ITM)
At the Money (ATM)
Out of the Money (OTM)
Call Options
ITM: Stock price > Strike price
ATM: Stock price = Strike price
OTM: Stock price < Strike price
Put Options
ITM: Stock price < Strike price
ATM: Stock price = Strike price
OTM: Stock price > Strike price
Moneyness affects premium value, risk, and probability of profit.
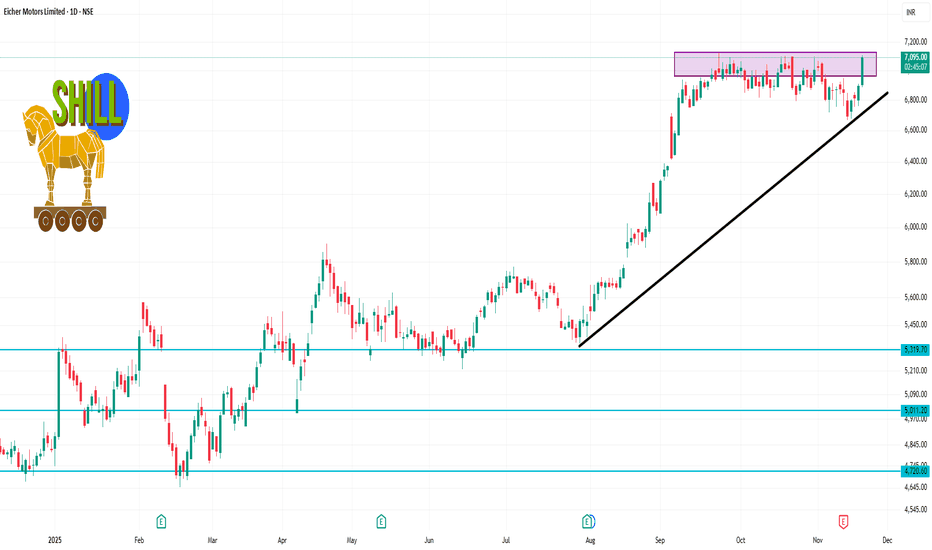
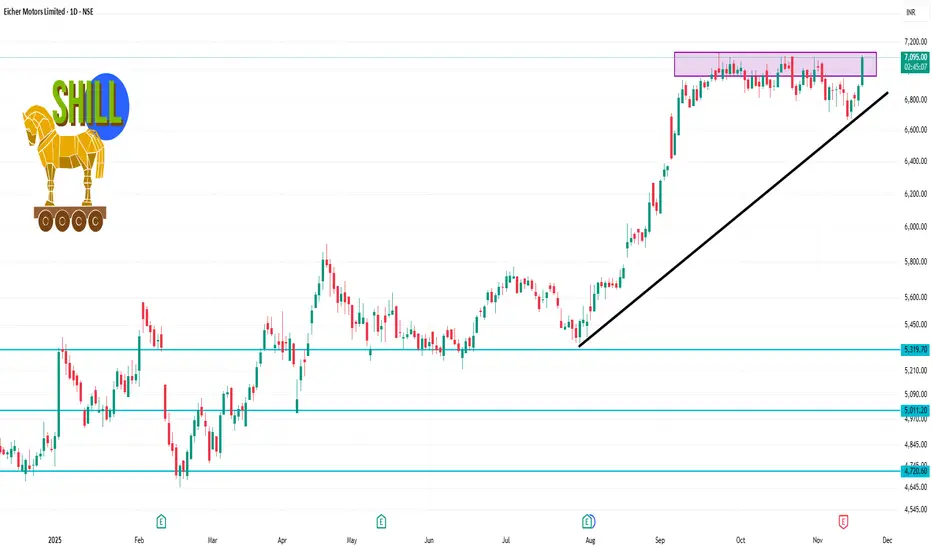
EICHERMOT 1 Day Time Frame 📋 Key price info
Current quote: ~ ₹7,084.50 (as of around midday)
Today’s high: ~ ₹7,108.00
Today’s low: ~ ₹6,886.50
52-week high: ~ ₹7,122.50
52-week low: ~ ₹4,646.00
✅ Bias / scenario (for day-frame)
Bullish: If price decisively breaks above ₹7,120 with volume, momentum could carry further.
Caution: Because price is near its highs, downside risk exists if it stalls or reverses from this resistance zone.
Intra-day trade idea: Watch how it behaves around the support ~₹6,850-₹6,900 — if
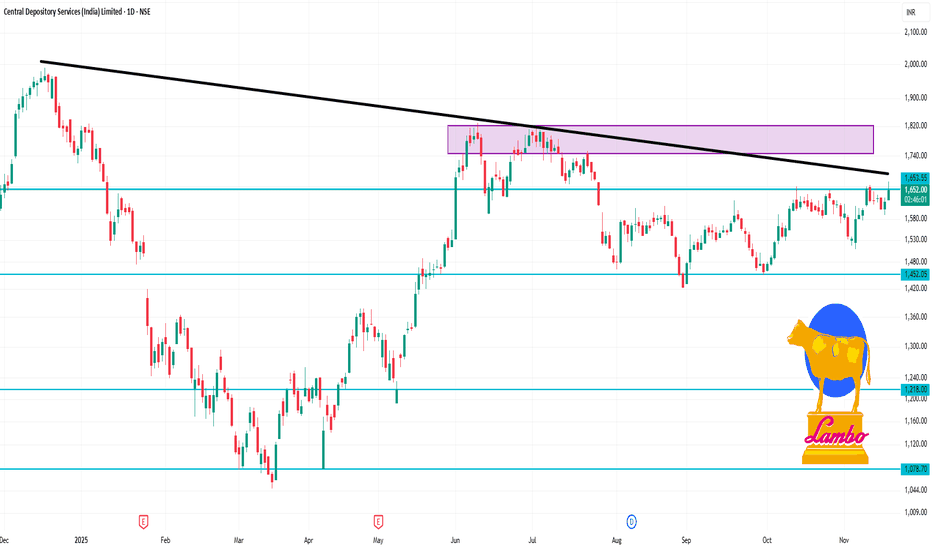
CDSL 1 Day Time Frame Stock Price & Day’s Range
The share price is approximately ₹1,625.80 on the NSE.
The day’s trading range is roughly ₹1,616 to ₹1,648.80.
52-week range: about ₹1,047.45 (low) to ₹1,989.80 (high).
On a 1-day time-frame perspective
From an intraday point of view, the range (~₹1,616-1,649) shows the market is consolidating rather than making a sharp breakout or breakdown.
Key levels to watch intraday:
Support: around the lower end of the day’s range (~₹1,616).
Resistance: near the upper end
Part 11 Trading Master Class With Experts What Are Options?
Options are financial contracts that give you the right, but not the obligation, to buy or sell an underlying asset (usually stocks, indices, or commodities) at a fixed price within a specific period.
There are two types of options:
Call Option – Gives the buyer the right to buy the asset at a pre-decided price (strike price).
Put Option – Gives the buyer the right to sell the asset at a pre-decided price.
Each option contract has three key components:
Strike Price – The
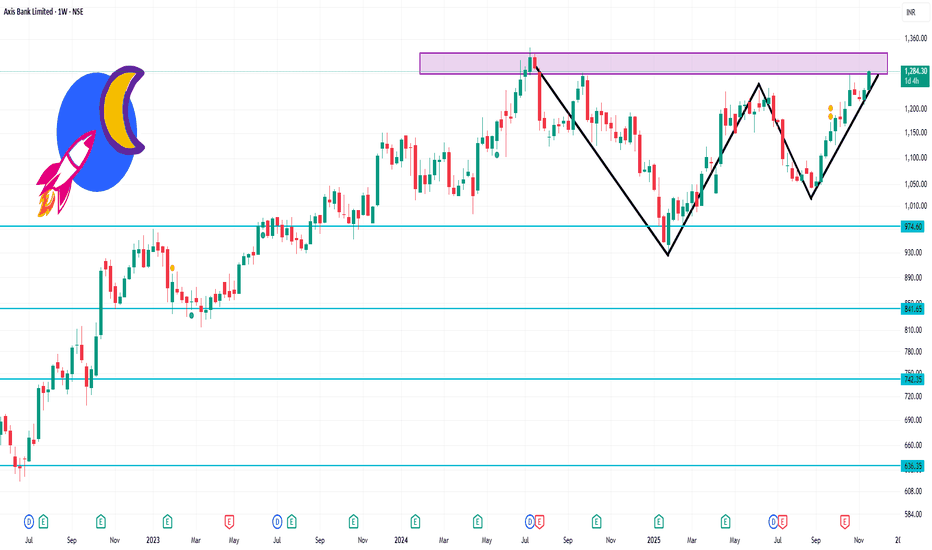
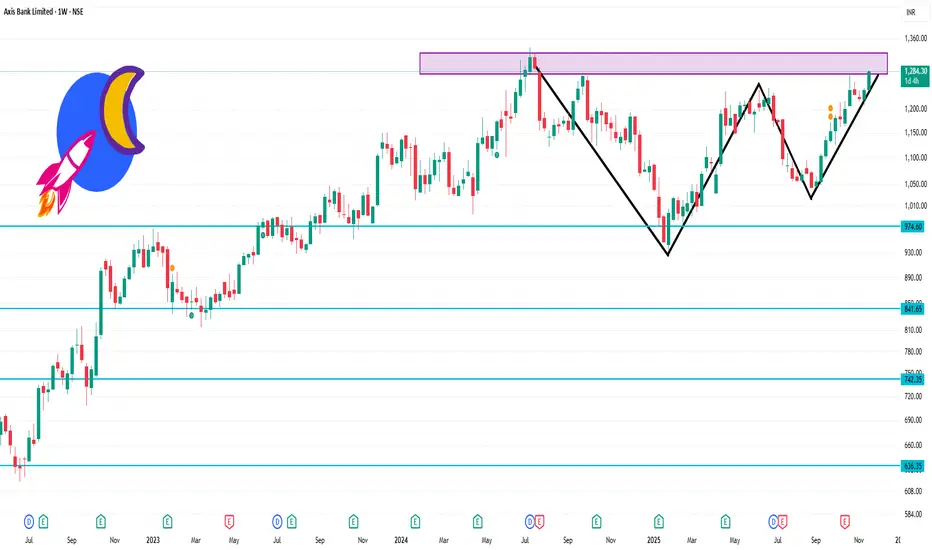
AXISBANK 1 Week Time Frame 🔍 Key Levels for the Week
Based on recent pivot/technical data:
Resistance levels: ~ ₹1,276 to ₹1,282 (around daily R1/R2)
Higher resistance: ~ ₹1,290-₹1,302 if uplink happens
Support levels: ~ ₹1,252-₹1,246 as near-term floor
Broader weekly support: ~ ₹1,232-₹1,218 region if deeper pullback
⚠️ Things to keep in mind
Current price is near the 52-week high region (~₹1,284) which increases risk of resistance/strain.
Short-term signals/pivots are useful but market news, macro banking events,
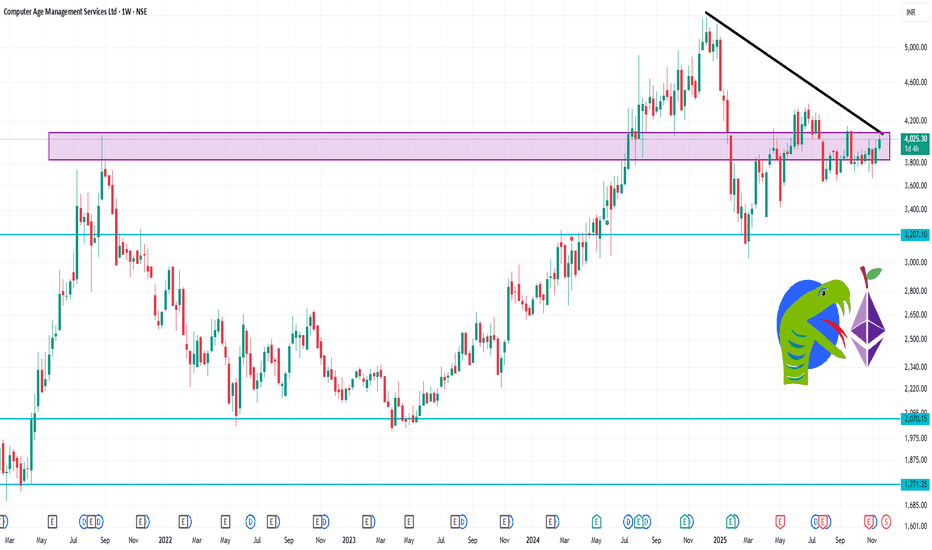
CAMS 1 Week TIme Frame 📊 Key current context
The stock is trading around ₹4,020 to ₹4,040 (approx).
52-week range: ~₹3,031 (low) to ~₹5,367 (high).
Technical pivot data shows weekly support/resistance and pivot levels.
If price holds above ~₹3,900-₹4,000 zone and shows strength, a move toward ~₹4,100-₹4,150 is plausible.
If price breaks below ~₹3,900 decisively, then ~₹3,800 and even ~₹3,670 could become the next zones to watch.
Break above ~₹4,150-₹4,200 would increase odds of testing ~₹4,300-₹4,400 zone.
⚠️ T
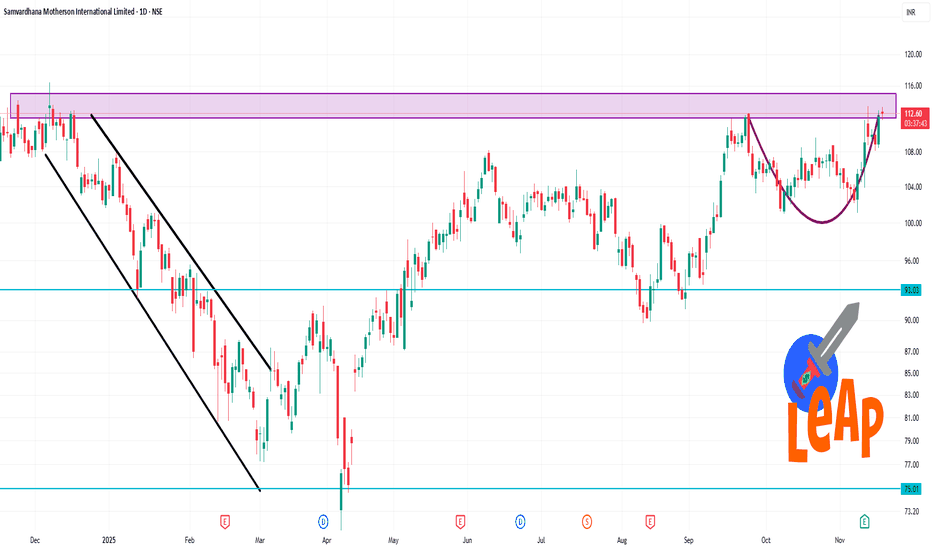
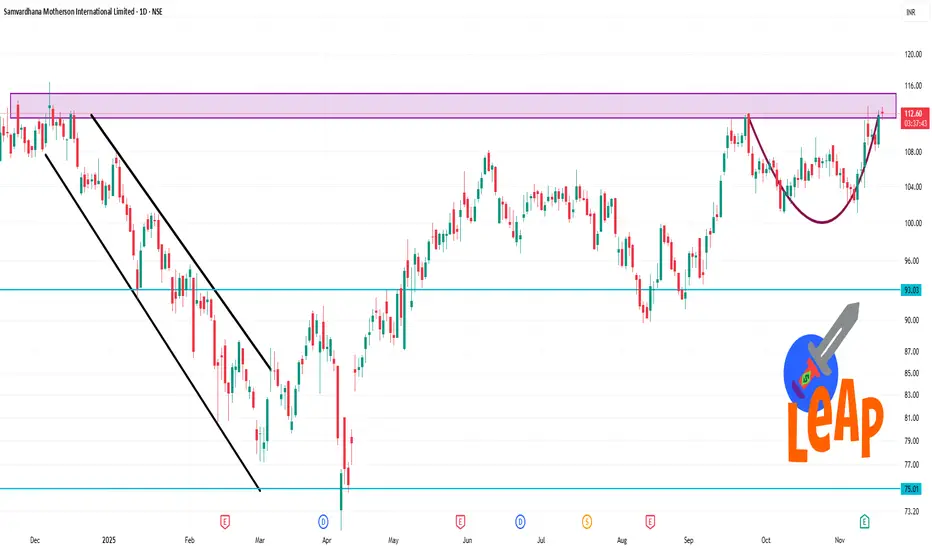
MOTHERSON 1 Day Time Frame 📊 Latest Price & Range
Last traded around ₹112.40 (as of 20 Nov 2025) on NSE.
Day’s intraday high ~ ₹113.39, intraday low ~ ₹111.78.
52-week range: ~₹71.50 (low) to ~₹116.38 (high).
✅ What to Watch Today
If price holds above ~₹112.50 and moves toward ~₹113.50-₹115, bullish bias.
If price fails to hold support near ~₹111.50 or drops below ~₹110, risk of pull-back.
Volume & broader auto-ancillaries sector trend will matter — weak sector may weigh.
Time-frame is short (intraday / daily) so
New Traders’ Mistakes That They Should Avoid1. Trading Without a Proper Plan
One of the biggest and most common mistakes is trading without a plan. Many beginners jump into the market based on tips, social media signals, or impulses. They take trades without having clear entry criteria, stop-loss levels, or profit targets. Trading without a strategy is like driving without direction—you may reach somewhere, but not where you intended.
A good trading plan should include:
Market selection (stocks, forex, commodities, crypto, etc.)
Timef