Candle Patterns Explained Candlestick patterns are one of the most powerful tools in technical analysis. They help traders understand price movements, market psychology, and potential trend reversals. Each candlestick represents four key data points for a specific time frame: Open, High, Low, and Close (OHLC). The body shows the open and close, while the wicks (shadows) show the high and low. By studying these candles in combinations, traders can forecast upcoming market moves.
1. Bullish Candlestick Patterns
2. Bearish
Trend Line Break
Advanced Hedging Techniques1. What Makes Hedging “Advanced”?
Basic hedging uses straightforward tools like:
Buying puts to protect long positions
Selling futures against a portfolio
Using simple covered calls
Advanced hedging goes several steps deeper, using:
Multi-leg derivatives
Volatility-based adjustments
Dynamic delta/gamma balancing
Cross-asset risk offsets
Market-structure aligned protection
Time decay and IV crush advantage
Partial, rolling, and ratio hedging
The idea is simple: Instead of eliminating
Technical Market Explode1. What Is a “Technical Market Explosion”?
A “market explosion” refers to a rapid price breakout driven purely by technical triggers—no fundamental news is required.
It typically includes:
A sudden spike in bullish or bearish momentum
Breakout from a key technical zone
Large volume expansion
Wide-range candles
Fast movement toward next liquidity zones
High volatility and increased trader participation
This is the type of move that surprises many traders because price travels faster than
Unlock Stock Market Gains1. The Foundation: Market Structure Is Everything
Before trying to earn profits, a trader must understand how markets move.
Market structure shows the journey of price through phases—accumulation, markup, distribution, and markdown.
1. Accumulation Phase
Institutions slowly build positions at discounted prices.
Volume is low but stable.
Retail traders usually ignore this zone because nothing exciting happens.
Signs:
Tight range movements
Higher lows on volume spikes
Long consolidation af
High-Frequency Trading (HFT) in India1. What Is High-Frequency Trading?
High-Frequency Trading is a subset of algorithmic trading that focuses on:
Extremely fast trade execution
Large volumes of orders per second
Short holding periods (milliseconds to seconds)
Taking advantage of tiny price inefficiencies
In simple terms, HFT uses powerful computers, sophisticated mathematical models, and ultra-fast internet connectivity to make profits from small movements in prices that humans cannot catch.
HFT firms compete on speed, beca
GIFT NIFTY: INDIA’S GLOBAL FUTURES BENCHMARK1. What is GIFT Nifty?
GIFT Nifty is a futures contract based on the Nifty 50 Index, traded on NSE IX (NSE International Exchange) located in GIFT City (Gujarat International Finance Tec-City).
It allows global and Indian institutional investors to trade Indian index futures for nearly 21 hours a day. Previously, these contracts were traded in Singapore under the name SGX Nifty, which was one of the largest offshore derivative products linked to India.
In July 2023, SGX and NSE integrated thei
Banking Sector Leadership in the Trading Market1. Why Banking Sector Holds Leadership in the Market
1.1 Highest Weightage in Index
The Nifty 50 allocates the largest share — around 33–38% — to financials, mainly banks.
Bank Nifty itself is a major index, made up of leading private and public banks.
When banks move, the entire index moves, causing large-scale shifts in sentiment.
Because of this high weightage, even a small percentage change in heavyweights like HDFC Bank, ICICI Bank, SBI, Kotak, or Axis Bank heavily influences Nifty’s di
AI Trading Profits1. What Is AI Trading?
AI trading refers to the use of machine learning models, algorithms, and automation to analyze markets, predict price movements, and execute trades. Unlike traditional trading, where decisions depend on human judgment, AI uses data patterns to make logical, emotion-free decisions.
AI trading systems usually combine:
Machine Learning Models
Neural Networks
Natural Language Processing (NLP)
High-frequency trading (HFT) algorithms
Automated execution engines
These sys
Part 10 Trade Like Institutions 1. Buying a Call (Bullish Bias)
You profit when the price goes above the strike price + premium.
Example:
Nifty at 22,000
You buy 22,100 CE for a ₹50 premium
Breakeven = 22,150
Above 22,150 → profit begins
2. Buying a Put (Bearish Bias)
You profit when the price goes below the strike price – premium.
Example:
Nifty at 22,000
You buy 21,900 PE for ₹40 premium
Breakeven = 21,860
Below 21,860 → profit begins
Part 9 Trading Master Class With Experts Best Practices for Safe Option Trading
Start with buying options, not selling.
Use a defined stop-loss and target.
Avoid trading during low liquidity.
Choose ATM/ITM options for better probability.
Follow trend + volume + price action.
Don’t trade based on emotions or rumours.
For selling, always hedge positions.
Keep risk per trade under 1–2% of capital.
BUY TODAY SELL TOMORROW for 5%DON’T HAVE TIME TO MANAGE YOUR TRADES?
- Take BTST trades at 3:25 pm every day
- Try to exit by taking 4-7% profit of each trade
- SL can also be maintained as closing below the low of the breakout candle
Now, why do I prefer BTST over swing trades? The primary reason is that I have observed that 90% of the stocks give most of the movement in just 1-2 days and the rest of the time they either consolidate or fall
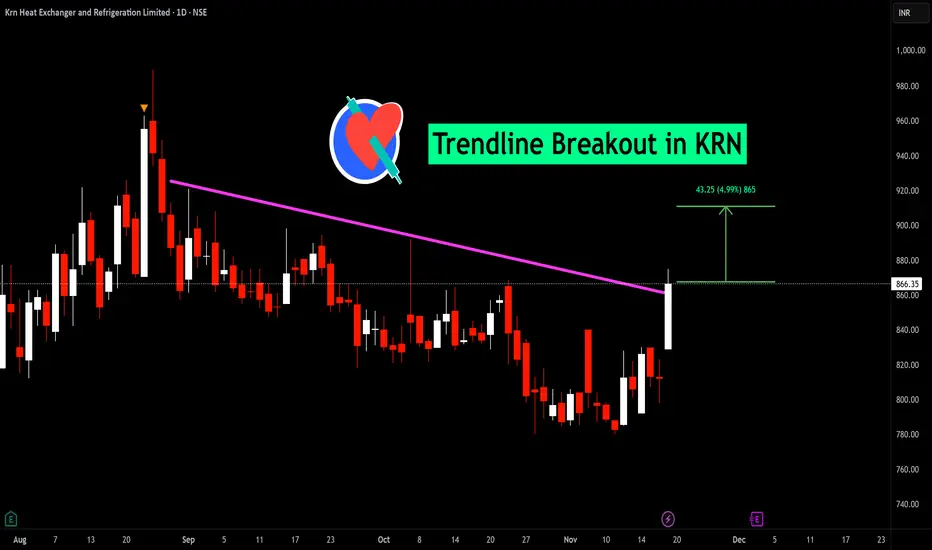
Trendline Breakout in KRN
BUY TODAY SELL TOMORROW for 5%
Part 8 Trading Master Class With Experts1. Unlimited Losses (for Option Sellers)
Selling naked options can be dangerous due to sudden market spikes.
2. Time Decay
Option buyers lose money daily if the market doesn’t move.
3. Volatility Crush
After an event (e.g., earnings), option premiums drop sharply.
4. Wrong Strike Selection
Choosing inappropriate strikes reduces the probability of profit.
5. Lack of Discipline
Options require risk management more than prediction.
Part 7 Trading Master Class With Experts 1. Delta
Measures how much the option premium changes with a ₹1 move in the underlying.
Call delta: +0.0 to +1.0
Put delta: –0.0 to –1.0
2. Theta (Time Decay)
Measures how much value the option loses each day.
Buyers suffer from Theta
Sellers benefit from Theta
3. Vega
Measures impact of volatility.
High volatility → higher premium
Low volatility → lower premium
4. Gamma
Measures how fast delta changes.
High gamma = high speed of price movement.
Part 6 Learn Institutional Trading Hedging
Investors use options to protect portfolios from sudden market falls.
Example:
You own Infosys shares
You buy a put as insurance
If the price falls, the put offsets the loss
Leverage
With a small premium, you can control a large position.
Example:
A stock worth ₹1,00,000 can be controlled by paying ₹5,000 premium.
Part 4 Learn Institutional Trading Call Option
A call option gives you the right to buy the underlying asset at the strike price.
Traders buy calls when they expect prices to go up.
Example: You buy a call option on Reliance at ₹2,500. If the stock jumps to ₹2,700, your call becomes profitable.
2. Put Option
A put option gives you the right to sell the underlying asset at the strike price.
Traders buy puts when they expect prices to go down.
Example: You buy a put on TCS at ₹3,600. If the stock falls to ₹3,300, your put ga
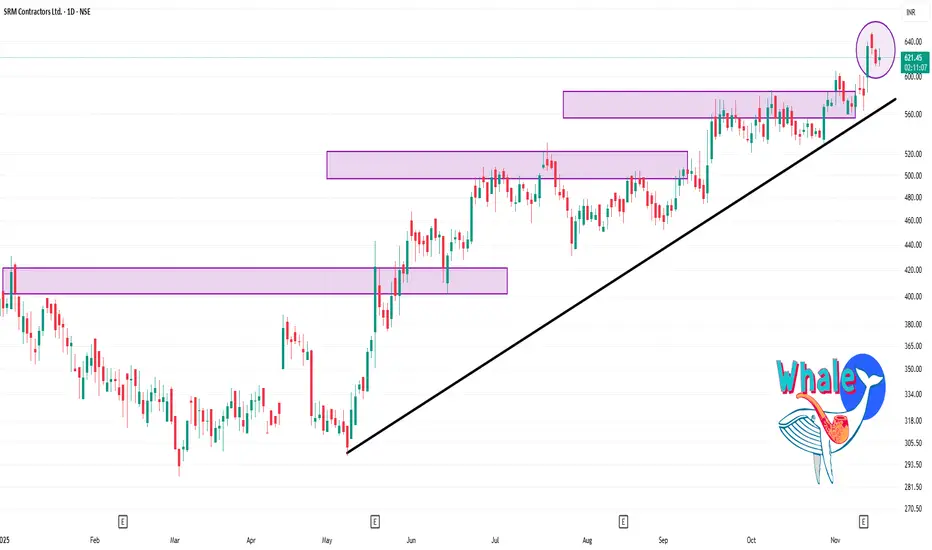
SRM 1 Day Time Frame 🔍 Key Levels (Daily Pivot / Support / Resistance)
Based on classic pivot calculations from recent prices:
Pivot: ~ ₹626.4 approx.
Resistance Zones:
R1 ~ ₹636.8
R2 ~ ₹645.3
R3 ~ ~ ₹655.7
Support Zones:
S1 ~ ₹617.99
S2 ~ ~ ₹607.6
S3 ~ ~ ₹599.1
🎯 My Short-Term View
Bullish setup: If the stock holds above the pivot ~₹626 and the support zone near ~₹617-620, it has room to test ~₹636-645 and potentially ~₹655.
Risk / caution area: If price drops back below ₹617-620 convincingly, then