The Confluence Zone: Monthly Trendline, Weekly FVG & PatternsThis chart layout is a pure price action study — designed to walk through how multiple technical structures can coexist at the same price region, and what that historically has meant in terms of market behaviour.
📊 Right Side — Monthly Timeframe:
The monthly chart highlights a well-defined ascending trendline connecting a series of higher lows. Price has returned to this trendline and is currently interacting with it as a structural support zone. This kind of trendline — built over multiple mon
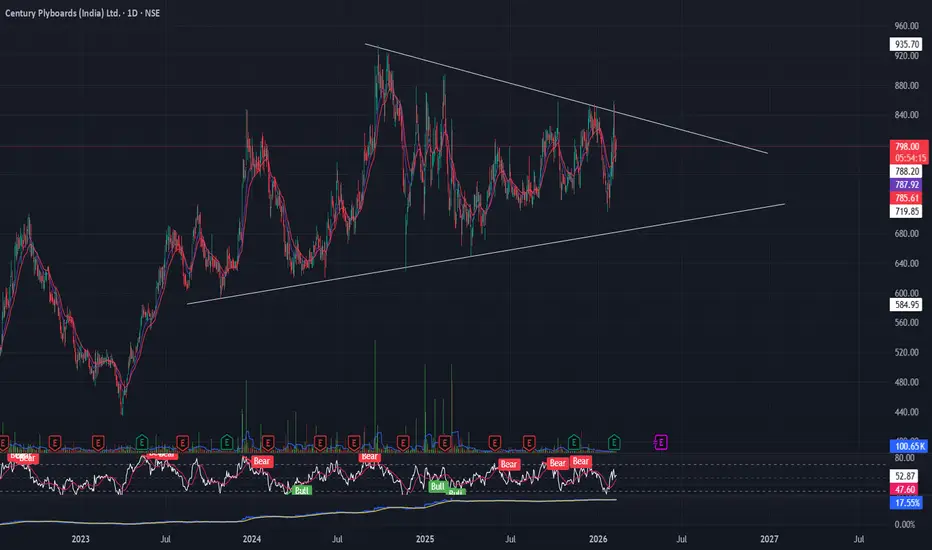
Triangle
Symmetrical Triangle 🔺 Symmetrical Triangle – Compression Near Major Resistance
🧭 Overview [ /b]
Price is consolidating within a symmetrical triangle while trading below a well-defined major resistance zone. The structure reflects tightening price action and decreasing volatility, suggesting that a directional breakout may be approaching.
⸻⸻⸻⸻⸻⸻⸻⸻⸻⸻⸻
📊 Chart Explanation
• Major Resistance Zone
The red dotted area marks a strong historical supply level. Price previously reacted from this zone, confirming act
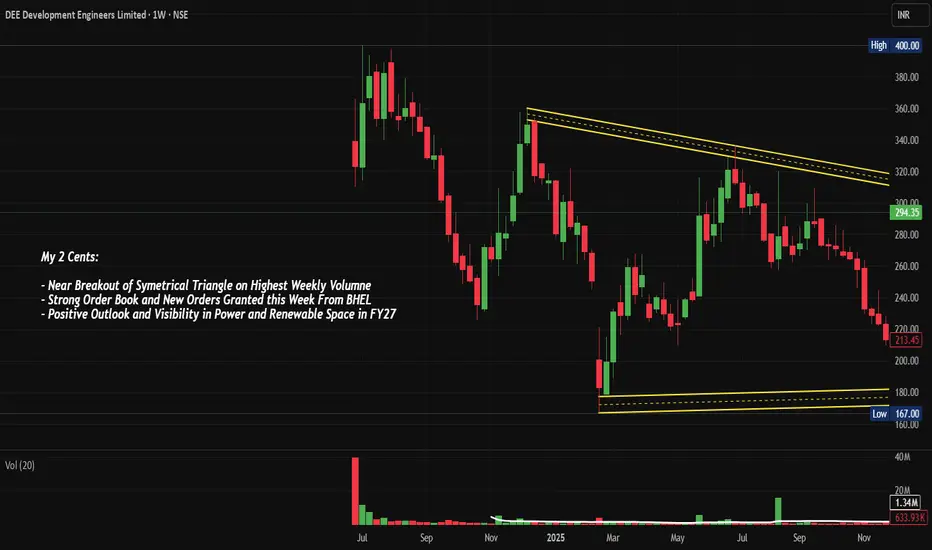
DEEDEV: Close to Breakout on Life High Vol, Chart of the WeekSymmetrical Triangle About to Explode — DEE Development Engineers Is Right at the Edge, and This Week's Volume Changes Everything Fllowing Big Order Update from BHEL. Let's Understand in "Chart of the Week"
As per the Latest SEBI Mandate, this isn't a Trading/Investment RECOMMENDATION nor for Educational Purposes; it is just for Informational purposes only. The chart data used is 3 Months old, as Showing Live Chart Data is not allowed according to the New SEBI Mandate.
Disclaimer: "I am not
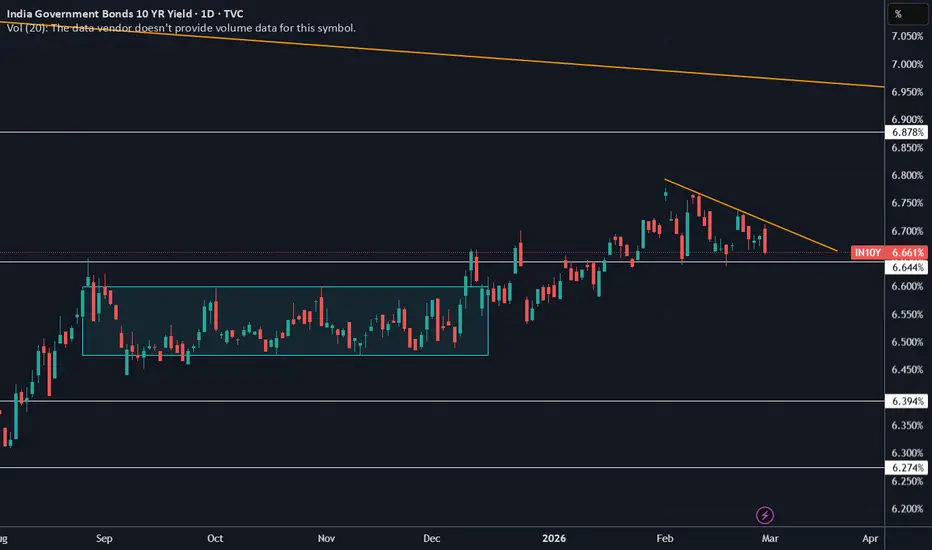
IGB 10Y Weekly/Monthly UpdateIGB 10Y has formed a descending triangle on daily charts, with 6.64% acting as a support level. A breakout from the pattern indicates a drop in the yields to 6.50%.
Hence for the coming month are expected to trade in the range of 6.50%-6.78%. 6.65% has been acting as a crucial support since last few weeks and it expected to remain the same. If it breaches, this level, it likely to find support at 6.60%, which acted as resistance in the earlier range bound motion. On the upside, if it breaches 6
Ascending triangle formation in sundaram financeA sign of good consolidation and a possible breakout in sundaram finance technical chart.
A clear breakout confirmation would only after the high of the weekly candle is crossed.
This can be a good investment opportunity based on technical pattern.
DISC: Please invest based on your financial advisor advice only. This is not a buy or sell recommendation.
Nifty - Descending Triangle FormationNifty is creating a bearish formation on a 125 Mins Time frame.
Since the time of Tariff Annoucement day nifty is not sustaining higher levels, infact in weekly timefram there is divergence on both RSI and MACD indicators.
NIfty holds a strong support at 25300 level if this is broken open doors for 24800.
Aditya Birla Sun Life AMC Ltd (D): Strong Bullish(Timeframe: Daily | Scale: Linear)
Overall View: 🐂 Strong Bullish (Ascending Triangle Breakout)
The stock has confirmed a major structural breakout from an Ascending Triangle. Despite intraday profit-booking today (forming a bearish-looking candle), the broader trend remains powerfully intact as it sustains above previous resistance levels.
🚀 1. The Fundamental Catalysts (The "Why")
The technical breakout is heavily supported by sector and company-specific tailwinds:
> Q3 Earnings Momen
Dr. Reddy’s in a diamond patternDr. Reddy’s
Structure: Diamond / Compression Pattern
-Breakout Level: 1300
-Target: 1612
-Stop Loss: 1167
Why it matters:
Healthcare showing relative strength on RRG.
Symmetrical contraction → volatility expansion setup.
Risk: Failed breakout may retest lower trendline.
BSE - Technical AnalysisBSE 30-Min Chart Analysis
Current Situation:
Price: 2738 (down 0.15%)
Adaptive MA (20): 2753.57 — price is below the MA, bearish bias
Price is sitting at/near the lower support zone (~2725–2740)
Key Levels
Level - Type
2808.20 - Resistance
2782.30 - Resistance
2754.90 - Resistance
2753.57 - Adaptive MA
2738.00 - Current Price
2712.80 - Support
2594.50 - Major Support / Bearish Target
Chart Annotation Reading
The chart has two drawn scenarios:
🔵 Bullish Arrow (lower probability):
TORRENT POWER:Likely Tri-Angle Breakout -Huge Target is on cardsTORRENT POWER
-Formed a Triangle Pattern in weekly chart
-Trading at 1429 and above Tri-Angle Pattern Trend line
-trading above all its critical Moving averages Viz 10/20/50/100 in Daily Charts
-Stochastic RSI -Positive divergence at cross over 40 suggests trend reversal and possible upside
-Combination of the Tri-angle pattern break out,Stochastic RSI Positive divergence and cross over,increase in volume suggests a possible move towards TGT :1500 TGT 2:1600+(For educational purpose only)
Price Perfection: Inverted H&S, Red Zone FlipObserve the pristine price action on this chart, where every level commands unwavering respect.
-Red Zone (Initial Resistance): Price traded lower beneath this key red zone, forming a textbook inverted head-and-shoulders pattern below it—left shoulder, head, right shoulder clearly defined, signaling potential reversal setup.
-Zone Flip to Support: Once price sustained above the red zone, it flipped roles seamlessly, acting as reliable support for an extended period. This classic resistance-to-
Monthly Triangle After Epic RallyThis Post is just to showcase how beautifully the price action respects every key level, No Bias - No forecasting simple creation of price action over historical chart levels
Look at this clean pattern forming on the monthly timeframe after that massive one-sided rally.
Price beautifully respects the structure:
-Descending upper trendline (green) capping the highs with precision.
-Flat lower support (green) holding as the base—tested multiple times without breaking.
-Before the pattern, notic
RVNL cmp 310 by Weekly Chart viewRVNL cmp 310 by Weekly Chart view
- Support Zone 265 to 302 Price Band
- Resistance Zone 375 to 415 Price Band
- Rising Support Trendline providing a stable shoulder
- Descending Triangle formed at Support Zone anticipating upside breakout
- Volumes seen by Selling pressure but demand based buying cushioning it out
- Support Zone forming strong base ground and holding price and volumes front
Sterlite Tech (W): Aggressive Bullish (Decadal Breakout)(Timeframe: Weekly | Scale: Logarithmic)
The stock has confirmed a breakout from a 10-Year Symmetrical Triangle (2014–2025). Unlike previous attempts (which left long upper wicks), this week shows a strong closing candle above the resistance, supported by "Climax Volume."
🚀 1. The Fundamental Catalyst (The "Why")
The technical explosion is fueled by a structural shift in business prospects:
> US Market Opening: The reduction in US tariffs removes a major overhang, making STL competit
XAUUSD GOLD Analysis on (09 Feb 2026)#XAUUSD UPDATEDE
Current price - 5003
If price stay above 4970,then next target 5050,5090 and below that 4900
Plan1;If price break 5000-4990 area,and stay above 5005 we will placed buy order in gold with target of 5050 and 5090 & stop loss should be placed at 4970
When Price Respects Structure: MTFAThis post is not a forecast and not a trade idea.
It’s simply a visual study of how price behaves when multiple higher-timeframe elements overlap.
Using historical price action only, this chart highlights:
-Monthly Fair Value Gap (Green Zone)
Showing how price reacts, respects, and rebalances inefficiencies over time.
-Monthly Supply Zone (Red Zone)
Clearly defining areas where price historically showed strong selling interest.
-Higher Timeframe Symmetrical Triangle (Green Lines)
Drawn from a b
POWERGRID: Trend Reversal Indicators & Key LevelsThe stock of POWERGRID is showing signs of a potential trend reversal after an extended downtrend. Several technical factors across multiple timeframes support this shift in momentum.
The stock has recently managed to close above the 200-day EMA, a level widely monitored for assessing long‑term trend shifts. A golden crossover—where a shorter‑term moving average crosses above a longer‑term one—has also taken place.
This movement has been supported by strong trading volume, adding weight to th